BCHUSD H4 | Bullish Bounce Off Pullback SupportBased on te h4 chart analysis, we could see the price fall to our buy entry level at 577.67, which is a pullback support that lines up with the 78.6% Fibonacci retracement.
Our stop is set at 552.67, which is an overlap support.
Our take profit is set at 619.93, which is a multi swing high resistance.
High Risk Investment Warning
Stratos Markets Limited (
BCH

BCH - LONG IDEAMy long-term review: It's a profitable trade that continues to this day.
(RU version) -
Now may be a good time for those who don't want to wait months to enter.
We have a beautiful 4H FVG long position, so let's see how it reacts. If it consolidates, we enter. If it falls below the lows, we ignore the idea.
It's very simple. The nearest target is $700+.
BINANCE:BCHUSDT.P

BITCOIN CASH Analysis (4H)From the point marked with the green arrow on the chart, Bitcoin Cash has formed a bullish diametric pattern. At this stage, wave E of the diametric appears to be completed, and price has entered wave F.
We have identified two entry zones on the chart, where positions should be built using a DCA strategy.
The targets for wave G have been clearly marked on the chart.
A daily candle close below the invalidation level will invalidate this scenario.
For risk management, please don't forget stop loss and capital management
When we reach the first target, save some profit and then change the stop to entry
Comment if you have any questions
Thank You

BCH Buy/Long Signal (4H)The structure of Bitcoin Cash is bullish and it continues to form higher highs and higher lows.
Each bullish wave in this fractal moves more than 1 percent and the previous lows are not taken. We expect the same behavior this time as well with the price rising at least 19 percent.
Therefore buy or long positions can be considered at the support levels of the previous wave.
The targets are marked on the chart.
Do not enter the position without capital management and stop setting
Comment if you have any questions
thank you

Bitcoin cash looks set for a weekly rally! Technical outlook [ NYSE:BCH / USDT]:
✅ Bullish
✅ Ascending structure weekly (bull accumulation likely)
✅ Ascending accumulation structure (above uptrend) monthly!
Accumulation under resistances often lead to explosive move!
The current price is stuck under the 630 & 705 resistances, but a weekly candle break above $630 could unleash a huge bull rally!
I see an upcoming rally toward 860then 980 - $ 1,000 📈
The good question is when sir? 👀
⚠️ Not financial advice - DYOR.

BCH: $700–$800 Before the Next Bear MarketBCH Macro Resistance Before Bear Market
Based on historical price structure, Bitcoin Cash (BCH) appears to be approaching a macro resistance zone around $700–$800 , which has previously marked the final upside before major bear markets.
In 2018 and 2022, BCH followed a very similar pattern:
A prolonged accumulation phase
A strong push into a horizontal resistance zone
A rejection from that zone, followed by a deep bear market decline
The current structure closely mirrors those past cycles. Price is once again testing the same historical supply zone, where sellers previously stepped in aggressively.
Key idea:
I expect BCH to reach the $700–$800 range
This level could act as the last distribution zone before the broader market transitions into a new bear market phase
This is not a short-term trade idea, but a macro perspective based on repeating market behavior and long-term resistance reactions.
⚠️ As always, confirmation is needed, and this scenario is invalidated i f price accepts and holds above the resistance zone.

BCHUSD Wants to Run Drawn a large broadening structure allowing the formation of the next bull move up to the upper line.
ALT SEASON ?
Weekly chart

BCHI expect Bitcoin Cash to make a 25% correction from this level. This is the first flag, and it may not correct here and instead wait for the second flag, then pull back to the level I’ve marked.
The analysis is based on a strategy called NDS.

BCH Sell/Short Signal (1H)Add this symbol to your watchlist and enter the position once it reaches the entry zone.
Considering that BCH is in a bearish structure on the hourly timeframes, we are looking for sell/short opportunities at order blocks and origin zones.
We have identified two targets. At the first target, secure partial profits and then move the position to break-even.
Do not enter the position without capital management and stop setting
Comment if you have any questions
thank you

BCHUSDT Bulls Beware? Price Just Triggered a Classic TrapYello Paradisers! have you noticed how BCHUSDT just tapped into a key resistance right after sweeping liquidity above previous highs? This could be the perfect bull trap, and what comes next might catch many traders off guard if they’re not prepared.
💎BCHUSDT has just taken inducement and is now reacting from a strong resistance zone. Price is currently moving within an ascending channel while also showing clear bearish divergence, a combination that increases the probability of a bearish move. This setup suggests that momentum is weakening despite higher price action, often a red flag for trend continuation.
💎Aggressive traders may already be looking to enter short from current levels. However, the more strategic and safer approach is to wait for another reaction from the resistance zone, ideally accompanied by a clear bearish candlestick pattern. That will give us a much higher probability entry with a more defined invalidation level. If this confirmation comes, we can then look to target the liquidity pools and support zones lying below.
💎That said, if BCHUSDT manages to break and close above the resistance zone with strength, it would completely invalidate our bearish scenario. In that case, it’s best to stay on the sidelines and wait for fresh price action to develop before taking any new trades. Chasing trades without structure is where most traders lose.
🎖Strive for consistency, not quick profits. Treat the market as a businessman, not as a gambler. Stay patient, disciplined, and focused only on high-probability setups, this is the only way you’ll make it long-term in this market.
MyCryptoParadise
iFeel the success🌴

8 Years Break ? Bitcoin Cash $BCH ! 1. The Resistance Line (The "Bear" Trend)
The descending trendline (top line) connects the major peaks:
Point 1 (Dec 2017): The All-Time High / Cycle Top.
Point 2 (2021): The mid-cycle peak.
Points 3 & 4 (2024-2025): Recent lower highs where sellers stepped in.
Significance: Every time the price touched this line previously, it was rejected forcefully. This created a sequence of Lower Highs, indicating selling pressure.
2. The Support Line (The "Bull" Trend)
The ascending trendline (bottom line) connects the major lows:
2018 Lows: The bear market bottom.
2022/2023 Lows: The accumulation phase post-FTX crash.
Significance: The market established a sequence of Higher Lows, indicating that buyers are stepping in at increasingly higher prices over the long term.
The Breakout Zone: Point 5
Point 5 represents the apex of this multi-year compression.
The Breakout: The chart indicates that BCH has pierced the long-term descending resistance line (around the $450-$500 zone).
Current Price Action ($566.28): The current price is trading above the breakout trendline. This is technically a bullish confirmation. The price action immediately following Point 5 looks like a "backtest" or "consolidation," where the previous resistance is being tested as new support.
Projections and Targets
The chart features a large upward arrow projecting a parabolic move. Here are the technical targets based on this structure:
Intermediate Resistance: The first major hurdles are likely the previous swing highs around $700, followed by the 2021 highs around $1,600.
The "Measured Move" (Macro Target): The horizontal dotted line at the top of the chart sits at $4,338.94.
This target likely corresponds to a retest of the 2017 All-Time Highs.
In T.A., the target of a triangle breakout is often calculated by measuring the height of the back of the triangle (2017-2019 range) and projecting it from the breakout point. This calculation aligns with the arrow pointing toward the $3,000 - $4,500 region.
This is a classic "volatility compression" play. The chart suggests that the long "crypto winter" for BCH is ending. The break of the 8-year downtrend line is the most significant technical event on this chart.

Monday Market overview: BTC,BNB,BCH,GBPUSD 10:13 12/08/25Looking for tasty long entries on GBP/USD and BNB/USDT for this week. I am making sure to manage my positions correctly so that even if they loose I still make money. My main focus is BCH I think this has potential to go up to the prior ATH of around 4k. I don't think the crypto bull market is over I reckon we will have a crazy December, early Jan to around the 13th. There's a chance we go on until around march but we will just react to what the market is telling us.
I briefly looked over Gold and US indices, they are not my trading focus at the moment....
DISCLAIMER: I am not a financial adviser. Investing and trading is risky, and you can lose your money. The information in this video should not be used to make any investment decisions. You should contact a licensed financial adviser prior to making any investment decisions. Any affiliate links in the description of these videos may provide a commission if you decide to purchase their products. I appreciate any and all support of my channel, and without you, I wouldn't be here. Thank you.

$BCH is building bullish momentum on the weekly basis CRYPTOCAP:BCH is building bullish momentum on the weekly basis 🚀
Chart structure looks solid. I'm seeing an ascending consolidation / flag structure forming on the weekly timeframe.
A breakout above the main trendline + confirmation above 620$ would likely trigger a push towardthe 980 - $1,000 key resistance zone.
Key level to be maintained: 440$.
Adoption is in the pipeline! 🚀
More data & key levels in my charts.

Bitcoin Cash (BCH) Preparing for a Breakout MoveBCH is currently trading inside a rising wedge structure, where price keeps creating higher lows while struggling to clear the upper resistance. This pattern often appears before a decisive expansion in volatility, either as a continuation or as a reversal depending on how the breakout occurs.
Recent price action shows rejection at the upper boundary, followed by a pullback into a fib cluster between 0.382 and 0.786. This zone acts as a short term decision point, where the next directional move is likely to originate.
The market structure remains constructive as long as BCH holds above the rising wedge support. A controlled retracement into the grey demand block keeps the bullish case intact, while a deeper breakdown would shift momentum in favour of sellers.
Key Technical Notes:
• Rising wedge structure guiding current trend
• Clear fib retracement confluence inside the demand block
• Higher lows indicate buyers are still defending structure
• Breakout above the wedge can trigger an impulsive move
• Breakdown from wedge support opens a larger correction
Bullish Scenario:
A bounce from the fib cluster and a breakout above the wedge resistance can open a rapid expansion toward the 720 region. Momentum would accelerate if buyers reclaim the mid channel levels with strength.
Bearish Scenario:
Losing wedge support flips the entire structure short. In that case, BCH may slide toward 446 where major liquidity sits.
In simple terms:
BCH is compressing inside a rising wedge. A breakout means continuation toward 720, while a breakdown exposes 446. Watch the fib cluster for confirmation of direction.
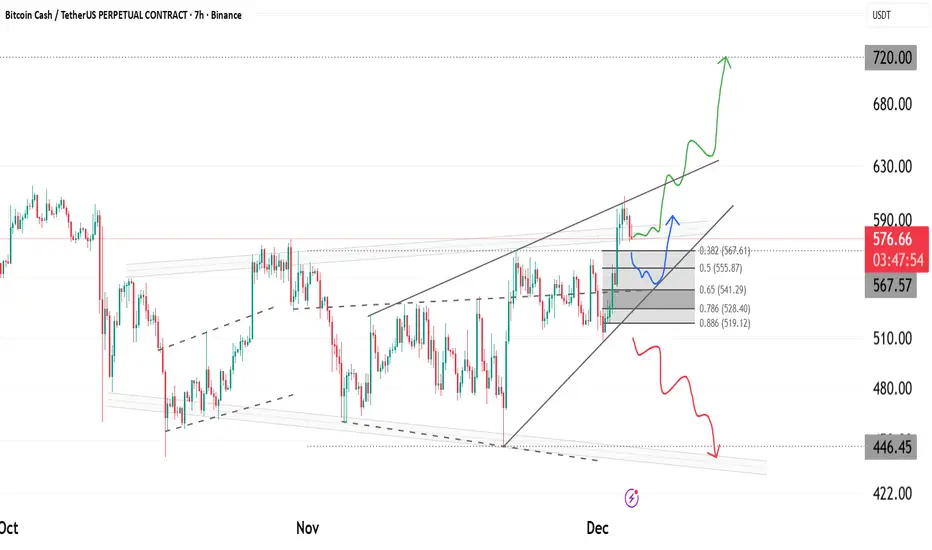
The key is whether it can break above 588.5-616.2
Hello, traders!
Follow us to get the latest information quickly.
Have a great day.
-------------------------------------
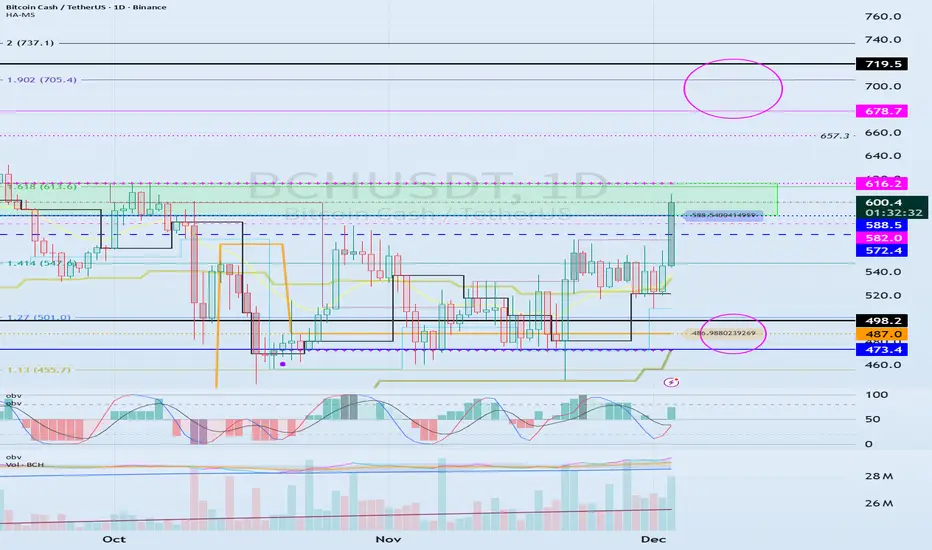
(BCHUSDT 1D chart)
The 1D chart is rising towards the HA-High ~ DOM (60) range, raising expectations for a bullish trend.
Accordingly, the key question is whether the 588.5-616.2 range can be supported and the price can rise.
If it rises, we should examine whether it can break above the 678.7-719.5 range, which is the range formed by the DOM (60) indicator on the 1M chart and the previous high.
To continue the uptrend by breaking above key points or ranges, the StochRSI, TC, and OBV indicators must show upward trends.
If possible,
- The StochRSI indicator should not have entered an overbought zone.
- The TC indicator should remain above zero.
- The OBV indicator should remain above the High Line.
Therefore, we should examine the movements of the StochRSI, TC, and OBV indicators when the price rises above the DOM (60) indicator.
If the StochRSI falls below 80, it's considered a stop loss, as further declines are likely.
-
Thank you for reading.
We wish you successful trading.
--------------------------------------------------
I've lost my patience with BCHMoB point... (682) I don't have much hope for pump... If the whales decide to buy... all of the above targets are possible and easy.
1. Picture before my patience runs out
2. Picture what I would like before my patience runs out.
P.S.
BCH at $5.500 || market cap $111,00B
BCH at $16.500 || market cap $333,00B

FireHoseReel | BCH: Ready to Shock the Market ?🔥 Welcome To FireHoseReel !
Let's dive into the BCH ( BitcoinCash ) 4H analysis .
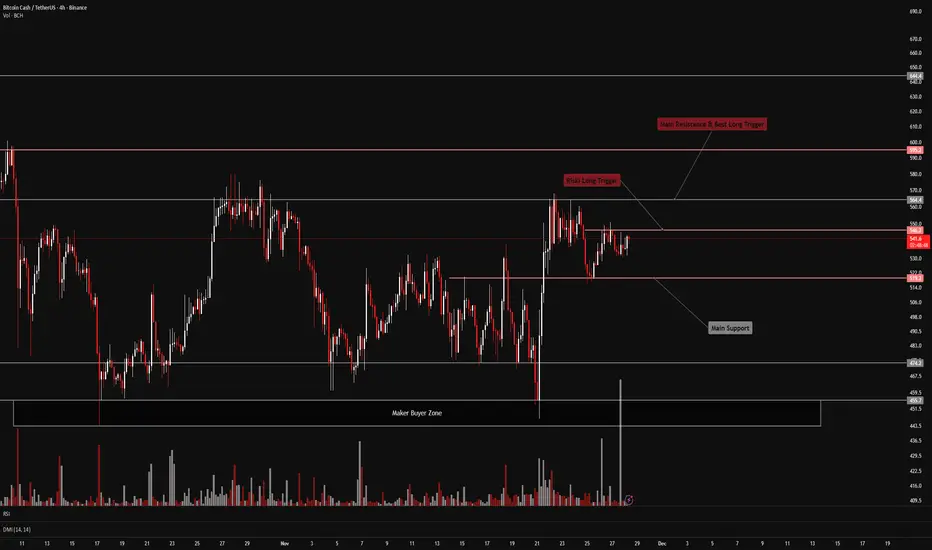
👀 Bitcoin Cash (BCH) – Market Structure Overview
After reacting strongly from the major buyer zone, Bitcoin Cash pushed higher and attacked the $564 resistance directly.
Price then faced rejection at this level and entered a multi-timeframe corrective phase. During this correction, sell volume declined, and in the most recent 4-hour candles, buy volume has increased noticeably.
BCH has now formed an early long trigger around $546.
If this level breaks with multi-timeframe confirmation, we can look for early long positions, anticipating a future breakout above $564.
📊 Volume Is the Key Signal
Pay close attention to BCH volume — volume is more important than price here.
Right now, after price reached the $546 resistance zone, we’re seeing a strong surge in buy volume that hasn’t appeared for several days.
This behavior can be an early signal of a trend shift and the potential start of another bullish rally.
✔️ BCH/BTC Additional Market Perspective Looking at the BCH/BTC pair, price has moved upward very smoothly and is currently in a corrective phase.
The support and resistance levels that generate entry triggers are clearly defined — and these levels align perfectly with the BCH/USDT pair.
Early trigger: 0.005961
Safer trigger: 0.0062
These levels can be used for multi-pair confirmation.
📌 Trading Scenarios for Bitcoin Cash
You can review the following scenarios alongside your own strategy:
🟢 Long Scenario
A breakout above the $546 high, supported by rising buy volume, can offer a solid early long setup.
This setup is mainly for front-running the main breakout with lower initial risk.
If BCH later breaks and confirms above the stronger resistance at $564, we can safely add more size to existing long positions.
🔴 Short Scenario
Since the BCH/BTC pair is currently in a strong bullish structure, I do not expect a deep correction for Bitcoin Cash at this stage.
Therefore, short setups are not preferred in the current market context.
🛞 Risk Management & Disclaimer
Please remember to always use proper risk management and position sizing. Nothing in this analysis is financial advice. The market can change quickly, so always trade based on your own strategy, research, and risk tolerance. You are fully responsible for your own trades.
#BCHBTC #1W (Binance) Big falling wedge breakoutCRYPTOCAP:BCH just regained 50MA weekly support in sats, performing better than CRYPTOCAP:BTC
Seems likely to continue bullish towards 200MA resistance, probably after a pull-back.
⚡️⚡️ #BCH/BTC ⚡️⚡️
Exchanges: Binance
Signal Type: Regular (Long)
Amount: 7.0%
Current Price:
0.004885
Entry Targets:
1) 0.004657
Take-Profit Targets:
1) 0.006329
Stop Targets:
1) 0.003987
Published By: @Zblaba
CRYPTOCAP:BCH BINANCE:BCHBTC #BitcoinCash #PoW bitcoincash.org
Risk/Reward= 1:2.5
Expected Profit= +35.9%
Possible Loss= -14.4%
Estimated Gaintime= 4-7 months

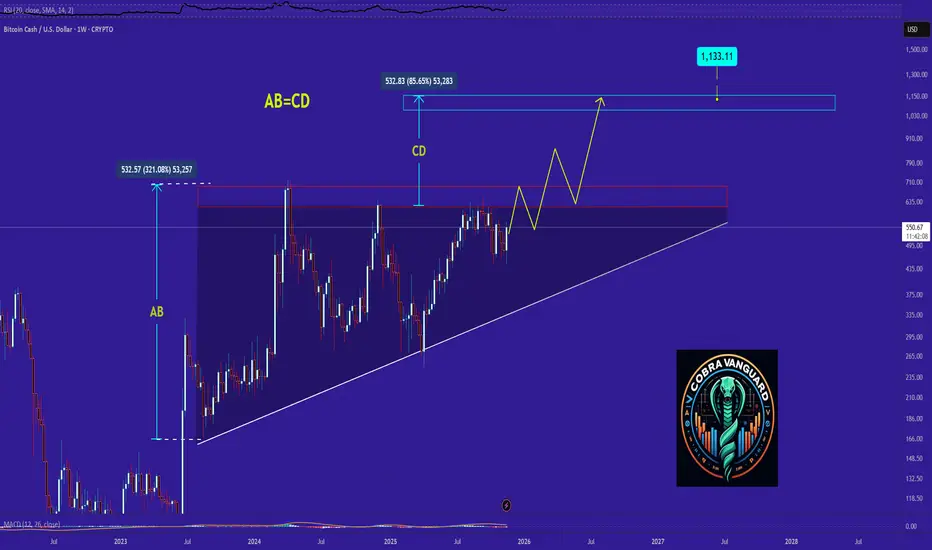
BCH - Time to buy again!BCH’s price on the 1-hour timeframe is forming an ascending triangle pattern.
If this pattern breaks to the upside, there’s hope that the AB leg will equal the CD leg, potentially pushing the price up to around $1100.
However, since crypto often disappoints expectations, it might let us down once again—so stay cautious.
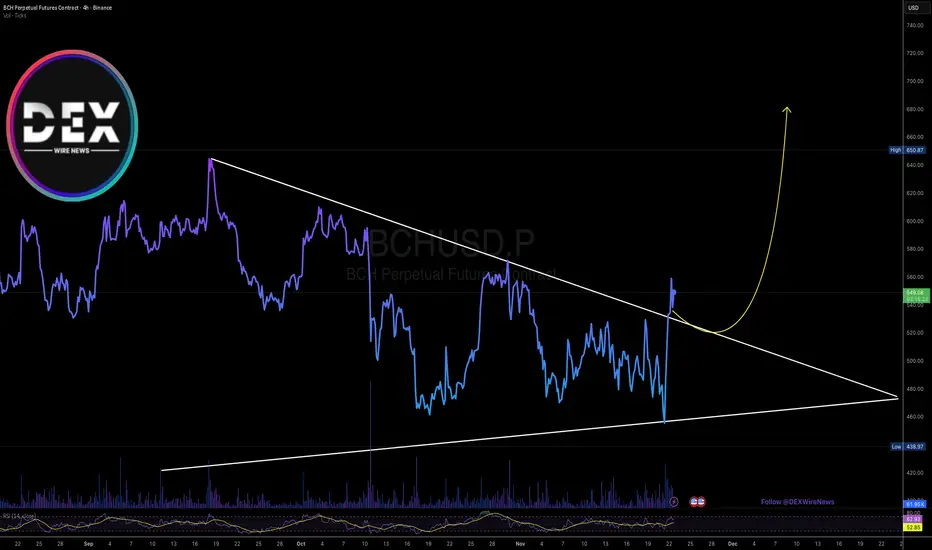
Bitcoin Cash ($BCH) is Up 12% Today, Albeit Market Dip The price of Bitcoin Cash ( CRYPTOCAP:BCH ) saw a notewhorthy uptick of 12% albeit market turmoil. the altcoin is oscillating within a tight symmetrical triangle pattern gearing for a bullish continuoution pattern.
As of the time of writing, CRYPTOCAP:BCH is up 2.58% gearing for a bullish spike. With the RSI at 62, CRYPTOCAP:BCH is more than able to make a mov to the $700 resistance point.
What Is Bitcoin Cash (BCH)?
Bitcoin Cash (BCH) is a peer-to-peer electronic cash system that aims to become sound global money with fast payments, micro fees, privacy and larger block size. As a permissionless, decentralized cryptocurrency, Bitcoin Cash requires no trusted third parties.
Bitcoin Cash Price Data
The Bitcoin Cash price today is $545.45 USD with a 24-hour trading volume of $1,049,904,696 USD. Bitcoin Cash is up 11.57% in the last 24 hours. The current CoinMarketCap ranking is #11, with a market cap of $10,885,408,966 USD. It has a circulating supply of 19,956,897 BCH coins and a max. supply of 21,000,000 BCH coins.
BCH needs to break monthly resistanceIn order to get the explosive move we saw with Zcash. BCH needs to break the yellow line on the monthly time frame. Everyone has been focused on breaking the red line which we did in July, but there hasn't been any substantial uptrend. This is because the red line is formed using wicks and the real resistance is the solid candle of the yellow line.

BCH Update🚨📊 BCH Update
BCH has also formed a new resistance zone in red 🔴.
This level is now acting as a strong ceiling,
and price must break out above this red resistance
to show any real bullish momentum again.
Until that breakout happens,
sellers remain in control and upside stays limited.

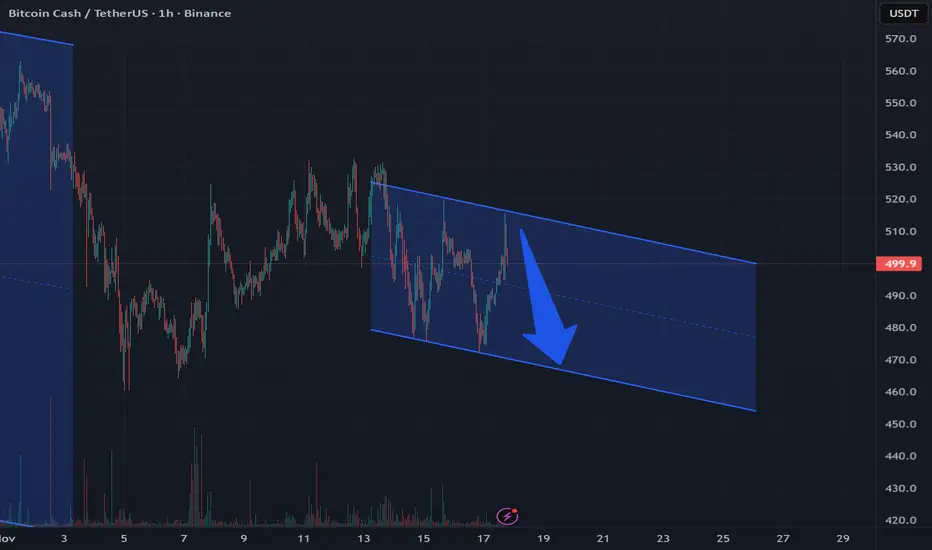
BCH movement inside a descending corridorBCH is forming a local descending corridor, within which the movement is most likely to continue
We clearly see a rebound from both the upper and lower boundaries. It is also noticeable that each subsequent peak is lower than the previous one, indicating movement within the pattern
Current price: $504
Approximate contact zone at the lower boundary
If the upper boundary is broken momentarily, the pattern will be temporarily broken
More detailed analysis, additional charts, and key levels to watch are available on our site