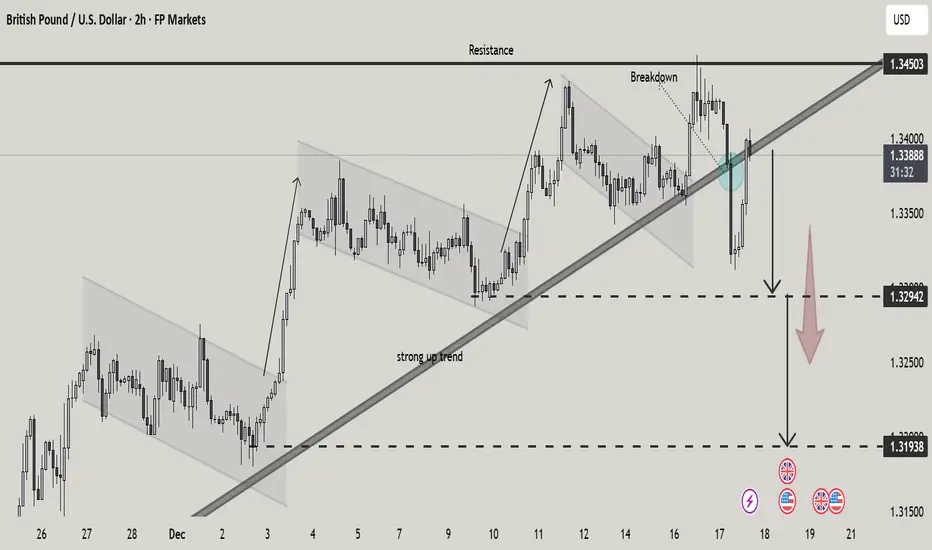
GBPUSD Trendline Breakdown Deeper Pullback from Key ResistanceThis 2-hour GBP/USD chart highlights a strong bullish structure built on a rising trendline, with price respecting higher lows throughout early December. Multiple ascending and corrective channels show controlled upside momentum.
Price recently tested a major resistance zone near 1.3450, failed to hold above it, and then broke down below the rising trendline, marked by the highlighted breakdown area. This loss of structure suggests a trend exhaustion / corrective phase rather than immediate continuation.
Key downside levels are clearly mapped:
1.3294 as the first support / breakdown confirmation level
1.3194 as a deeper downside target if bearish momentum accelerates
The chart effectively illustrates a transition from trend continuation to corrective risk, with sellers gaining short-term control after rejection at resistance.
Bearishcorrection
EURUSDEURUSD reversed from a daily broken structure and it's making lower highs and lower lows.
Price is moving within a 4hour bearish correction and it has the potential to continue moving lower.

AUDUSD - H1: KEY LEVELS & BEARISH CORRECTION
Price has been rejected at resistance key levels for couple of times now.
Breakout of Bearish Correction trend line will move price (much) lower.
Lets not forget that the pair is very bearish due to massive Head & Shoulder Pattern on weekly chart.

USDCHF SHORT POTENTIALPrice formed a rising wedge,broke out of ascending trendline and is currently retesting broken level.
Price is forming a bearish corrective structure and has potential to reverse and continue downward move.
Will be looking for short set ups on lower time frame.

Testing Support for Bulls on $BTC Daily ChartSupport at the 61.8% level from the latest low and high is being tested as support. Daily momentum is posting weak signals and likely not enough to push price through the golden ratio.
The ADX is still in a trend strength zone, and the directional index lines are flattening out. This looks lie a picture of a correction against a new near-term bullish move.
The RSI is holding support inside its bullish zone at the same time price is trying to hold the floor along the 61.8% level.
If this level holds as support I can see a 5-wave scenario to lift the price to the 61.8% Fibo level in the coming weeks.
Wave 2 can retrace all the way back to the beginning of wave 1 and still be legit. My sell stops would be a new low under $3215.20. For now the floor holds and higher prices ahead in the coming weeks.

Bullish divergence in Crude Oil (WTI) H4 opening for correction Bullish divergence in Crude Oil (WTI) H4 opening for correction
Bullish divergence in Crude Oil (WTI) H4 opening for correction back towards 35$ (round number),
34,80$ supportline and 34$ (0.38 Fib support).
This scenario might play out, if the ECB rate decision, today 13:45 CET, disappoints markets, e.g. postponing further ratecuts and
QE measures to the next meeting and thus drives the Euro up against the US$ (EURUSD), sending
markets down, which are hanging on the cliff already.
The timeframe might be slightly different from the visualised one.
So please take this as an inspiration to make your own analysis and work out your own trading plan.
Please leave a LIKE or a FOLLOW and thanks for your attention.
Twitter:
twitter.com
