Watch for these levels on BTC for a breakdown or a pump upWe hope you practiced some risk management for the last big BTC move, but here is your chance to protect yourselves again. It is safe to say the Bull Market run is over. The best we can hope for now is a few pumps to help us get out of some over-leveraged positions. None of this is financial advice and please understand that we are a neutral party. Not a Bull and Not a Bear, just calling the charts how we see them. If we get support over 45K on the 4 hour, look for a bit of a pump, but it is highly unlikely. If we stay in the lower channels with the RSI continuing bearish divergence, next price target in the 41K range and much further to go from there. We do expect some minor correction pumps up before continuing down, but the overall bearish dumps have begun. Please do your own research and do not make any investments you have not researched on your own. Happy Trading!!!
Bearmarketsignal

Is the Bear Market Upon Us?Hello Everyone,
Quick analysis for today. There has been a question in the air for the last 2-3 months. "Are we in a bear market?". Well there is not a simple yes or no answer for this and I would say it is a little too early to call. I am personally leaning more bearish as I am seeing rallies with bearish price action representing dead cat bounces. Not to mention the huge loss in momentum and exit pumps in random small cap alt coins by whales.
I have provided several pieces of analysis in the last few weeks but here is a more simple weekly chart.
As we can see, each time the market "tops" it is followed by a large relief rally that does not exceed the all time high. The biggest take away is the much lower volume or bearish price action as the price tries to climb back up. Each time this happened, the market saw the entry way into the bear market. Another note is the blue Moving Average which is the Hull Moving Average . This MA has been consistent in determining the start/end of the bull/bear market. Not to mention we are at a 20x from the March 2020 low.
I would also like to include a partial monthly analysis here. If you look at RSI, each bull market ended with RSI just above 90. The bear market followed. This bull market hit 90 right around the 60k area.
This does not mean there are not bullish swings in the bear market. There are 4-7 on average per year. I will be looking forward to trading these as well as DCAing in the bear market (if it is here to stay). I made some very good gains in this bull market. Things can change and we may still continue this bull cycle but at this point I think it's unlikely.
As always, be patient, use risk management, and good luck trading!

Update more detail added for BITCOINs next big reversal downSo just adding some additional price areas to my chart.I have also provided the RSI indicatorto show the major hidden bearish divergence, along with the regular bearish divergence. These are both yet to play out and paint a picture of a solid move-reversal down to the areas i have charted here, trade safe and have a plan. Love to hear anyones thoughts, cheers $urfbeach73

[Bitcoin] Last bulltrap before the fall ...Bullish trend up to $ 38,700 max, then reversal.
This publication is a trend hypothesis.

[Bitcoin] Last bulltrap before the fall !Bullish trend up to $ 38,700 max, then reversal.
This publication is a trend hypothesis.

[Bitcoin] The decline will continue ...Current bearish factors :
- a large bearish flag
- a strong MACD divergence
- a huge RSI divergence
- a steady increase in institutional short positions (COT report)
- a significant drop in volumes these last months
- a weekly bearish MACD cross
- a death cross in progress
- the great powers want to regulate the market
This publication is a trend hypothesis.

BTC in Bear MarketAs you see after massive news , fomo and Valuability for investments on lower price, Btc started to drop techinacally straight to the bear market, as you see at 1st resistance dropped , then failed to return (1), dropped further at next support failed to overpass previous support as new resistance (2) , same now dropped and atm failing to bullish up to 50k , that is the result of 200MA turning day by day to red, this week is crusial moment for coin to prove us if can returns at higher prices
if for 3rd time fail, so under the last red lines price will go to bear market (puprple polygone) i can predict that a valueable price of 10400$ or 11850$ with a tick down to 9k will be the start for massuve bullish back , turning to Green on 200MA overpass the White dot line with a projection at the end/or start of the year 105k$ , all the above are Valid IF and only this week BTC fail to overpass the 50k line

[Bitcoin] BTC will relapseBTC will strongly relapse this week.
Current bearish factors :
- a large bearish flag
- a strong MACD divergence
- a huge RSI divergence
- a steady increase in institutional short positions (COT report)
- a significant drop in volumes in recent months
- a weekly bearish MACD cross
- a death cross in progress
- the great powers want to regulate the market
This publication is a trend hypothesis.

[Bitcoin] Warning !In TF4H BTC has not succeeded in extricating itself from the compression triangle in which it has been evolving for several days, which validates the hypothesis of a bearish pennant.
The accumulation of bearish signals and fractal analysis reinforce my idea of a weak retracement before another large decline.
This publication is a trend hypothesis.

[Bitcoin] What's next ?The many bearish signals mentioned in my previous analyzes show that the market reversal has just started.
The study of "true fractals" (those discovered by Mandelbrot) shows that a second bearish wave will occur.
This publication is a trend hypothesis.
[Bitcoin] Last rebound before the bear market ?In daily and weekly, several signals show that a market reversal is underway (bear market), in particular the crossing of the moving averages and of course the huge drop on May 19.
In small timeframes, technical indicators show that a rebound will surely occur before the decline continues.
This publication is a trend hypothesis.

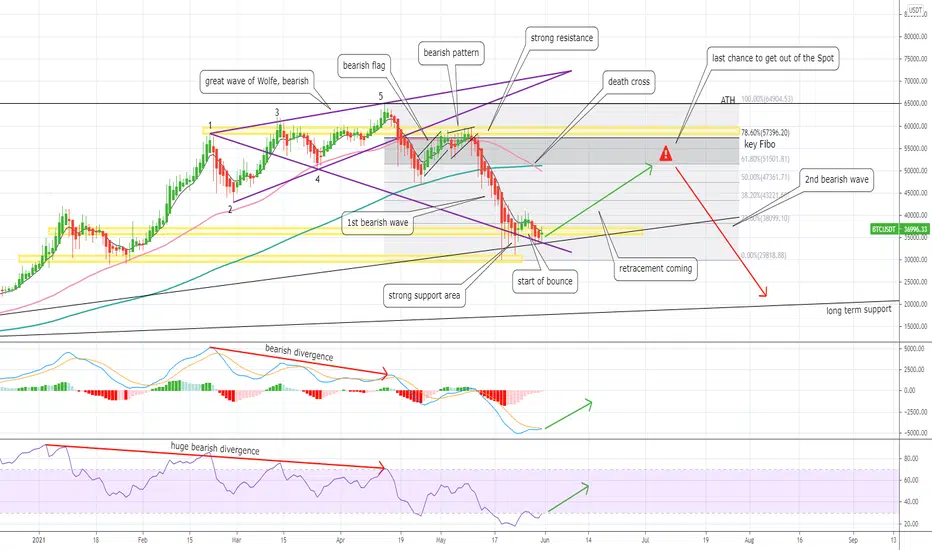
[Bitcoin] bear market signals (update2)Currently we still have long term bearish signals :
- a great wave of Wolfe
- a bearish MACD divergence
- a huge bearish RSI divergence
- a strong resistance area around $60K
- a regular increase in institutional short positions (COT report)
- a significant drop in volumes
- a MACD bearish cross in weekly
- a death cross coming
- regulations and taxes in preparation
From my point of view there is a real likelihood of a market reversal.
This publication is a trend hypothesis.

Bitcoin Bears Taken Over !!What I see on the daily chart is not good for Bitcoins price or current trend, TA WISE THE UPTREND IS OFFICIALLY BROKEN!
This is not advice, but my point of view on the current market.
Securing profits is an important factor you should do without any doubt.

[Bitcoin] bear market signals (update)Currently we have several bearish signals :
- a great wave of Wolfe , bearish
- a very clear bearish MACD divergence
- a strong resistance area around $60K
- a regular increase in institutional short positions (COT report)
- a significant drop in volumes
- a huge bearish RSI divergence in weekly
- a MACD bearish cross in weekly
- regulations and taxes are in preparation
If a strong decline starts in the next few days, from my point of view there will be a real likelihood of a market reversal.
This publication is a trend hypothesis.


[Bitcoin] bear market signals ?Currently we can observe several bearish signals on Bitcoin:
- a great wave of Wolfe, bearish
- a very clear bearish MACD divergence
- a strong resistance zone around $60K
- a regular increase in institutional short positions (COT report)
- a significant drop in volumes
- a huge bearish RSI divergence in weekly
- a weekly MACD bearish cross
If a sharp decline begins in the next few days, from my point of view there will be a likelihood of a market reversal.
This publication is a trend hypothesis.

Bullish Scenario for Blow-off Parabolic: Three Drives to TopPrevious tops characterized by parabolic surge with extreme overbought RSI (arrows). This is the Third Drive; expect another parabolic blowout, followed by an extreme Bearish reaction. This final move will complete a Nenstar pattern and likely usher in a Bear Market for 2021.
A measured move from 3230 -> 3630 of 400 pips, extended to upper TL formed by previous tops, yields price 4K.
This move could occur rapidly, over 7-10 trading sessions in December, as we saw in the two prior moves, look when RSI moved from high to extreme overbought, takes about a week.
NB: Time from 30 June ending ABC correction to next top: 64 days; from 30 October projects rally ending ~> 3 Jan
This is a rosy scenario priced for perfection. Printing free money will be the catalyst. Failure in Congress will result in rollover.
I do not advise going long here; risk is extreme! Rather, this idea suggests when shorts might come into play.
Shorting this trend is also extremely risky. Calling tops is worse than fishing for bottoms IMO!
ANYTHING can happen now; trade safe FGS!!!
As always, this is not advice, just another crackpot idea. Trade at your own risk; GLTA!

Top Is In? Ugly GDP Print and 10 Year Treasury Yields Break DownI've been waiting for today to arrive as the Q2 GDP print is in and was ugly as expected. The awful number reported (a -32.9% collapse) was expected but I'm looking for some "trigger" that might change the market mood and I've suspected the GDP number could be it. Seeing the worst GDP decline on record, even worse than during The Great Depression, might be a wake up call for the majority of people that never look at economic data, despite the fact it was "expected."
In support of that suspicion is the 2nd major event I was waiting for: a breakdown in treasury yields. The last few months 10 year treasury yields have NOT rallied with stocks creating this huge disconnect between a euphoric equity market and a glum bond market--and again this is something the average Joe doesn't watch. Today the yields on the 10 year treasury broke down from the support we've seen holding for months (shown on the chart in blue). It even broke below the spike down that happened on April 21. Yields are breaking lows, bond values are rallying, and this is exactly the opposite of what should happen if the stock market rally were on solid footing. Unless yields reverse and go back up, I'm calling this an early indicator that the stock euphoria has been wrong and the top could be in.

Netflix has come to a fork on the road.Netflix has come to what I like to call a fork on the road. If Netflix does not break over $363 and breaks over the top trend line on this chart we might see a reversal in price that can take it all the way down to $77 on a large (WXY) correction as shown on the chart above. It has finished the (X) wave up and it is currently one the (b) wave of the (abc) wave of the (Y) wave down. Let's see how this plays out.


WTIWTI Crude oil looks weak AF here not even making any sort of bounce to try and keep up with the dead cat happening in the rest of the markets. I have Bids on HAL placed at $1.22 I think
my bids get filled as not much keeping oil up around the $20 level. Another leg down in oil to the $10 level give or take will absolutely wreck the stock market. Trade safe fam.

KHCKraft/Heinz looks about ready to blow out of this massive falling wedge. Kinda has me thinking stock markets maybe done crashing because the wedge bottom line just lines up so perfectly. If KHC has in fact bottomed here it could be putting in a big move up probably 200% move up
