Micro Bitcoin Futures (MBT1!) – DSRTL‑ML Weak Dip at supportMicro Bitcoin Futures (MBT1!) – DSRTL‑ML Weak Dip at S4–D5 Support
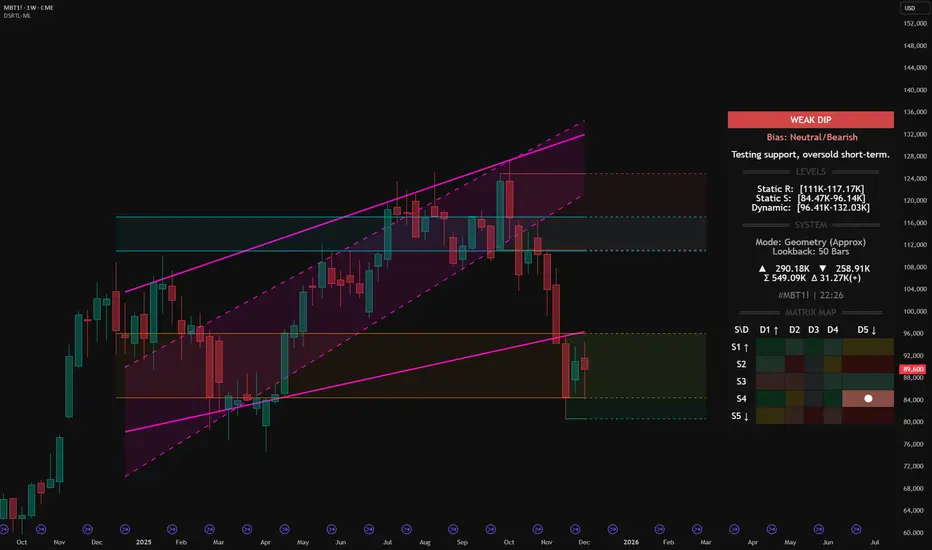
We are analyzing the weekly structure of Micro Bitcoin Futures (MBT1!) using the institutional DSRTL‑ML support/resistance engine. On this bar the indicator classifies the state as WEAK DIP with a Neutral/Bearish bias and the system message:
Testing support, oversold short-term.
This reading comes from the current matrix position S4–D5 on the Matrix Map and defines the context for the price action inside this support zone.
1. DSRTL Matrix Diagnosis – State S4–D5
S4 – Static Support in Control
Price is trading inside the DSRTL Static Support band:
Static S: 84.47K – 96.14K
In the logic of DSRTL‑ML, this green support zone marks a historical high‑volume demand node where passive buy liquidity has previously absorbed aggressive selling. It behaves as a structural floor rather than a neutral price area.
D5 – Overshoot Below the Dynamic Channel
At the same time, price is positioned below the 5‑Point Dynamic Channel:
Dynamic Band: 96.41K – 132.03K
State D5 describes a downside extension beneath the lower boundary of the dynamic channel. Within this framework, that move is read as an oversold displacement away from the equilibrium path of the trend geometry, not as a fully confirmed new downtrend on its own.
Combined Reading – WEAK DIP with Neutral/Bearish Bias
The overlap of:
price sitting inside Static Support S4, and
price being oversold relative to the Dynamic Channel (D5)
produces the WEAK DIP classification. The Neutral/Bearish bias tells us that the dominant leg into this area is still downward, but the current candle represents a weaker phase of that dip occurring directly into a pre‑defined demand floor.
2. Key DSRTL Levels on This Chart
From the Levels and System panels on the chart:
Static Resistance (Supply Block): 111K – 117.17K
Upper structural ceiling derived from the DSRTL matrix of historical volume and price interaction.
Static Support (Demand Block): 84.47K – 96.14K
The active S4 floor where the current weekly bar is developing.
Dynamic Channel (Trend Geometry): 96.41K – 132.03K
The 5‑Point trend channel that defines the dynamic path of price; its lower edge around 96.41K is the first mean‑reversion checkpoint above the market.
Volume Metrics on This Bar:
Buying volume (▲): 290.18K
Selling volume (▼): 258.91K
Total volume (Σ): 549.09K
Delta volume (Δ): +31.27K
The positive delta together with the WEAK DIP label supports the idea that, inside S4, aggressive selling is meeting responsive buying rather than progressing as a fresh impulsive breakdown.
3. My Structural View Based on DSRTL‑ML
From a structural perspective, I read this configuration as follows:
Context of the Trend
The Neutral/Bearish bias confirms that the larger move into this zone is still a downward leg. The market is not flagged by DSRTL‑ML as a confirmed bullish reversal; instead, we are in a weak phase of the decline, pressing into defined support while the geometry is stretched.
Support Floor and Invalidation
As long as weekly closes remain above roughly 84.5K – the lower boundary of the S4 block – I consider this area a working demand floor for the current sequence. A decisive weekly close below that level would invalidate the weak‑dip narrative and shift the focus to a more developed breakdown of support.
Primary Path While S4 Holds
If S4 continues to hold, my expectation is that the oversold S4–D5 state will tend to resolve through mean reversion back toward the lower edge of the Dynamic Channel around 96.41K. In DSRTL terms, that is the first structural magnet above price once an overshoot has occurred.
Next Reference Above the Channel
Should price manage to re‑enter and hold inside the Dynamic Channel, the next major reference becomes the Static Resistance block at 111K – 117.17K. In my view, that zone represents the upper boundary of the current weekly structure and the area where I would expect supply and volatility to increase again.
In short, DSRTL‑ML currently maps MBT1! as a weak dip into S4 support with a still‑bearish background trend. My directional view is that, while this support holds, the structure favors a corrective mean‑reversion phase toward the dynamic band rather than an immediate continuation breakdown, with any weekly close below the S4 floor acting as a clear structural invalidation.
Indicator used for this analysis: DSRTL‑ML (Dynamic Support & Resistance Trend Logic).
Disclaimer: This publication expresses my personal opinion on the MBT1! chart based solely on the DSRTL‑ML indicator and standard price/volume analysis. It is not financial or investment advice and does not constitute a recommendation to buy or sell any instrument.
Bestsignals
Nasdaq 100 (NQ): Hyper-Extended Momentum – Breakout or Exhaust
Category: Trend Analysis / Support & Resistance
Ticker: NQ1! (CME)
Analysis:
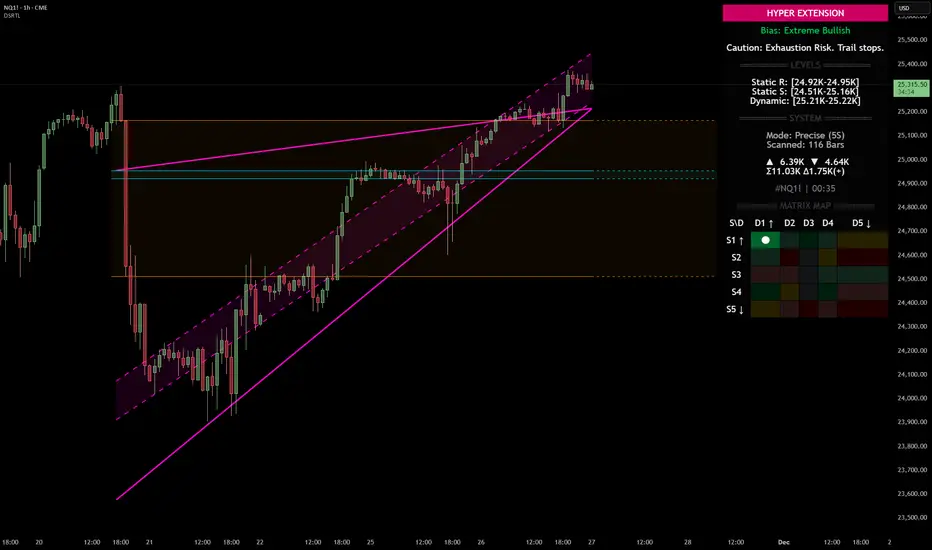
We are looking at the Nasdaq 100 Futures (NQ1!) on the 1H timeframe using the Dynamic Support & Resistance (DSRTL) system. The market is currently displaying a textbook example of a high-momentum breakout that has pushed into statistical extremes.
Here is the breakdown of the current technical landscape based on the indicator's Matrix Logic:
1. The "Hyper Extension" State (S1 / D1)
The indicator’s dashboard has triggered a "HYPER EXTENSION" alert. This specific state occurs when two conditions are met simultaneously:
• Static Breakout (S1): Price has cleared the horizontal resistance structures (indicated by the volume clusters).
• Dynamic Overextension (D1): Price has pierced above the upper limit of the dynamic trend channel (the purple trendlines).
2. Bias: Extreme Bullish
The current bias is rated as "Extreme Bullish". The trend is undeniably strong, confirmed by the positive Volume Delta (+965) shown on the dashboard. The price action is aggressive, creating a steep angle of ascent that has moved away from the mean.
3. The Warning Signal: Exhaustion Risk
While the trend is up, the system issues a cautionary note: "Exhaustion Risk. Trail stops."
In technical terms, when price action moves into "D1" (Dynamic Overextension), it indicates that the asset is trading significantly above its standard deviation or channel geometry. Historically, markets often seek mean reversion or consolidation after such rapid expansions to sustain the trend.
Key Levels to Watch:
• Dynamic Support (Immediate): The top of the purple channel (approx. 25,220) acts as the first layer of defense. A retest of this level is common after a breakout.
• Static Support (Structural): The breakdown level of the previous resistance, now turning into support around the 24.95K region.
Scenario Conclusion:
This is a pure momentum play. Traders should be aware that while the path of least resistance is up, the probability of a "snap-back" or consolidation increases the further price stretches above the dynamic channel. This is not a signal to short the trend immediately, but rather a signal to manage risk tightly on existing long positions.
Disclaimer: This analysis is for educational purposes only and explains the logic of the DSRTL technical indicator. It does not constitute financial advice.
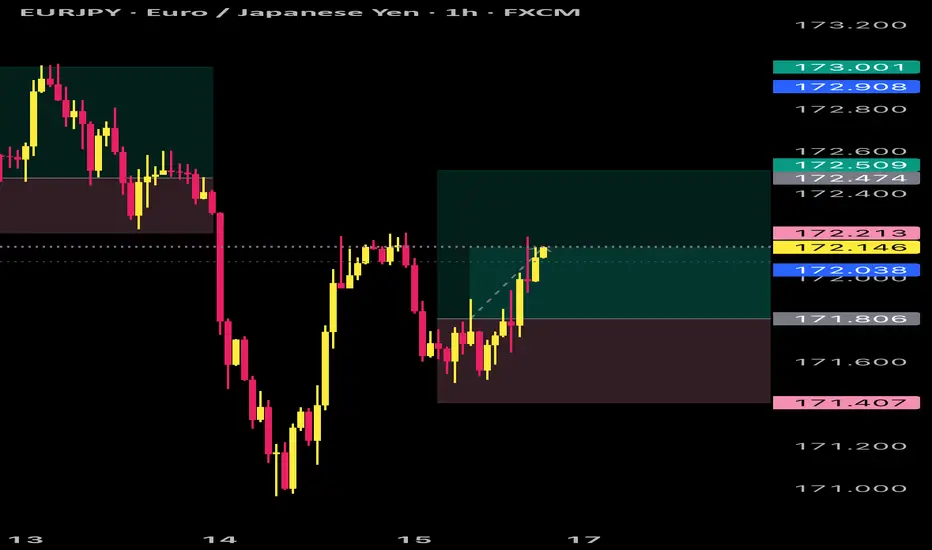
UP TRADE EURJPY Eurjpy looking to be buying so I will execute using a buy Limit to enter me into the trade and it will hit my take profit as it has already shown potential to reverse to the upside and continue its trend


GOLD TRADE Gold looking to be buying and respect the highs to be touched, since it’s part of it’s structure and play out

Volume-Based Market AnalysisUsing Indicators:
Smart Money Support/Resistance and ATAI Volume Analysis with Price Action V1.03
Analytical Configuration
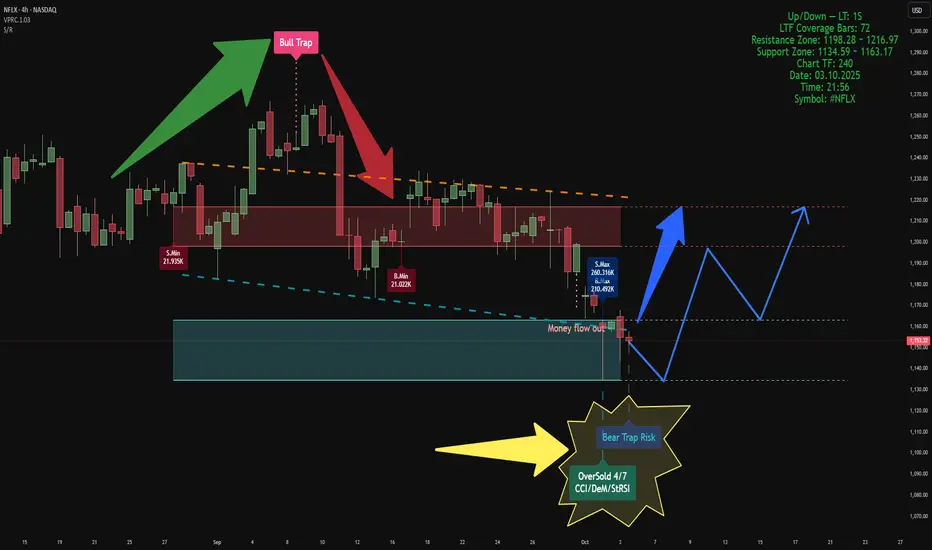
This analysis combines two advanced indicators. The calculation period for both has been set to 52 bars, based on a lower timeframe of 1 second (1S), which provides 72 valid LTF candles. This configuration ensures that volume-based calculations remain within the valid data window for maximum accuracy.
Current Market Context
On the latest candle, a Bear Trap Risk signal appeared right after detecting an OverSold condition. This combination usually suggests weakening selling pressure near the end of a bearish leg and indicates the potential for buyer reaction. At that candle, both buy and sell volumes reached their highest values within the 52-bar window, but sellers maintained a slight advantage — approximately 260K sell volume versus 210K buy volume. This dominance by sellers in the OverSold zone reinforces the concept of volume exhaustion
Key Zones
• Support Zone: 1134 – 1163 USD
• Resistance Zone: 1198 – 1217 USD
Price is currently oscillating between these two zones. Based on the data, a short-term move toward the lower edge of the support zone is possible. If strong support holds, a rebound toward the upper boundary of resistance can be expected to retest or potentially break above it.
Structural Observation
In previous data, ATAI identified a Bull Trap at the resistance zone, which initiated the current bearish leg. Now, the emergence of a Bear Trap Risk near the support boundary is an intriguing reversal signal. If this trap functions similarly to the previous Bull Trap but in the opposite direction, we could expect a movement from the support base toward the resistance ceiling in the upcoming phase.
Summary
According to both indicators’ volume-based calculations, this is the most probable short-term scenario. However, this analysis is purely technical and volume-driven, and does not constitute any form of financial or investment advice.
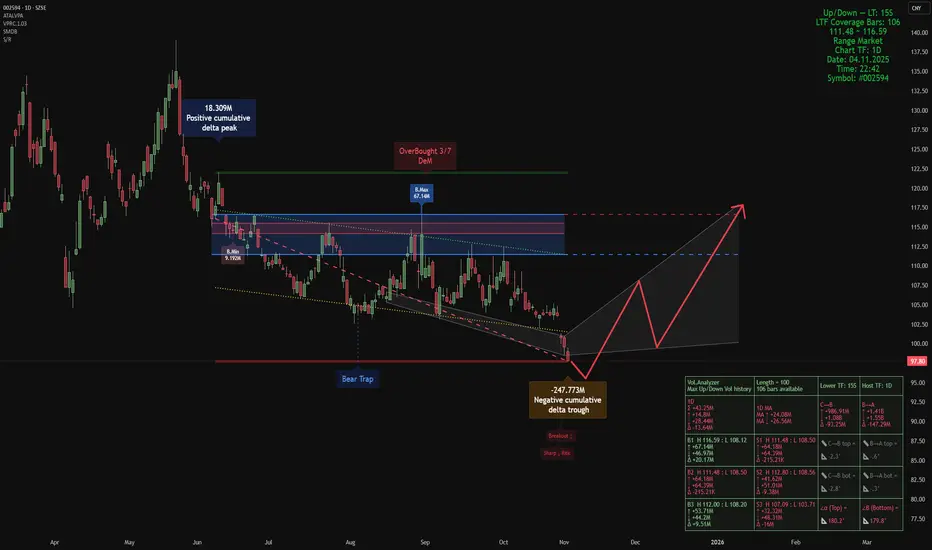
Smart Money Composite View — BYD Company Limited Class ASmart Money Composite View — #002594 (1D), BYD Company Limited Class A
Indicators used:
• Smart Money Support/Resistance
• Smart Money Dynamics Blocks (Pearson Matrix)
• ATAI •Volume Pressure Analyzer v1.2 — Pure Up/Down (Editorial Pick)
We fuse these three into a single composite read. With offset = 48, the setup highlights where price sits relative to smart-money demand/supply, how liquidity is being absorbed, and where momentum can re-emerge.
Market read (composite)
• Price is trading below the 112–118 supply block, which currently acts as the dominant resistance. The failed attempts into this band and the overhead “OverBought” tag mark it as the active sell wall.
• The current swing printed a large negative cumulative delta trough (~-247.8M) right at the lower reaction zone (bear-trap baseline + descending structure). That’s classic absorption of aggressive selling rather than fresh distribution.
• Wing geometry is near-flat (α≈180° / β≈179.8°), signalling compression: momentum has bled off while liquidity rotates. This is typically the pause before a directional decision.
• The grey path on the chart sketches the logical reaction sequence: a relief leg first into the mid-band (~108), where supply should be re-tested, and—only if absorption continues—an extension toward 112–118. Until price reclaims and holds above ~108, the structure remains a redistribution risk under that supply.
Invalidation: A decisive close below the recent trough low (the bear-trap baseline on the chart) would negate the recovery sequence and opens lower prices.
This analysis is a personal market view and is not investment advice.
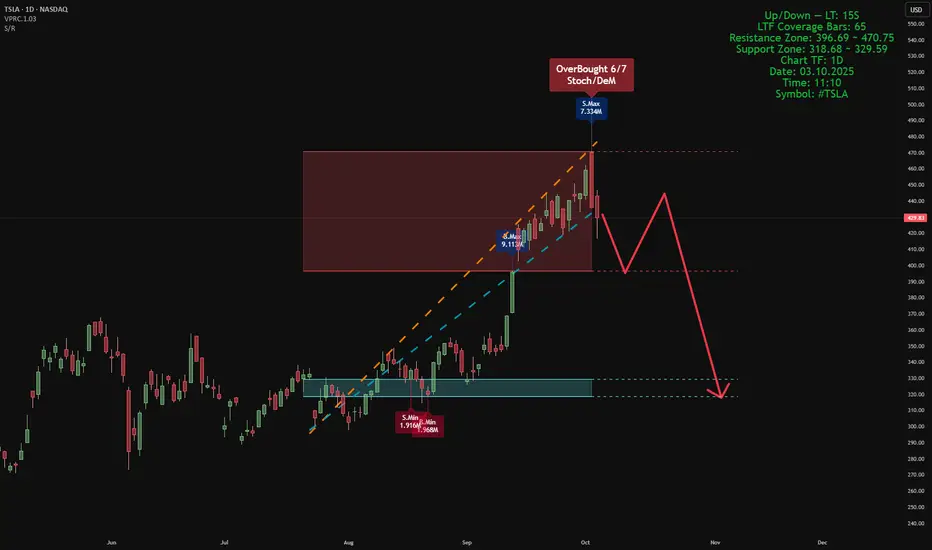
Smart Money Support/Resistance + ATAI Volume Analysis —PracticalApplication
When these two indicators work together — Smart Money Support/Resistance (Lite) and ATAI Volume Analysis with Price Action — the chart begins to speak a clearer language: one defines where the reaction zones form, and the other explains what happens inside them. The purpose is not prediction but understanding the balance between smart money pressure and retail momentum.
1. Parameter Alignment
On the right side of the chart, the green info panel confirms that both indicators share identical configurations. In this example, the lookback period is set to 52, chosen deliberately because it must be smaller than the total number of LTF coverage bars (65). For the Smart Money Support/Resistance indicator, the projection is set to 26 — extending the detected zones forward without adding excessive visual noise. This alignment is crucial; mismatched parameters can desynchronize volume readings and structural boundaries.
2. Reading the Chart
In this sample chart, the upper red area represents a Smart Money resistance zone — a region of concentrated selling pressure detected from lower timeframe volume. Simultaneously, ATAI Volume Analysis signals an Overbought (6/7) condition, meaning multiple oscillators confirm exhaustion while seller volume (S.Max) begins to outweigh buyer volume (B.Min). This overlap suggests that liquidity has shifted and the prior bullish impulse is weakening. From here, price may consolidate within the zone or initiate a structured retracement toward the blue support area, previously defined by accumulation volume. The red projected path simply visualizes one potential structural scenario; it is not a prediction or trade signal.
3. Broader Context
This example serves only as a demonstration of how these two tools interact when properly tuned. Different assets and timeframes naturally yield unique structures and behaviors, yet the principle remains consistent: define the territory first with Smart Money Support/Resistance, then interpret market behavior within it using ATAI Volume Analysis.
This content is for educational purposes only — not financial advice. User feedback and practical observations play a key role in refining future versions of both indicators.
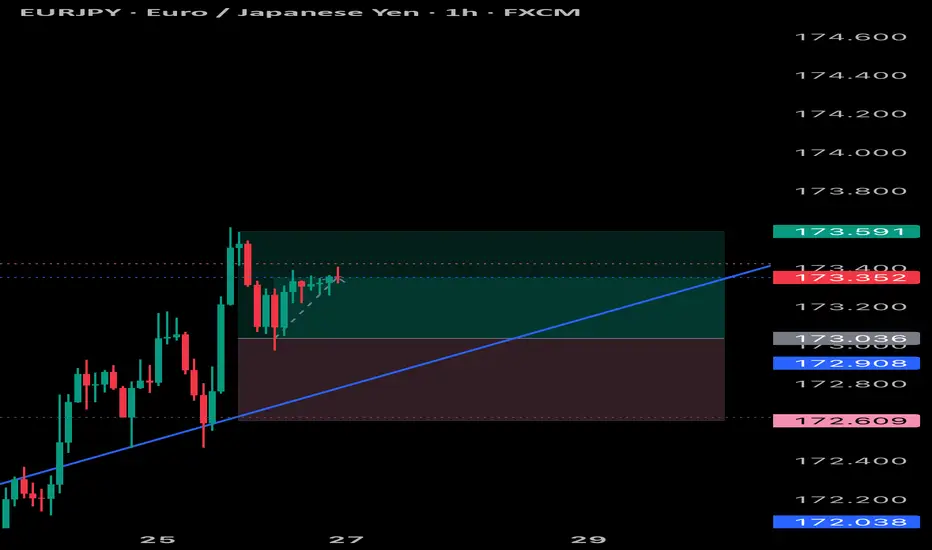
PROFIT ON EURJPYEurjpy I’m a beautiful up trend now can be the best time to take partials of profit and move ( adjust ) SL to BE, if looking to swing
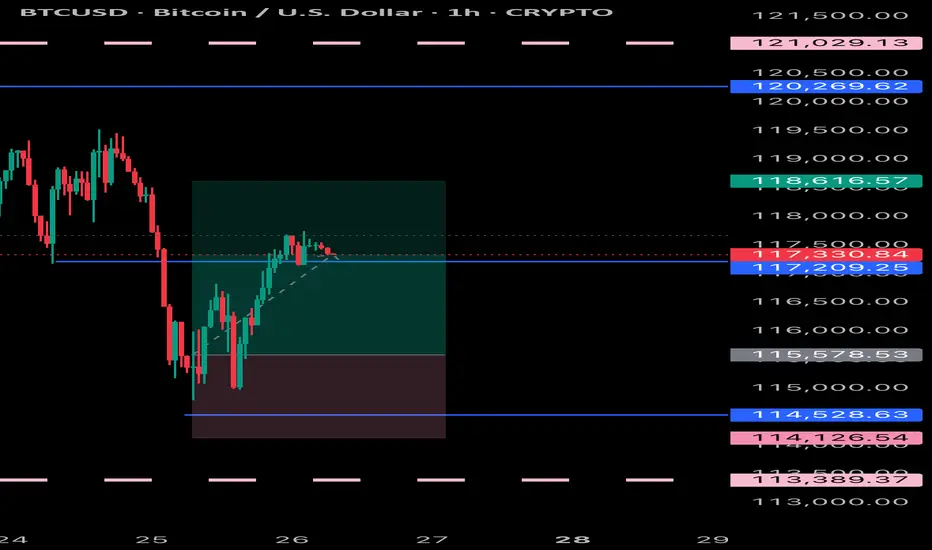
BITCOIN PROFITABLE Bitcoin performance has been very great and done what was expected with minim to no pullback, will keep looking for more great opportunities to scalp and turn into a swing trade

BTCUSD BULLS BITCOIN Bitcoin is holding structure so far , how’s will partial close and let the rest run

EURJPY PROFIT Eurjpy performed well and has mashed all take profits and unlocked a new price level will be looking to hold a bit more longer


BTCUSD UPDATE Bitcoin has gone up and now I will close partial profits and secure what I have or even swing again to the up side

GOLD BUY Gold will be buying soon and keep respecting it’s patterns so , I will keep the trading simple and straightforward


SUPER BUY GOLD XAUUSD Gold has ripped all levels of take profit and has gone up and gave us a small amount of drawdown with huge gains in return, simple trading price action and (M&Ws)

BITCOIN RESULTS Bitcoin has respected the analysis and held very well it’s been following the trend and can partial close some positions and wait for a nice pullback to buy the dip
EURJPY LOOKING GOOD Eurjpy has been behaving as expected and can continue to the up side and complete its pattern
Jindal stainless ltdJindal Stainless Ltd has been forming higher lows and has now broken through the key resistance level at 660. With this congestion breakout, the stock signals a continued bullish move, potentially heading towards the target of 740.
Please conduct your own technical analysis and apply proper risk management before taking any trade. This is solely my personal view.
#jsl #bestbreakout #uptrend #longteam

ALERT: ALT SEASON INCOMING? 🚨 ALERT: ALT SEASON INCOMING? 🚨
Take a close look at the BTC/ETH chart — we’re seeing early signs of a major rotation out of Bitcoin and into Ethereum and altcoins. Historically, when the BTC/ETH ratio starts to fall, it's a clear signal that capital is flowing into altcoins, marking the beginning of alt season.
🔍 The ratio is showing bearish divergence and approaching a key support zone. If this level breaks, ETH is likely to outperform BTC significantly — and we all know what follows: altcoins explode.
📉 BTC dominance is stalling, ETH gaining strength, and altcoins are waking up. The market is shifting. Don't get caught late.
🚀 Get ready. The alt season might just be starting now.
#AltSeason #Crypto #BTC #ETH #TradingView #CryptoTrends

For Educational purpose only.The primary objective of the trading strategy is to generate consistent returns while managing risk effectively. Define whether you are trading for short-term profits, long-term growth, or a combination of both.

NFP LIQUIDITY GRAB COMING Key Price Levels:
Level Price Importance
PWH (Previous Weekly High) 2,960.000 Strong resistance
PDH (Previous Day High) 2,930.000 Key liquidity level
Equilibrium 2,910.000 Fair value region
PDL (Previous Day Low) 2,890.000 Possible buy-side liquidity
PWL (Previous Weekly Low) 2,840.000 Strong demand zone
Discount Zone 2,850 - 2,830 High-probability buy area
3. Trading Plan:
🔵 Long (Buy) Plan:
Entry Criteria: Wait for a reaction at PDL (2,890.000) or discount zone (2,850 - 2,830). If a bullish BOS or ChOCH forms, enter long.
Confirmations: Bullish engulfing, strong rejection wick, demand zone reaction.
Target (TP1): Equilibrium at 2,910.000
Target (TP2): PDH at 2,930.000
Stop Loss: Below PWL (2,840.000)
Risk-to-Reward: Minimum 1:3
🔴 Short (Sell) Plan:
Entry Criteria: If price reaches PDH (2,930.000) or PWH (2,960.000) and forms a bearish rejection (e.g., double top, BOS).
Confirmations: Bearish engulfing, BOS, liquidity grab.
Target (TP1): Equilibrium at 2,910.000
Target (TP2): PDL at 2,890.000
Stop Loss: Above PWH (2,960.000)
Risk-to-Reward: Minimum 1:3
4. Neutral Zone (No Trade)
If price remains between 2,910.000 - 2,930.000 without a clear BOS or liquidity grab, it’s a consolidation zone. Avoid trading in chop.
