ElDoradoFx PREMIUM – GOLD ANALYSIS (31/10/2025, LONDON SESSION)1️⃣ Market Overview
Gold enters the London session consolidating near 4,008–4,010, after defending support at 3,985 and rejecting from 4,046. The market remains in a short-term bullish channel, but momentum is slowing as buyers struggle to reclaim the intraday high.
Currently, price sits above key EMAs (50 & 200) but faces overhead resistance between 4,034–4,046, which coincides with yesterday’s rejection zone. Today’s London open is expected to bring higher volatility and potential direction for the next leg — either continuation toward 4,060+ or a pullback toward 3,985.
⸻
2️⃣ Technical Breakdown
🔸 Daily (D1):
Price is holding steady above the 100EMA, printing a second consecutive candle above 4,000. RSI ~51 confirms a balanced market, while MACD histogram shows flattening red bars — signaling possible transition toward bullish momentum.
🔸 H1:
The structure shows higher lows from 3,915 and a rejection at 4,046, forming a small range. Price remains supported at the 50EMA (around 4,000) and ascending trendline. RSI 54; momentum moderate but favoring bulls as long as 3,985 holds.
🔸 15M–5M:
Gold trades in a tight wedge pattern with clear BOS and CHoCH confirmations. RSI oscillating between 55–60; MACD crossing positive, suggesting renewed buying pressure. However, the 4,034–4,046 zone remains a short-term barrier until a clean breakout occurs.
⸻
3️⃣ Fibonacci Analysis (Last Swing: 3,985 → 4,046)
• 38.2% = 4,022
• 50.0% = 4,015
• 61.8% = 4,008
🎯 Golden Zone for Re-entry: 4,022 – 4,008
⸻
4️⃣ High-Probability Trade Scenarios
📈 BUY SCENARIO (Main Bias)
✅ Entry Zone: 4,022 – 4,008 (Golden Zone)
🎯 Targets: 4,034 → 4,046 → 4,060 → 4,082
🛑 Stop Loss: Below 3,995
⚡ Confirmation: Bullish engulfing or CHoCH confirmation from 5M/15M near the Golden Zone.
💥 Breakout BUY Setup
• Trigger: Clean breakout & close above 4,046
• Retest Entry: 4,040–4,043
🎯 Targets: 4,060 → 4,082 → 4,100
🛑 Stop Loss: Below 4,030
⸻
📉 SELL SCENARIO (Countertrend)
⚠️ Entry Zone: 4,046 – 4,060 (Resistance & previous swing high)
🎯 Targets: 4,022 → 4,008 → 3,985 → 3,965
🛑 Stop Loss: Above 4,070
⚡ Confirmation: 15M bearish rejection candle or RSI divergence above 65.
📉 Break & Retest SELL
• Trigger: Break below 3,985 → Retest rejection at 3,995
🎯 Targets: 3,965 → 3,945 → 3,920
🛑 Stop Loss: Above 4,005
⸻
5️⃣ Fundamental Watch
• London expected to bring stronger liquidity after quiet Asia session.
• DXY near 106.20 — any recovery could limit gold’s upside.
• US Core PCE data later today may influence dollar strength ahead of NY session.
• Market remains risk-sensitive due to month-end positioning.
⸻
6️⃣ Key Technical Levels
Resistance: 4,034 / 4,046 / 4,060 / 4,082
Support: 4,022 / 4,008 / 3,995 / 3,985 / 3,965
Golden Zone: 4,022 – 4,008
Break Buy Trigger: > 4,046
Break Sell Trigger: < 3,985
⸻
7️⃣ Analyst Summary
Gold remains bullish-to-neutral above 3,995, forming a tight intraday range before a breakout.
If 4,046 breaks with volume, expect continuation to 4,060–4,082.
However, failure to clear 4,046 may invite short-term retracement toward 4,022–4,008 (Golden Zone) for re-entry.
The trend remains bullish while above 3,985, with downside risk only below that level.
⸻
8️⃣ Final Bias Summary
Bias: 🔼 Bullish (while above 3,985)**
Short-term Objective: Buy pullbacks toward 4,022–4,008
Invalidation: Below 3,985 → turns short-term bearish.
⸻
Beyond Technical Analysis

BTCUSD - 4HR Daily Algo Plots threadToday is Oct 31st
Algo Direction - SHORT
Current Price - 109,495
Entry - 111,500
TP3 Exit - 100,100
STOP - 115,300
Goal is to comment, daily on this on the 4HR to simply track the data predictions'
Also I have no idea what I am talking about.

LYXUSD - Ranges via LYXE prices...also Bullish Divergance???
Green is Support and resistance zones based on the LYXE chart in the ICO era. These could be the final flush out ranges to the ICO prices, before we take off.....IF we get an alt season.
If it hit .25-.30 I will make a decent buy
Bullish Divergence formed but then there is usually a flush out Let the RSI drop more so watch the ranges.... If ALTs get really bad we could see a drop below the ICO price... or because of the Bullish Divergence it could just pump from here.. I have no idea but like...maybe this could happen

Follow Up on Projected 400Pips on EURUSDPrice is running smoothly to the Bearish side as expected from our Earlier Projection. Now, here is a potential scenario to expect.
The Market being in an established Bearish state from the Intra weekly chart, it only makes sense to follow up on the Running trend.
Looking at the Intra day on 4Htf, we should expect another pullback to the 1.1600-1.1615 zone where we can prepare to add more positions from to aim for 1.1490 for a comfortable 1:4.5 Risk2Reward with StopLoss around 1.1630 and subsequently anticipate for the Last Target zones at 1.1470- 1.1395
Trade safe, Risk Responsibly
Patience is the Way! Ieios

The Concept of Competitive DevaluationIntroduction
In the complex world of international trade and global finance, currency valuation plays a central role in determining the economic health of nations. A country’s currency value not only affects its imports and exports but also influences investment flows, inflation, and overall competitiveness in the global market. Among the many policies that governments use to influence exchange rates, one particularly controversial and strategic move is competitive devaluation—sometimes referred to as a “currency war.”
Competitive devaluation occurs when countries deliberately lower the value of their own currencies in order to gain a trade advantage over others. The main goal is simple: to make exports cheaper and imports more expensive, thereby boosting domestic production and improving the trade balance. While the concept seems straightforward, its implications are far-reaching, affecting everything from global trade relationships to inflation and geopolitical stability.
Understanding Devaluation
Before delving into competitive devaluation, it is crucial to understand what “devaluation” itself means.
Devaluation refers to a deliberate downward adjustment in the value of a country’s currency relative to other currencies. This policy is typically implemented by nations with a fixed or pegged exchange rate system, where the value of the currency is tied to another currency, such as the U.S. dollar or the euro.
For instance, if India were to officially lower the rupee’s exchange rate from ₹80 per U.S. dollar to ₹90 per U.S. dollar, it would mean the rupee has been devalued. This makes Indian exports cheaper for foreign buyers but makes imports costlier for domestic consumers.
Devaluation is generally used to:
Boost exports by making goods cheaper abroad.
Reduce imports by making foreign goods more expensive.
Correct trade imbalances or current account deficits.
Support domestic industries and employment.
However, when multiple countries start engaging in devaluation simultaneously to outcompete one another, the practice turns into competitive devaluation—a self-reinforcing cycle that can destabilize global trade.
Defining Competitive Devaluation
Competitive devaluation is a situation where several countries intentionally devalue their currencies to gain an upper hand in international trade. It’s often described as a “race to the bottom” because every country tries to make its currency weaker to outcompete others.
The basic logic is that if one country devalues its currency, its exports become cheaper on global markets. Other countries, fearing a loss of export competitiveness, may respond by devaluing their own currencies. This leads to a chain reaction of devaluations that can distort trade relationships and create volatility in financial markets.
In essence, competitive devaluation reflects an international tug-of-war where each country attempts to export more and import less by manipulating exchange rates—often at the expense of its trading partners.
Historical Background
The concept of competitive devaluation isn’t new; it has appeared in different forms throughout economic history.
1. The Great Depression (1930s)
During the Great Depression, countries abandoned the gold standard and devalued their currencies to stimulate exports. Britain devalued the pound in 1931, followed by the U.S. in 1933, and many others soon after. This wave of devaluations led to what economists termed “beggar-thy-neighbor” policies—where one nation’s gain in trade came at the expense of others, worsening global economic instability.
2. Post–World War II Period
Under the Bretton Woods System (1944–1971), exchange rates were fixed to the U.S. dollar, and the dollar was pegged to gold. Devaluations were rare but highly significant. For example, Britain devalued the pound by 14% in 1967, and France followed with smaller adjustments. However, competitive devaluation pressures contributed to the eventual collapse of the Bretton Woods system in 1971, when the U.S. dollar was floated.
3. The Modern Era (2008–Present)
The global financial crisis of 2008 revived fears of competitive devaluation. With interest rates at historic lows, countries including the U.S., Japan, and China were accused of manipulating currencies to support exports. This period saw the rise of the term “currency wars,” famously coined by Brazilian Finance Minister Guido Mantega in 2010.
The rise of quantitative easing (QE)—massive money-printing programs by central banks—indirectly weakened currencies, leading to a new form of competitive devaluation, even if not officially declared.
Mechanics of Competitive Devaluation
Competitive devaluation typically occurs through monetary policy tools rather than explicit announcements. The following mechanisms are commonly used:
Interest Rate Cuts:
Lowering interest rates reduces the returns on assets denominated in that currency, making it less attractive to investors. This causes capital outflows and weakens the currency.
Foreign Exchange Intervention:
Central banks may directly buy foreign currencies and sell domestic currency in the forex market to push down its value.
Quantitative Easing (QE):
By injecting liquidity into the economy through large-scale bond purchases, a central bank increases the money supply, which tends to lower the currency’s value.
Capital Controls:
Restricting capital inflows and outflows can manipulate currency movement indirectly.
Official Declarations or Peg Adjustments:
In fixed exchange rate regimes, governments can officially devalue their currency peg to make exports cheaper.
Motives Behind Competitive Devaluation
Countries engage in competitive devaluation primarily to achieve short-term economic goals. Key motives include:
Boosting Exports: A weaker currency makes domestic goods cheaper in global markets, leading to higher export demand.
Reducing Trade Deficits: Costlier imports help reduce trade imbalances.
Stimulating Economic Growth: Export-led growth can boost production and employment.
Combating Deflation: Devaluation can help raise domestic prices by making imports costlier.
Debt Relief: For countries with large foreign debt, devaluation can reduce the real burden when the debt is denominated in local currency.
However, while these benefits may appear attractive, the strategy comes with severe side effects, especially when used by multiple countries simultaneously.
Consequences of Competitive Devaluation
1. Short-Term Gains
In the initial phase, devaluation can indeed stimulate exports and improve a country’s trade balance. Domestic producers gain an advantage, and employment may rise in export-oriented industries. However, these gains are often temporary.
2. Imported Inflation
A weaker currency makes imports more expensive. This leads to higher costs for fuel, machinery, and raw materials—especially in countries dependent on imports—resulting in inflationary pressures.
3. Loss of Purchasing Power
Consumers face higher prices for imported goods, reducing their real income and purchasing power.
4. Retaliation and Trade Wars
When one country devalues, others retaliate to maintain competitiveness. This spiral can trigger global currency instability and even trade wars, where nations impose tariffs or barriers.
5. Financial Market Volatility
Rapid currency movements create uncertainty in capital markets. Investors may pull out funds, leading to exchange rate fluctuations and financial instability.
6. Diminished Global Confidence
Persistent devaluations erode investor confidence in a country’s economic management, leading to capital flight and loss of foreign investment.
7. Long-Term Inefficiency
Instead of improving productivity and innovation, countries may become reliant on devaluation as a shortcut to competitiveness. This undermines long-term structural growth.
Competitive Devaluation vs. Currency Manipulation
Although the two concepts overlap, they differ in intent and execution.
Competitive Devaluation is often part of a broader monetary policy aimed at economic recovery or export promotion.
Currency Manipulation, on the other hand, involves deliberate and sustained actions by a country to artificially maintain an undervalued currency for unfair trade advantage, often drawing international criticism (e.g., the U.S.–China trade tensions).
Real-World Examples
1. China (2000s–2010s)
China was often accused by the U.S. and other nations of keeping the yuan undervalued to boost exports and maintain high trade surpluses. The strategy helped China become a global manufacturing powerhouse, though it also led to significant trade frictions.
2. Japan (Abenomics Era)
Under Prime Minister Shinzo Abe (2012 onward), Japan’s policy of aggressive monetary easing weakened the yen, helping Japanese exporters but drawing criticism from trading partners who saw it as competitive devaluation.
3. Eurozone (Post-2015 QE)
The European Central Bank’s quantitative easing program weakened the euro, benefiting exporters in Germany, France, and Italy, while raising concerns in the U.S. and emerging markets.
4. United States (Post-2008)
Though not a traditional devaluation, the U.S. Federal Reserve’s low-interest-rate and QE policies weakened the dollar, indirectly boosting exports and prompting other countries to follow suit.
Global Implications
The ripple effects of competitive devaluation go far beyond national borders:
Distorted Trade Balances: Export gains in one country often mean export losses in another, leading to global imbalances.
Increased Global Inflation: Weak currencies make global commodities like oil and metals more expensive.
Tensions Among Trading Partners: Countries may accuse one another of unfair practices, straining diplomatic relations.
Unstable Capital Flows: Investors shift funds rapidly in response to currency movements, destabilizing emerging markets.
Reduced Global Growth: If all countries devalue simultaneously, the net benefit vanishes—resulting instead in uncertainty and slower trade growth.
Policy Alternatives to Devaluation
Instead of engaging in competitive devaluation, countries can pursue more sustainable policies such as:
Improving Productivity and Innovation: Enhancing competitiveness through technology and efficiency rather than currency weakness.
Fiscal Reforms: Managing government spending and taxation to stabilize the economy.
Diversifying Exports: Reducing dependence on a few export sectors or trading partners.
Enhancing Domestic Demand: Building a stronger internal market to offset external vulnerabilities.
Coordinated Monetary Policies: Through organizations like the IMF or G20, countries can align exchange rate strategies to avoid destructive currency wars.
Conclusion
Competitive devaluation is a double-edged sword. While it may offer short-term relief to struggling economies by stimulating exports and reducing trade deficits, it ultimately creates more problems than it solves when used excessively or simultaneously by multiple nations.
The strategy can lead to global instability, inflation, and erosion of investor confidence—undermining the very competitiveness it seeks to enhance. The real solution lies not in weakening currencies but in strengthening economic fundamentals: productivity, innovation, diversification, and fair trade practices.
In a world where economies are deeply interconnected, competitive devaluation is less a path to prosperity and more a reminder that sustainable growth depends on cooperation, not competition, in currency markets.
The Pillars of Global Trade Dynamics1. The Economic Foundation: Supply, Demand, and Comparative Advantage
At the heart of global trade lies the principle of comparative advantage, introduced by David Ricardo in the early 19th century. This concept explains why nations trade — even when one nation can produce everything more efficiently than another. Instead of self-sufficiency, countries specialize in producing goods where they have a lower opportunity cost, leading to mutual benefit through exchange.
For example, if India focuses on software services and textiles while importing advanced machinery from Germany, both countries benefit from efficiency and specialization. This principle underpins global trade structures and ensures that resources — from labor to capital — are utilized optimally.
Global supply and demand dynamics also play a critical role. When consumer preferences shift or production costs change, global trade adjusts rapidly. The pandemic, for instance, disrupted both supply chains and demand patterns, forcing the world to reconsider its dependence on certain countries and industries. Similarly, rising middle-class consumption in Asia has altered global demand, turning countries like India, China, and Indonesia into consumption powerhouses.
Economic interdependence has deepened as well. A smartphone assembled in China, using components from South Korea, software from the United States, and raw materials from Africa, showcases how global production networks interlink economies. This interdependence creates efficiencies but also vulnerabilities, as seen during trade disruptions, geopolitical tensions, or shipping crises.
2. Policy and Governance: The Regulatory Pillars of Trade
Trade doesn’t occur in a vacuum; it is guided and regulated by policies, agreements, and global institutions. The World Trade Organization (WTO), International Monetary Fund (IMF), and World Bank form the triad of international governance that promotes free and fair trade.
These institutions were established after World War II to prevent the economic nationalism that contributed to the Great Depression and global conflict. The WTO, for instance, provides a platform to settle disputes and negotiate trade liberalization, ensuring countries abide by agreed-upon rules.
However, in the 21st century, trade policy has become a strategic weapon. Tariffs, sanctions, and subsidies are now tools of economic diplomacy. Trade wars, such as the U.S.–China conflict, illustrate how policy decisions ripple across the global economy — raising costs, shifting supply chains, and altering investment flows.
Moreover, regional trade agreements (RTAs) such as the European Union (EU), North American Free Trade Agreement (now USMCA), and the Regional Comprehensive Economic Partnership (RCEP) have reshaped trade patterns. These blocs promote intra-regional cooperation and reduce barriers, allowing countries to integrate economically and enhance competitiveness.
In contrast, protectionist policies — often driven by domestic political pressures — can distort markets and fragment global trade. The balance between globalization and protectionism remains one of the defining policy challenges of our era.
3. Technological Advancement: The Catalyst of Modern Trade
Technology has revolutionized every facet of global trade — from production and logistics to finance and communication. The digital revolution, automation, and artificial intelligence (AI) have made trade faster, more efficient, and more data-driven.
In logistics, innovations like real-time tracking, blockchain-based shipping records, and automated ports have streamlined global supply chains. The containerization revolution in the mid-20th century was one of the earliest technological breakthroughs that drastically cut transport costs and boosted trade volumes.
In manufacturing, technologies such as robotics, 3D printing, and Internet of Things (IoT) are reshaping the global distribution of production. Countries with advanced infrastructure and technological expertise now dominate high-value segments of the global value chain, while developing economies specialize in labor-intensive manufacturing.
Furthermore, the digital economy has expanded trade beyond physical goods. Digital services — from cloud computing and fintech to online education — are now significant components of international commerce. A freelancer in the Philippines, a software firm in India, and a design studio in the U.S. can collaborate seamlessly in real time, thanks to digital trade platforms.
However, this technological leap also brings challenges. Automation threatens traditional manufacturing jobs in developing nations, while data localization laws and digital protectionism create new trade barriers. As the world moves toward digital globalization, ensuring inclusive access and digital equity becomes a new trade priority.
4. Financial and Monetary Systems: The Flow of Global Capital
Trade cannot function without finance. The global financial system — encompassing currency exchange, cross-border payments, and investment flows — acts as the bloodstream of trade. The U.S. dollar, long the dominant reserve currency, facilitates most international transactions, while central banks and financial institutions provide the credit and liquidity necessary for trade expansion.
Trade finance — letters of credit, guarantees, and export financing — ensures that exporters get paid and importers receive goods. The stability of global finance directly impacts trade volumes. For instance, during the 2008 global financial crisis, liquidity dried up, leading to a sharp contraction in global trade.
Exchange rate fluctuations also affect trade competitiveness. A weaker currency makes exports cheaper and imports costlier, influencing trade balances. Hence, countries often intervene in foreign exchange markets to maintain favorable trade positions — a practice sometimes criticized as “currency manipulation.”
Additionally, capital mobility — the ability of investors to move funds across borders — has made financial markets more intertwined with trade. Foreign direct investment (FDI) fuels industrial growth, infrastructure, and technology transfer, while portfolio investments reflect global confidence in economies.
As digital currencies and blockchain-based payment systems evolve, the future of global trade finance may shift toward decentralization. Central Bank Digital Currencies (CBDCs) could make international payments faster and cheaper, redefining the global monetary order.
5. Infrastructure and Logistics: The Physical Backbone of Trade
Trade relies heavily on physical connectivity — ports, roads, railways, and airports form the arteries of global commerce. Efficient infrastructure determines how fast and cost-effectively goods move from producers to consumers.
Maritime transport carries around 80–90% of world trade by volume. Hence, modern ports like Shanghai, Singapore, and Rotterdam serve as critical global trade hubs. The expansion of the Panama and Suez Canals, along with new infrastructure projects like China’s Belt and Road Initiative (BRI), reflects the growing emphasis on connectivity.
Poor infrastructure, on the other hand, remains a major bottleneck in developing countries. Delays, congestion, and high logistics costs reduce competitiveness and deter investment. Therefore, trade infrastructure investment is not just an economic necessity — it’s a strategic imperative for sustainable development.
The logistics revolution has also introduced new efficiencies. Just-in-time (JIT) inventory systems, global freight management software, and last-mile delivery innovations have minimized waste and improved responsiveness. Yet, as the pandemic revealed, these lean systems can also be fragile when global shocks occur.
6. Geopolitical and Social Factors: The Human Dimension of Trade
Global trade is deeply intertwined with geopolitics. Trade routes, resource control, and economic influence are often used as instruments of national power. Countries form alliances or impose sanctions based on strategic interests, shaping the flow of trade and investment.
The rise of geoeconomics — where economic tools are used for geopolitical aims — marks a major shift. Energy trade, for instance, has been a central element in international relations, with oil-producing nations wielding significant influence. Similarly, rare earth minerals — vital for electronics and renewable technologies — have become a new front in global trade rivalries.
Social factors are equally important. Labor standards, human rights, and environmental sustainability now shape consumer choices and corporate strategies. The ESG (Environmental, Social, and Governance) movement has pushed multinational corporations to adopt responsible sourcing and ethical production practices.
Moreover, trade influences societies by transforming employment patterns, income distribution, and cultural exchange. While globalization has lifted millions out of poverty, it has also widened inequalities in some regions. Thus, social equity and inclusivity have become essential considerations in modern trade policy.
7. Sustainability and the Green Trade Transition
The future of global trade depends on its ability to align with sustainability. As climate change intensifies, nations and businesses are rethinking supply chains, energy sources, and production methods. The concept of “green trade” emphasizes reducing carbon footprints, promoting renewable energy, and developing circular economies.
Green policies — such as the European Union’s Carbon Border Adjustment Mechanism (CBAM) — are reshaping trade norms. Exporters to such markets now face carbon pricing, pushing industries to adopt cleaner technologies. Similarly, green finance and ESG-focused investments are channeling capital toward sustainable trade infrastructure.
Sustainability is no longer an optional pillar but a central force defining competitiveness and resilience in global trade.
Conclusion: Interconnected Pillars for a Shared Future
The pillars of global trade dynamics — economic principles, policy frameworks, technology, finance, infrastructure, geopolitics, and sustainability — together uphold the vast structure of global commerce. Each pillar is interdependent, reinforcing and influencing the others.
The coming decades will witness a reconfiguration of trade networks — driven by technological innovation, climate imperatives, and shifting geopolitical alignments. The challenge lies in ensuring that trade remains inclusive, sustainable, and equitable — balancing efficiency with resilience, and growth with environmental stewardship.
Ultimately, global trade is more than an economic process; it is a reflection of human collaboration and interdependence. As nations navigate the complexities of the 21st century, strengthening these foundational pillars will determine not just the direction of commerce, but the shared prosperity of the global community.
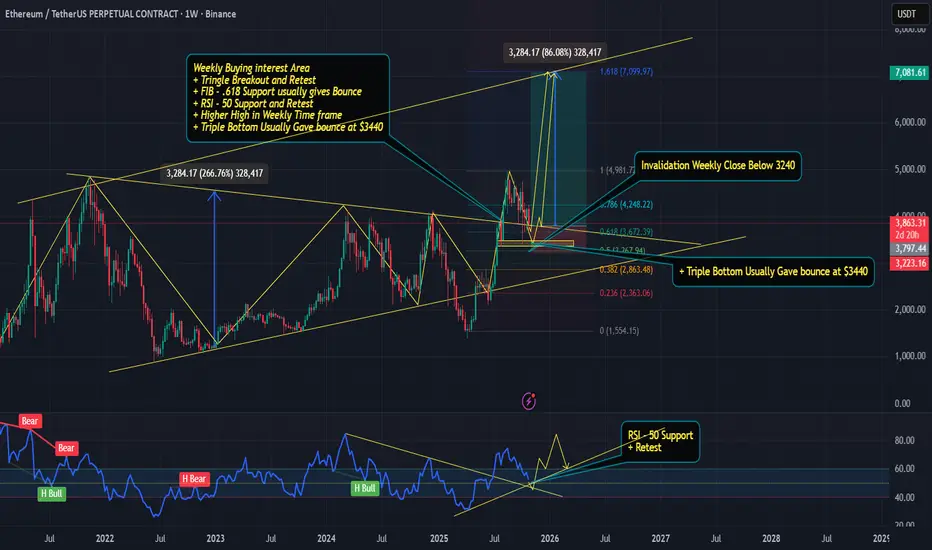
ETH Weekly Setup: Confluent Support Zone - $3440–Bounce Incoming📈 ETH/USDT – Weekly Timeframe Bullish Confluence
Multiple technical factors aligning for a potential bounce in Ethereum:
✅ Triangle Breakout + Retest – Price retesting the upper trendline of a multi-month
symmetrical triangle after a clean breakout. Classic continuation setup.
✅ Fibonacci .618 Support – The golden ratio level (~$3400–$3500 zone) has historically acted as strong dynamic support. Bounces from .618 are high-probability in trending markets.
✅ RSI at 50 Support & Retest – Weekly RSI holding the midline (50) as support. This level often marks the transition from correction to resumption of uptrend.
✅ Higher High Structure Intact – Weekly timeframe still printing higher highs. As long as $3240 holds on close, macro uptrend remains valid.
✅ Triple Bottom Formation – Price has tested ~$3440 three times in recent weeks. Triple bottoms at key levels often precede strong reversals.
🎯 Expected Move: Bounce toward prior swing high (~$4000–$4200) if support holds.
⚠️ Invalidation: Weekly close below $3240 – would break triple bottom neckline and shift bias to bearish.
Not financial advice. Trade at your own risk.
#ETH #Ethereum #Crypto #TechnicalAnalysis #TradingView
Before Gold FoldsThis may take gold to a lower high. "This" being the "buy zone" should be a clean entry with the take profit at or before the sell zone.

Continue to accumulate along the 4058 trend line⭐️GOLDEN INFORMATION:
Gold (XAU/USD) faces renewed selling pressure after an early Asian uptick toward $4,046, pausing this week’s rebound from its lowest level since October 6. The US Dollar (USD) holds near a three-month high following the Federal Reserve’s hawkish stance, weighing on the non-yielding metal.
Additionally, optimism over easing US–China trade tensions dampens safe-haven demand. Still, lingering worries about the prolonged US government shutdown could limit USD strength and offer some support to gold prices.
⭐️Personal comments NOVA:
market accumulation time, sideways around 4000. ended october with volatility
⭐️SET UP GOLD PRICE:
🔥SELL GOLD zone: 4058 - 4060 SL 4065
TP1: $4050
TP2: $4040
TP3: $4020
🔥BUY GOLD zone: 3887 - 3885 SL 3880
TP1: $3900
TP2: $3910
TP3: $3925
⭐️Technical analysis:
Based on technical indicators EMA 34, EMA89 and support resistance areas to set up a reasonable sell order.
⭐️NOTE:
Note: Nova wishes traders to manage their capital well
- take the number of lots that match your capital
- Takeprofit equal to 4-6% of capital account
- Stoplose equal to 2-3% of capital account

BTC UPDATES OCT 31, 2025The price needs to break out of the current range. I’ll take some time to rest, observe the new trend, and analyze the best opportunity. Have a great weekend!

USDCAD — Fib Retracement Rejection & Bullish Continuation SetupUSDCAD is respecting the Fibonacci retracement structure after pulling back from the 1.4078 swing high. The pair retraced toward the 0.618–0.786 zone (1.3818–1.3729), showing strong buying interest near trendline support. This reaction suggests that bullish momentum may resume if price maintains above 1.3820.
Key Technical Levels:
Resistance: 1.4078 (recent high), 1.4250 (long-term target zone)
Support: 1.3818–1.3730 (Fib retracement + trendline confluence)
Extension Target: 1.4250–1.4300 (1.272–1.414 projection)
Outlook:
Price is forming a potential higher low structure aligned with the ascending channel. As long as the structure holds above 1.3800, the next wave higher could target 1.4078, followed by 1.4250.
A daily close below 1.3730 would invalidate the bullish setup and open room for deeper retracement toward 1.3630 (1.272 Fib extension).
Bias:
Bullish continuation favored while price remains above 1.3800, supported by USD resilience and weakening CAD due to softer oil sentiment.

BTC 1W😎Probabilities of a correction to the 55-period moving average, a technical rebound for bullish continuation, without breaking the weekly uptrend.
♥ Keep in mind that a correction to the 55-period moving average on the weekly chart constitutes a bearish trend on the daily chart.

BTC 4H ENG.My kids are scared; they got scared with the October 10th crash. Do you know when they stop being scared? When it goes up! I have my futures take profits at 117k; you're my target. I've had my entry pattern very clear, since I was at 106k. The red box indicates an ideal entry area, although you should already be inside.

BTC 4H ENGLISHBearish divergence forming. We're about to break the previous high. What's next? A pullback continues to rise, as the daily chart holds a bullish pattern. I'm not shorting that trade. I'm waiting for my next bullish entry to complete the daily chart's move.

Building Rock-Solid Confidence: The Trader’s Unshakable EdgeConfidence is the foundation of every great trader — not because it guarantees wins, but because it guarantees consistency. In this session, we break down the psychology of self-belief and how to build confidence that doesn’t crumble when the market tests you.
Learn why confidence isn’t built from profits but from disciplined execution. We’ll cover how to stop second-guessing your trades, rebuild trust in your system, and detach your self-worth from your results. This episode shows you how professional traders use repetition, reflection, and recovery to stay calm, clear, and confident — even in drawdowns.
You’ll learn:
The difference between ego and true confidence
How to rebuild trust in your trading plan
Why the market manipulates your confidence and how to protect it
The 3-step framework for building self-trust in trading
If you’ve ever felt anxious before pressing “Buy” or “Sell,” or you constantly question your setups, this discussion will help you develop the rock-solid mindset needed to execute with precision and confidence.
Tags: trading psychology, trading confidence, self-belief for traders, trading mindset, forex psychology, discipline in trading, consistency in trading, emotional control, trader development, performance mindset

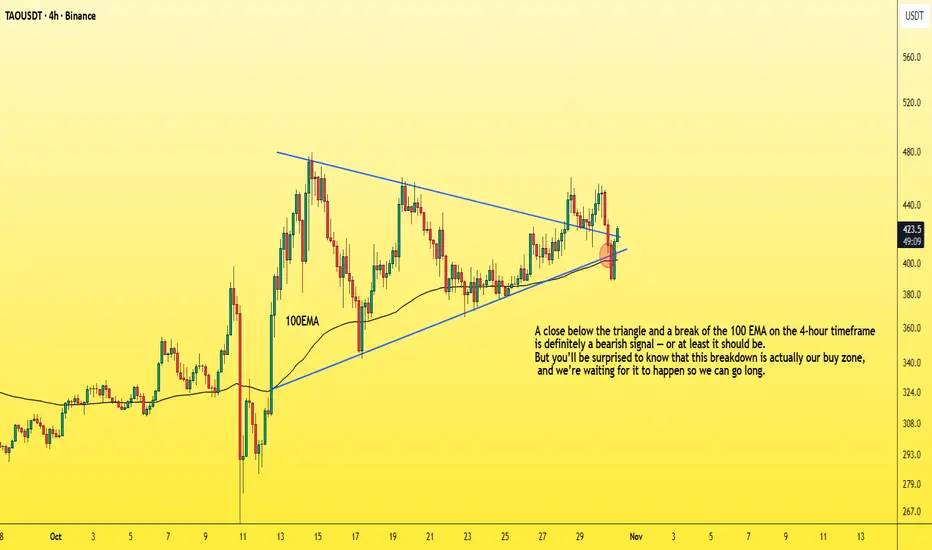
How to enter a successful futures tradeDrop everything and let me show you how to enter a successful long position with the lowest possible risk.
You need to understand that the market maker usually acts against us at major support areas on the chart — like the 100 EMA, 0.618 Fibonacci level, or a trendline.
To make this clearer, let’s take TAO as an example and I’ll explain why.
TAO has strong momentum and a large market cap,
so don’t apply what I’m about to say to meme coins, for example.
Now let’s go step by step on how to enter a futures position after choosing the coin 👇
1. First, wait for a bullish pattern to form — like a triangle — and for the coin to break it upwards with increasing long momentum.
2. The price will then retest the trendline, encouraging people to enter with larger positions, and those who missed the first breakout will likely place buy orders at the retest zone.
3. Then, the market surprises them — it drops back inside the triangle, giving a small bounce at the lower side.
4. But it doesn’t stop there — it continues dropping, breaking below the triangle and closing below the 100 EMA on the 4-hour chart.
This makes you panic and close your long position.
Others start entering shorts thinking it’s a real breakdown.
5. That’s when the market reverses sharply upward,
trapping short traders in losses,
while long traders who exited too early also lose.
In the end, only those who placed buy orders slightly below the strong support level (not directly on it, like under the 100 EMA) — and of course the market maker — end up winning.
So basically, the long traders lose, the short traders lose,
and only a small percentage of smart traders and the market maker win.
Small things to pay attention to 👇
-Your entry point should be slightly below the support, not too far below it.
(That support could be the 100 EMA, below the triangle pattern, or the 0.618 Fibonacci level, as we mentioned.)
-Don’t use high leverage — x5 should be your maximum.
-Place your stop loss 5% below your entry zone,
which equals about 25% loss if you’re using x5 leverage.
And with that, you’ve got yourself a long setup with over a 90% success rate,
and you can apply the same logic in reverse when taking a short position.
Best Regards:
Ceciliones🎯
XAUUSD BUY!!Anticipating market retest to the orderblock below, then a push up to the upside
Entry : 3938.02
TP: 4045.88
SL: 3914.96

XAUUSD POTENTIAL BUY OPPORTUNITY.XAUUSD(Gold) is providing a buy opportunity. Yesterday, market traded and closed above the $4k level. We’re expecting more bullish price action to develop away from the current market price. A buy opportunity is envisaged .

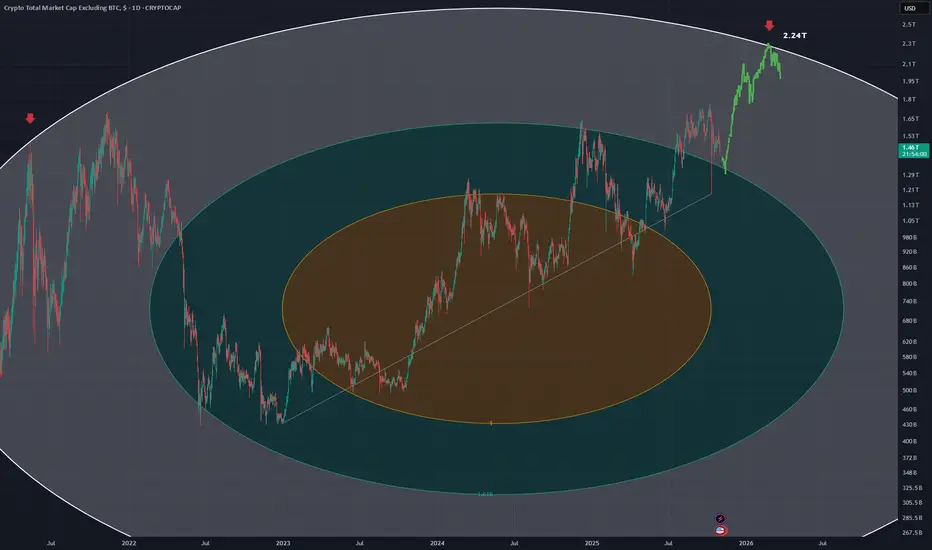
TOTAL2 - Fib CircleUsing a fib circle with a trend from the start of the current bullrun
Looking for another top along 2.618 which can be seen to be a previous top for the last bull run in may 2021 (red down arrows)
Still a fair amount of room to move up for alt coins
This is the daily chart for TOTAL2
ZEC/USDT spot Buy Bullish news: stop monetary tightening
and we are in dip so the best timing to buy then sell part in 336 and 355 or you can only sell in 355 if there will not be bearish news

The way Rate Cuts & Other Events Price InContents
In this idea we will get in to a small deep dive on how rate cuts and most of the other events price in, how you can position your self accordingly, and more. Lets get in to it!
🔹 Important Question
If we were expecting a rate cut and it happens why does price dip in the short term? Lets do a case study.
🔹 Case Study
September 17th, 25bps cuts everybody was hyped. Retail was excited, so why did it go wrong? Look into screen shot 1, we highlighted when the FOMC meeting took place. Price pumped before the FOMC meeting. This is because Interest Rates price in before it happens.
That is how most events play out, 1-2 weeks prior price prices in and according to the event it plays out.
🔹 Different Outcomes
If you were to look at poly market during the last FOMC meeting and the previous ones you could see like 98% people betting its going to be 25bps. That is one indication of what might happen, another on is projections. Many projections were suggesting 25bps as well, so it aligned price priced in before.
Lets say instead of 25bps, 50bps happened or even 75bps. Price would pump up reason being, price priced in based on another expectation. The following would have been the outcome:
No change: Dump 🔴 (Probably hard dump)
25bps: Dump 🔴 (Because priced in before hand)
50bps: Pump 🟢 (Nobody except for insiders were expecting it)
In other words, if a event which is going to be bullish is going to happen price prices in before and based on the event outcome finalization the output plays out.
🔹 Different Type of Events
Lets say something instant just happened, type of events price in at that time. So expected events and unexpected events are completely different. They price in/react different ways.
🔹 How to position
Well as an example if you know Rate Cuts are going to happen on xyz date, prepare for it 2 weeks before position take positions according to forecasts and high bets like poly market (What people bet on the most happens most of the time).
Once the event happens if its a not expected event like instead of 25bps cuts, 50bps happens then keep your position. If its the expected event, then close position. If its like in our rate cut example instead of 25bps its no change then maybe even reverse your position instantly.
⚠️ Disclaimer: Not financial advice.
Thank you
If you have any questions/comments or ideas comment below!
Thank you for reading.

ZEC/USDT spot sellNow we'll see bearish candles, or we'll rise slightly until we reach a strong order block, but I'm not interested in this weak rise that will be followed by a drop. Therefore, I think it's better to exit now until we see if the news about the PCE comes out or not. If it does, it's a good boost for the markets, and if the expectations are positive, the boost will be even bigger. If the result is weaker than expected, the price will fall, and if the result is better than expected, we'll continue with a very strong upward trend. However, if the report doesn't come out due to the government shutdown, it will be very negative again, just like what happened with the GDP news.
Be wary of the fluctuations that will occur from now on, as there may be a surprise positive or negative announcement.

BTCUSD: Bearish outlook?GN gents,
Observe the key levels on chart: bears are in control short term, if price falls from here, it can easily tag the 93-94k area, as long as below $112k, give or take.
If this is the case, downside to $56k becomes a distinct possibility by mid 2026.
I've taken the necessary precautions to be capable of surviving such a scenario, while still being hedged in case of sudden onset of bullishness.
Crossing fingers!
Cheers,
Ivan Labrie.
