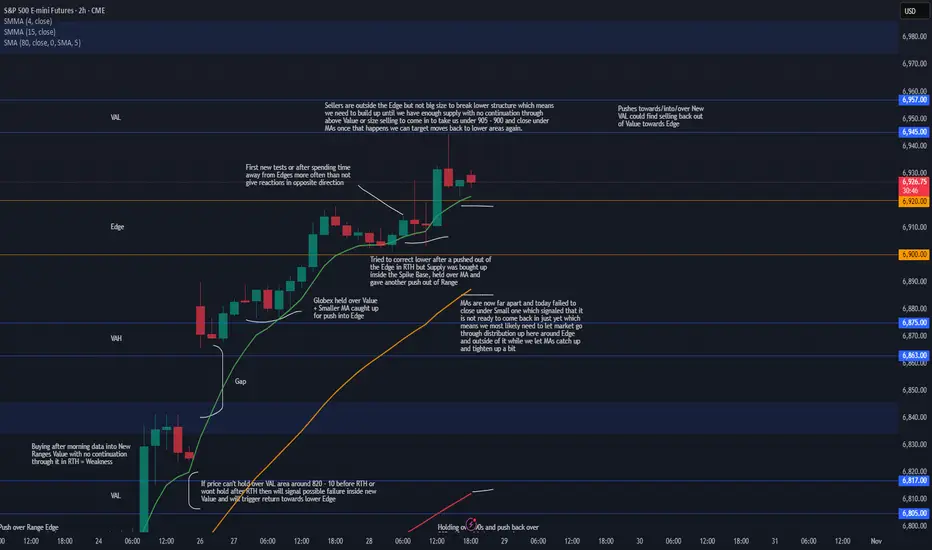
Week 10.26 - 10.31 Updated after GAPSunday Globex gapped up and held over Value which when MAs caught up gave us pushes into upper Edge. Edge areas often act as reversal spots on first tests or after we spend time away from them which it tried to do today but we had good enough buying inside the Spike Base and smaller MA which took in the supply and gave a rotation out of Edge, as we saw price got into VAL and reversed without holding.
There really is no reason for this gap over the weekend and pretty much everyone knows it will be filled but what market showed us today is that we are not ready to come in to start the process for gap fill yet, we have no size operating up here with it being Month End and FOMC tomorrow, FOMC may shake things up BUT we may need to let market balance some up here around Edge and out of it before we can build up the supply and at the same time let MAs catch up to tighten up some to give us a better correction back in.
For now we can see price hold in and out of Edge with pushes towards above VAL and maybe even pushes into/over it BUT careful looking for too much continuation into new Value as we have sellers over the Edge and MAs are far which means any pushes towards/into/over could find their way back out of Value towards lower Edge and eventually once we have enough supply or Volume we can see a push back into/under lower Edge that wont come back out and instead either continue or start holding under to start the process to move for lower targets. For that we would need to be under 905 - 900 area or be able to catch good entry above the Edge and ride it in once market is ready for that.
To see acceptance in this new Range and see more strength we would need to see Medium MA catch up and get over the Edge to provide better support when price pushes into new Value so that it can push in and hold around VAL, until then Small MA acts as Support but it is not something to build big positions on. For now I will be focusing on reversal shorts until market can hold under Hourly MAs and under Intraday VWAP to give better continuation trades lower, I will most likely avoid longs here as they are very choppy and by waiting for good short entries eventually one of them will be the one that will take us back under the Edge and maybe even continue into lower Value so want to be ready for it unless we see strength inside this new Range and good holds over around above VAL.
We have month end coming up and FOMC tomorrow, FOMC is always important but Month end might be more of a mover this time around, being at ATHs so far extended away from MAs on Daily and GAP below we could see profit taking last few days which could give us the pressure to head back under the Edge which would also take stops to add extra pressure for when everyone will be trying to get out so will be watching for that either after FOMC or Thursday/Friday.
Beyond Technical Analysis
NQ GOES TECH PARTY LIKE IT'S 1999, AHEAD OF ITS FINAL CRASHI was dreamin' when I wrote this
So sue me if I go too fast
But life is just a party
And parties weren't meant to last
...
I got a lion in my pocket
And, baby, he's ready to roar, yeah, yeah
Everybody's got a bomb
We could all die any day, oh
But before I'll let that happen
I'll dance my life away
Oh
Yeah
--
Best wishes,
@PandorraResearch Team

LIO Target is 0.75Next target is 0.75 based on chart pattern and 3x production increase within 1 year by improved recovery and heavy investment in mine equipment (see 50% dilution for 300tpd doubling CAPEX).

GBPJPY looking into itHad a bit of s turbulent start to my week so taking it back a couple notches, tweaking a couple of bits here and there and speculating a couple of positions. Here is one of said speculations.

AMP Futures - Introducing Multi-Condition alertsIn this idea we will demonstrate how to create Multi-Condition alerts using Tradingview.

Lion One Shareholders get rid of the weak handsFirst let us get rid of the weak hands, use this immense opportunity to buy this junior producer at 50% below NPV resource 2027 value. This is the next 100000 oz producer

USD/CHF Monthly: Bearish Continuation after Liquidity Retest - TTimeframe: Monthly (M1)
Current Market Thesis:
USD/CHF has undergone a significant structural break to the downside on the monthly chart. After a deep retracement, price is now showing signs of rejection from a key bearish liquidity zone. Our analysis anticipates a strong bearish continuation, targeting fresh multi-year lows.
The Bearish Setup (The Catalyst):
Massive Bearish Structure: The dominant theme is the clear break of market structure (BOS) to the downside, indicated by the strong bearish impulse move.
Liquidity Sweep (Turtle Soup - TS) & Retracement: Price has retraced deeply into a critical zone. We've seen a potential 'Turtle Soup' (TS) developing, where price sweeps liquidity above previous swing highs (e.g., around 0.81516 and the 'CRTL + TS' line at 0.80720). This liquidity grab often precedes a strong reversal or continuation in the dominant direction.
High-Probability Sell Zone: The region around 0.80720 - 0.81516 is a confluence of:
Prior structural resistance.
Areas where smart money would likely seek to distribute (sell) to trap late buyers.
The rejection from this zone signifies the potential exhaustion of buyers and the re-assertion of bearish pressure.
The Target (The Destination): Fresh Multi-Year Lows
The anticipated bearish impulse is expected to drive price significantly lower, past current support levels:
Immediate Support: The 'XL' (e.g., around 0.79360) and 'CRTL' (0.78290) lines represent intermediate support levels that are expected to be broken decisively.
Primary Target (Long-Term): The ultimate target is the 0.77121 level and potentially much lower, as indicated by the extended dashed bearish path. This area represents fresh lows not seen in a long time, aligning with the powerful monthly bearish structure.
Plan Summary:
Entry: Look for bearish confirmation on lower timeframes (e.g., daily/4H structure breaks) as price rejects the 0.80720-0.81516 zone.
Target 1 (Intermediate): Break below 0.78290.
Target 2 (Primary): The 0.77121 level and beyond, projecting new lows.
Risk Management: Place stop-loss comfortably above the highest point of the liquidity sweep/rejection zone (e.g., above 0.82000 or the 'BSL' lines) to account for potential wicks.
This is not financial advice. Trade what you see, not what I say.
Greetings,
MrYounity

EUR/USD 4H: Liquidity Sweep Targeting High-Level Bearish FVGTimeframe: 4-Hour (H4)
Current Market Thesis:
EUR/USD is in a short-term corrective phase, currently hovering just above key support after sweeping multiple lows. Our analysis anticipates a rally from this support structure to fill the higher-timeframe imbalance (Bearish FVG 4H) before resuming the broader bearish trend.
The Bullish Setup (The Fuel): Turtle Soup & Candle Range Theory
Liquidity Sweep (Turtle Soup - TS): Price has violated (swept) the liquidity resting beneath recent swing lows (the marked 'TS' levels). This is the classic Turtle Soup pattern, indicating a clean-out of weak hands (early shorts) before a reversal.
Bullish FVG Support: This liquidity sweep is ideally pushing price into the marked Bullish FVG 4H. This imbalance acts as strong support, where smart money is expected to step in and push the price higher to seek equilibrium.
The 'SMT BUY' and lower 'CRTL + TS' lines confirm the expectation that these lows must be cleared to gather the necessary buy orders for the push up.
The Target (The Destination): Bearish FVG & BOS
The immediate rally is expected to target the high-volume resistance zone overhead:
Primary Target Zone (TR): The Bearish FVG 4H (approx. 1.16800 - 1.17000).
Price has an obligation to re-balance this gap.
High-Probability Exit: The overhead BOS/BOS (1.17114 - 1.17292) represents a major structural level and accumulated buy-stop liquidity. This is the optimal point for a reversal or a major profit-taking level for the current long setup.
Plan Summary:
Entry: Look for confirmation (e.g., lower timeframe structure shift) following the rejection of the Bullish FVG/TS area.
Target 1 (Conservative): Lower boundary of the Bearish FVG 4H.
Target 2 (Aggressive): Liquidity/BOS around 1.17114 - 1.17292.
Outlook: Once the Bearish FVG is filled and the liquidity above 1.17000 is cleared, we will look for confirmation of the continuation of the overall downtrend (potential 'Turtle Soup' Short setup at the high).
Risk Management: Place stop-loss comfortably below the lowest swept liquidity point to protect capital if the support fails.
This is not financial advice. Trade what you see, not what I say.
Greetings,
MrYounity

ElDoradoFx PREMIUM – GOLD ANALYSIS (29/10/2025, ASIA SESSION)Gold (XAUUSD) closed the US session near 3,950 after rejecting from the descending trendline and the intraday 200EMA cap around 3,960–3,970.
The current structure shows a corrective rebound inside a broader bearish leg, with D1 still pointing down but short-term exhaustion visible around 3,885–3,900.
Asia opens with minor consolidation below resistance, setting the stage for either a continuation breakdown or a temporary pullback to 3,970–3,990 before sellers re-enter.
⸻
2. Technical Breakdown
Daily (D1)
• Still in a clear corrective phase after failing to hold 4,100–4,140 resistance.
• Price now hovering above the 100-day EMA at 3,842, which acts as medium-term support.
• RSI at 47 – neutral but with downside pressure.
Bias: Bearish while below 3,996; looking for retracement sell setups.
⸻
1H Chart (H1)
• Price rejected from descending trendline near 3,970–3,980.
• Currently consolidating near 3,950, with structure forming a wedge under the 50EMA and 200EMA.
• MACD histogram turning flat, RSI recovering from 27 → 45 range.
Bias: Neutral-to-bearish; a rebound toward 3,970 may offer short opportunities.
⸻
15M Chart (M15)
• Micro bullish correction from 3,886 → 3,960, now forming lower highs.
• Momentum fading near 200EMA (3,955–3,960).
• RSI oscillating around 50; MACD decreasing – indicating loss of short-term momentum.
View: Expect a liquidity sweep into 3,970–3,985, then potential sell reaction.
⸻
5M Chart (M5)
• Tight consolidation between 3,948–3,960; lower timeframe CHoCH visible.
• EMA stack is compressing, hinting at volatility buildup.
• A clean break below 3,945 could trigger a new push to 3,920/3,900.
Short-Term View: Scalpers may watch for fake-out above 3,960 or breakout below 3,945.
⸻
3. Fibonacci Analysis (Last Swing: 4,019 → 3,886)
• 38.2% = 3,936
• 50% = 3,952
• 61.8% = 3,967
✅ Golden Zone = 3,952 – 3,967 → current price zone (high confluence).
⸻
4. High-Probability Trade Scenarios
🟥 Bearish Continuation (Primary Bias)
• Sell Zone: 3,952 – 3,970 (Fibonacci + 15M EMA confluence)
• Trigger: Bearish engulfing or 5M structure break below 3,945
• 🎯 Targets: 3,925 → 3,905 → 3,886 → 3,860
• 🛑 SL: Above 3,975–3,980
⸻
🟩 Bullish Reversal (Countertrend)
• Buy Zone: 3,910 – 3,920 (intraday demand)
• Trigger: Clear 5M CHoCH + bullish engulfing
• 🎯 Targets: 3,940 → 3,955 → 3,970
• 🛑 SL: Below 3,900
⸻
5. Fundamental Watch
• Asia session quiet — focus remains on USD and US yields after yesterday’s strong data.
• DXY remains elevated near 106.20 → limits upside on gold.
• Traders should anticipate low volatility early, followed by possible retracement during London buildup.
⸻
6. Key Technical Levels
Type Levels (USD)
Resistance 3,952 / 3,970 / 3,985 / 3,996
Support 3,930 / 3,910 / 3,886 / 3,860
Golden Zone 3,952 – 3,967
Break Sell Trigger <3,945
Reversal Trigger >3,970
⸻
7. Analyst Summary
Gold remains trapped below major EMA resistance and inside a corrective wedge.
The Golden Zone (3,952–3,967) aligns perfectly for fresh sell entries if momentum confirms.
Unless bulls reclaim 3,980+, the probability favors continuation toward 3,910 → 3,886.
Preferred Strategy:
Sell retracement from 3,952–3,970 (with confirmation).
If price breaks 3,945 → sell continuation.
Avoid buys unless 3,970 breaks and holds.
⸻
8. Final Bias Summary
Primary Bias: Bearish
Secondary Bias: Countertrend buy only from 3,910 support
High-Probability Zone: 3,952 – 3,967
Breakout Confirmation: Sell below 3,945
Invalidation: Above 3,980
⸻
🥇 ElDoradoFx PREMIUM 3.0 – PERFORMANCE 28/10/2025 💸
📊 Precision entries. Consistent gains.
━━━━━━━━━━━━━━━
🟢 BUY LIMIT +45 PIPS
🟢 BUY +80 PIPS
🟢 BUY +30 PIPS
🟢 BUY +90 PIPS
🟢 BUY +110 PIPS
🔻 SELL +60 PIPS
🟢 BUY +110 PIPS
📱 BTC BUY +600 PIPS
━━━━━━━━━━━━━━━
🏆 GOLD TOTAL: +525 PIPS
🪙 BTCUSD BONUS: +600 PIPS
💰 TOTAL DAILY PROFIT: +1,125 PIPS
📊 8 Signals → 8 Wins | 0 SL
🎯 Accuracy: 100% ✅
━━━━━━━━━━━━━━━
🔥 Flawless day! Every setup hit target with precision — GOLD and BTC both in perfect sync.
👏 Congratulations if you profited! ✅✅✅🚀🚀🚀

SPX - The Road to 6900 Begins “History never repeats itself. Man always does.”
A deep look into SPX History exposes the path of a market cycle and tells us the truth on where markets are headed.
Percentages don't lie.
See you guys at 6900!

Nvidia - Squeezing every single bear!🧯NVidia ( NASDAQ:NVDA ) is finally breaking out:
🔎Analysis summary:
Over the course of the past couple of months, Nvidia has been rallying +125%. Considering the market cap of Nvidia, this is already an insane move but clearly not the end. We can still see another +25% from here, before Nvidia will then retest the next resistance.
📝Levels to watch:
$250
SwingTraderPhil
SwingTrading.Simplified. | Investing.Simplified. | #LONGTERMVISION

Dogecoin - This is just insane!🧠Dogecoin ( CRYPTO:DOGEUSD ) is incredibly strong:
🔎Analysis summary:
During the end of last week, we literally saw a flash crash on Dogecoin, correcting about -50% in just a couple of minutes. However, bulls actually took their chance and bought the dip accordingly. This is just another sign that Dogecoin remains totally bullish now.
📝Levels to watch:
$0,5
SwingTraderPhil
SwingTrading.Simplified. | Investing.Simplified. | #LONGTERMVISION

EURCAD higher bearish expecting
OANDA:EURCAD trend based analysis, currently we having bounce from strong sup zones, we are have long time bullish trend, for me this here is point of revers.
SUP zone: 1.63200
RES zone: 1.61500, 1.61000

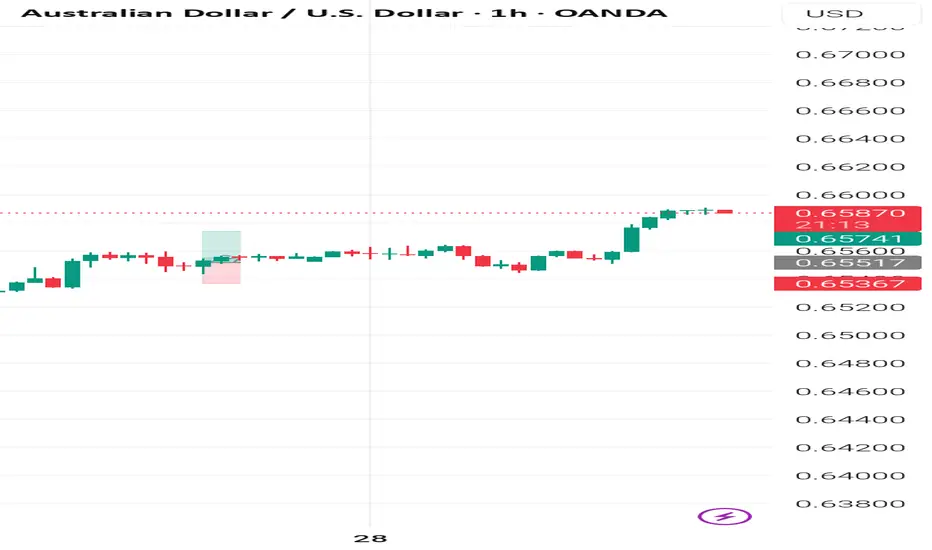
Thoughts on the current narrative: Tuesday 28 October The overall positivity has continued, the AUD is currently the standout strong currency, thanks to US / CHINA de-escalation hopes and possibly anticipation of a high CPI print (due during the upcoming ASIAN session).
Barring a bout of JPY strength (possibly profit taking following positive rhetoric as Mr Trump visits Japan?).
The USD and JPY have remained weak following the weekly 'opening gap'.
Regarding 'opening gaps', I personally look at the chart as if it was a single candle, which generally leads to an inclination that a pullback is due sooner rather than later.
The GBP is in the douldrums thanks to fresh fiscal concerns. Combined with last week's 'soft CPI data' there is a very strong case for short GBP, particularly AUD GBP short. Although, I hasten to add that I would still 'long the GBP' as part of a 'risk on trade', if it had the most momentum at the time, such as GBP JPY long.
Currently, my view is to continue looking for 'risk on trades'. Ideally with 'at least' a cluster of 15 min swings (ideally 1hr swing), following a pullback. JPY or USD (arguably CHF) short. Vs AUD or whichever currency you favour in the moment.
Of course, there are a plethora of events to potentially change the narrative at any moment. Earnings season, FOMC, AUD CPI, BOJ. Along with the ongoing US / CHINA narrative. Thursday's European session in particular could be interesting following the FOMC, BOJ and tech earnings all reported within a few hours of each other.
Currently, considering the shutdown, I'm content with two trades per week. It's pleasingly surprising that although I've only placed one trade so far, I am thinking that I could have placed three. (2x risk on, 1x GBP)
my crush told me about gold After people all over the world lined up in front of gold shops, you can already assume that within the next three months, the market will inevitably collapse. However, I don’t believe the current decline marks the true end. Investors haven’t completely lost hope in the market yet. And as long as there’s hope, there’s still buying demand.
A sharp one-way crash from here would be too easy for short-term speculators, short traders, and the so-called “Smart Money” — the top 1% who have driven gold prices up since the beginning of the year with enormous capital. They won’t sell their positions at prices that are too low or too quickly.
That’s why I think there’s a high chance of one more rebound, possibly pushing prices to the level where people start believing gold will reach $5,000 per ounce. Of course, the market never moves the way the majority expects.
Therefore, I see the $4,600–$4,8XX zone as an ideal area to take profits or open short positions. Nothing can rise parabolically forever — greed always has an end, and eventually, it turns into fear. When that happens, the market collapses.
NFA — I’m just writing this so I can sleep.

Fibonacci Beyond the ObviousFibonacci Beyond the Obvious
The Professional Approach — WerkTrader Edition 🎯
1️⃣ Introduction – More Than Just a Sequence
Fibonacci is not magic, myth, or a decorative tool for colorful charts.
It is a mathematical ratio that appears in nature, architecture, music – and yes, in markets.
If you only know Fibonacci as the 61.8 retracement, you understand the concept,
but not the depth.
A true analyst doesn’t use Fibonacci to draw lines –
he uses it to measure structure,
to see where the market stands in relation to itself.
2️⃣ The Principle of Self-Similarity
Markets are fractal.
They move in repeating proportions, regardless of timeframe.
A 38.2 pullback on the 15-minute chart can have the same character
as a 61.8 retracement on the daily.
Professionals call this Fractal Alignment –
multiple timeframes reacting to the same ratio,
and that’s exactly where the decisive moves occur.
3️⃣ Fibonacci Timing – The Invisible Factor
Most traders measure price, not time.
But Fibonacci also works horizontally.
13, 21, 34, 55 – not as price levels,
but as candle intervals between significant highs and lows.
These Fibonacci Time Projections reveal
when market cycles overlap –
often the moment before price reacts to a known zone.
Institutional models use this quietly,
while retail traders almost always overlook it.
4️⃣ Fibonacci in Orderflow
Fibonacci zones are not magical support lines –
they are points of liquidity interaction.
At 61.8 %, three groups often collide:
1️⃣ Retail shorts fading the retracement,
2️⃣ Smart-money algorithms collecting liquidity,
3️⃣ Position builders using the pullback for entry.
Fibonacci is not a signal – it’s a trigger area,
a place where energy releases.
5️⃣ Asymmetry and Precision
The famous ratio φ ≈ 1.618 is mathematically perfect,
but markets are not.
A professional observes the deviation from the ideal –
often just 1–2 %.
Those small over- or undershoots reveal who dominates:
reaction or manipulation.
This is called Fibonacci Deviation Bias –
a subtle detail that shows whether a zone was merely tested
or truly broken.
6️⃣ Cluster Theory – The Art of Overlap
A single level is coincidence.
But when multiple retracements or extensions
align within the same price area,
a cluster is formed.
This overlap of different swings is called Confluence.
The more Fibonacci relationships converge,
the stronger the reaction.
A professional doesn’t look for the “perfect number” –
he looks for the connection of proportions.
Mathematics confirms itself where ratios intersect.
7️⃣ Fibonacci & Harmonic Patterns – Geometry of Confirmation
Harmonic patterns are the advanced geometry of Fibonacci relationships.
They consist of several precisely measured retracements and extensions,
forming a geometric reversal structure –
like the Gartley, Bat, Butterfly, or Crab.
Each one is built on the same base ratios:
XA → AB = 61.8 %,
BC = 38.2–88.6 %,
CD = 127–161.8 %.
When these measurements meet at a single point,
they create the PRZ (Potential Reversal Zone) –
the mathematical intersection between order and chaos.
The more Fibonacci connections overlap,
the stronger the confirmation.
That’s not coincidence – that’s confluence in its purest form.
8️⃣ Fibonacci as a Language
Fibonacci is not a strategy – it’s a language of proportion.
It doesn’t tell you where to buy,
it tells you where to listen.
The market doesn’t speak in words,
it speaks in ratios.
Those who understand them see structure
where others see only lines.
9️⃣ Conclusion – The Silence of Numbers
Fibonacci is not a myth.
It is the quietest form of truth in the market.
Numbers themselves do not speak –
but they show you where the market reacts,
where mathematics meets psychology,
and where patience becomes power.
Fewer lines.
More meaning.
This is Fibonacci – beyond the obvious.
WerkTrader 🎯

XAU/USD Completing Wave Y: Final Dip Before RallyGold has completed its major 5-wave rise and is now finishing a corrective W-X-Y pattern. The recent drop looks like the final leg of this correction, meaning sellers are getting weaker. Price may show a small bounce up and then one last dip to complete the correction. After that final drop, a strong new uptrend is expected to start again. In short: correction ending soon, last dip big bullish move ahead.
Stay tuned!
@Money_Dictators
Thank you :)

EURAUD IS ABOUT TO SKYROCKET EurAud Is about to hit DAILY 🔴 DEMAND ZONE, IF you're about to sell this pair you're trading against the FORCE

Making the swap worked. Even with the quite market When trading tired I can mistakes, choosing the wrong forecast 2 days ago was a result of that
Thankfully as time passes Option B proves to be correct which means the AI models are still calling the future of price action before it happens!

Methodology: Smart Money Concept (SMC) 📈 BULLISH ANALYSIS - XAUUSD (GOLD)
Timeframe: 15M - 1H
🎯 TRADE SETUP
· ENTRY ZONE: 3,930
· STOP LOSS: 3,892
· TAKE PROFIT: 4,018
· RISK/REWARD: 1:2.32 ✅
📊 MARKET CONTEXT
· Liquidity Sweep Complete: The market swept the buy stops below 3,900, trapping late sellers.
· FVG (Fair Value Gap) on 1H: A clear imbalance exists near 3,930, acting as a bullish magnet.
· Order Block (15M): Price rejection at 3,930 confirms institutional buying interest.
· Fakeout & Inducement: Retail was fooled into shorting the lows, just before the reversal.
🔍 SMART MONEY FLOW
Phase: Accumulation
Institutions loaded longs during the dip (3,892-3,930) while weak hands capitulated.
Next Target: 4,018
This is a liquidity pool above the recent high — where sell stops likely cluster.
New Higher High (HH) Incoming
A break above 4,018 confirms the resumption of the bullish trend.
🎮 TRADE LOGIC
Step 1: Liquidity grab below support (trapping sellers)
Step 2: Price returns into FVG + Order Block
Step 3: Rally toward liquidity above 4,018
⚖️ RISK & REWARD
· Risk: 38 points
· Reward: 88 points
· R/R Ratio: 1:2.32
· Position: Long (Buy-side)
📉 SCENARIOS
· Main (70%): Direct push to 4,018 after holding 3,930.
· Retest (30%): Quick dip to 3,910-3,920 before the rally.
· Invalidation: Close below 3,892 (break of accumulation zone).
💬 MOTIVATIONAL CLOSE:
“The market shook out the weak — now it’s our turn. We’re not chasing; we’re entering where institutions accumulated. The fakeout is over. The rally is just beginning. Trust your edge. Let’s ride this to 4,018! GOOD LUCK TRADERS…💪🎯

SHORT SIGNAL Price contacted 4h 🟤Supply zone, we're expecting the price to drop from this 🟤supply zone.

Did weekly lows for GBP/JPY get put in?The exchange rate has declined a little bit less then one percent from the weekly open. In reference to the current weekly high price has declined greater then one percent. Seeing as there is not any major data for the Yen or GBP. This feels like a safe position for me considering all of the implied interest rate cuts forecasted for this week. Using UIP for directional bias and TP, hoping to roll it up if GBP03Y yields climb. SL is ATR(14)x1.5.

EURUSD H3 BULLISH SETUPEurusd Buying Now
Eurusd H1 Time Frame Give A Great Bullish Fair Value Gap And On h3 Time Frame It Seems RBS , PULLBACK BUY - Resistance Becomes Support So We Are Considering Bullish Here Target Buy Side Liquidity
