USDCHF SHORTAfter a BOS on 4 h create a new HH
we wait for BOS on 15 MN create a LL
After take a SELL trade on SUPPLY create on 15 MN
Beyond Technical Analysis

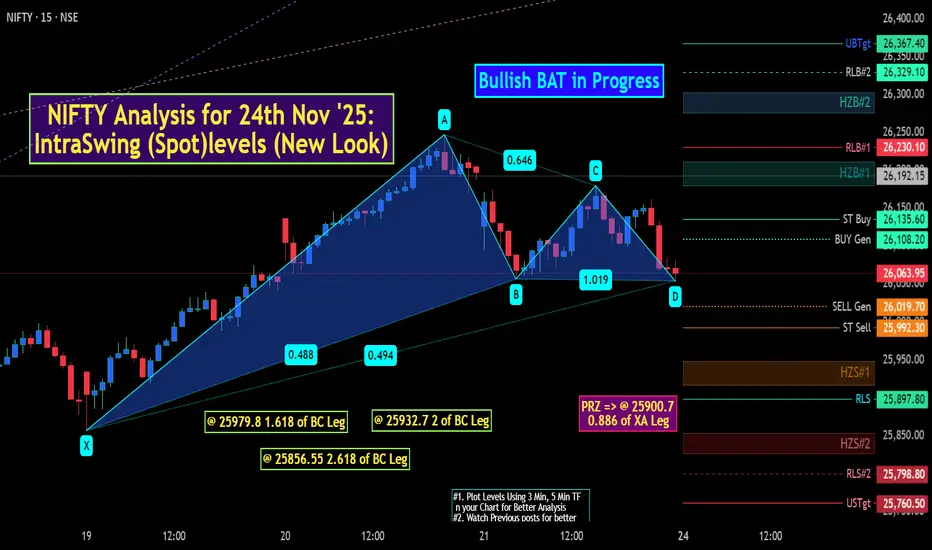
NIFTY Analysis 24th Nov '25: IntraSwing (Spot)levels (New Look)The Bullish Bat pattern is a Harmonic price formation used in technical analysis to identify potential reversal zones where a downtrend may end and a new uptrend could begin. It is defined by precise Fibonacci retracement and extension levels for each leg of the XABCD structure.
Bullish Bat Pattern Conditions
XA: The initial surge upward, forming the basis of the pattern.
AB: A retracement downward from XA, reaching 38.2% to 50% of the XA leg.
BC: A corrective move upwards, spanning 38.2% to 88.6% of the AB leg.
CD: The final decline, typically an extension of 161.8% to 261.8% of BC, but most importantly, ends at 88.6% retracement of XA. This D point is known as the Potential Reversal Zone (PRZ).
Probable reversal Point as oer HARMONIC Bullish BAT Pattern:
👉🏽 @ 25979.8 1.618 of BC Leg
👉🏽 @ 25932.7 2 of BC Leg
👉🏽 PRZ => @ 25900.7 i.e 0.886 of XA Leg
👉🏽 @ 25856.55 2.618 of BC Leg
Additional Criteria and Trade Setup
The D point forms after a significant downtrend and should ideally show signs of reversal, such as bullish candlestick patterns or divergence on oscillators like RSI/MACD.
🌈Traders typically wait for a reversal signal at the PRZ (near the 88.6% retracement of XA) before entering a long position.
🌈Stop-loss is usually placed a bit below the X point, with profit targets at various Fibonacci retracement levels of the CD leg or the C/A points for more conservative exits.
🪸At a GLANCE:
Fibonacci Levels for Bullish Bat
Leg Requirement (Bullish Bat)
XA Initial upward move
AB Retrace 38.2% to 50% of XA
BC Retrace 38.2% to 88.6% of AB
CD Extend 161.8%–261.8% of BC,
Complete at 88.6% of XA
[ Level Interpretation / description:
L#1: If the candle crossed & stays above the “Buy Gen”, it is treated / considered as Bullish bias.
L#2: Possibility / Probability of REVERSAL near RLB#1 & UBTgt
L#3: If the candle stays above “Sell Gen” but below “Buy Gen”, it is treated / considered as Sidewise. Aggressive Traders can take Long position near “Sell Gen” either retesting or crossed from Below & vice-versa i.e. can take Short position near “Buy Gen” either retesting or crossed downward from Above.
L#4: If the candle crossed & stays below the “Sell Gen”, it is treated / considered a Bearish bias.
L#5: Possibility / Probability of REVERSAL near RLS#1 & USTgt
HZB (Buy side) & HZS (Sell side) => Hurdle Zone,
*** Specialty of “HZB#1, HZB#2 HZS#1 & HZS#2” is Sidewise (behaviour in Nature)
Rest Plotted and Mentioned on Chart
Color code Used:
Green =. Positive bias.
Red =. Negative bias.
RED in Between Green means Trend Finder / Momentum Change
/ CYCLE Change and Vice Versa.
Notice One thing: HOW LEVELS are Working.
Use any Momentum Indicator / Oscillator or as you "USED to" to Take entry.
⚠️ DISCLAIMER:
The information, views, and ideas shared here are purely for educational and informational purposes only. They are not intended as investment advice or a recommendation to buy, sell, or hold any financial instruments. I am not a SEBI-registered financial adviser.
Trading and investing in the stock market involves risk, and you should do your own research and analysis. You are solely responsible for any decisions made based on this research.
"As HARD EARNED MONEY IS YOUR's, So DECISION SHOULD HAVE TO BE YOUR's".
Do comment if Helpful .
In depth Analysis will be added later (If time Permits)
Report 24/11/25Report summary:
Europe’s policy debate has pivoted from cyclical noise to structural urgency. Christine Lagarde warned that the euro area’s export-led “old growth model” is out of date and that years of inaction risk a slow grind lower in productivity and per-capita income. Her prescription is to deepen the single market and remove internal trade barriers so domestic demand can carry more of the load, a message sharpened by Germany’s protracted manufacturing slump. This is a meaningful shift in elite signaling: it frames EU stagnation as a design problem rather than a business cycle dip, and it implies a multi-year policy program that favors services, capital-market integration, and defense/tech over heavy industry status quo.
At the same time, Brussels is pressing ahead with a “reparations-style” loan that would use the income from frozen Russian assets to collateralize roughly €140 billion for Ukraine, despite competing ideas out of Washington to redeploy the funds for U.S.-led vehicles. The plan’s viability rests on EU political consensus and legal comfort with the primacy of sanctions law over sovereign asset protections; if it holds, it creates a medium-term floor under Kyiv’s financing and a fresh precedent for sanctions leverage in geopolitical bargaining.
Japan is moving the other way on the cycle: a new ¥21.3 trillion (~$135 billion) package mixes energy subsidies, cash handouts, and tax cuts to cushion real incomes and counter tariff-related shocks. Markets faded the “Truss moment” angst, but the bigger macro tell is in rates: Japan’s 10-year JGB yield is pressing multi-decade highs near ~1.78%–1.80%, reflecting both fiscal supply and a slow-moving regime shift at the BOJ. The policy mix, more fiscal, less BOJ repression, keeps USDJPY volatile, raises MoF intervention risk if disorderly FX develops, and re-prices term premia globally via portfolio rebalancing.
Over in the U.S., a different kind of regime change is underway in capital markets: the “AI capex” financing machine. Investment-grade titans and speculative-grade data-center developers have flooded debt markets; Oracle’s credit-default-swap costs jumped as issuance and leverage climbed, and analysts now talk about another ~$20–$60 billion from data-center issuers next year if financing conditions allow. The broader template is stark: Wall Street expects big-tech borrowing of roughly $1.2 trillion from 2025–2028 to fund an AI build-out that could approach $3 trillion in total spend, leaving equity, private credit, ABS, and vendor financing to fill the gap. That’s powering near-term growth but also tightening financial conditions for the marginal borrower and increasing draw-down risk if adoption proves S-shaped rather than exponential.
Energy geopolitics adds another shock-absorber/accelerant. Fresh U.S. sanctions on Russian oil have widened Urals’ discount to Brent, stranded sanctioned barrels at sea, and driven crude afloat to ~1.4 billion barrels while tanker day-rates jump. This raises freight-adjusted delivered prices for some buyers and lengthens supply chains as India and China probe alternatives in the Americas. If sustained, higher shipping costs tighten effective supply even if headline output is stable, a bullish skew for time-spreads and for crack margins if logistics bottlenecks persist.
U.S. monetary policy is the wild card short-term. The Fed is openly split after two cuts, with some officials citing firmer labor and sticky services inflation to argue against a December move; the shutdown-delayed data flow has complicated consensus-building. Markets that had priced a near-certain cut marked odds back to a coin-flip and the dollar firmed. This tug-of-war keeps rate-sensitive equities choppy and supports DXY on dips while curve steepening remains the path of least resistance if growth doesn’t crack.
Western trade policy is hardening. Allies are coordinating to contain subsidized Asian steel overcapacity, a step that would entrench defensive measures beyond the U.S. and EU and nudge input costs higher for downstream users. In the Americas, the White House removed 40% tariffs on slices of Brazilian food imports to temper U.S. food inflation, signaling tactical dial-a-tariff flexibility rather than a clean de-escalation of protectionism. The common theme is industrial policy with a CPI lens.
Market reactions and near-term setup
U.S. equities are oscillating between hopes of a gentle disinflationary glide and the reality of capital-intensive AI economics. November saw the Nasdaq slump as investors punished cash-burn-adjacent AI stories and questioned returns on the next $500 billion of big-tech capex, yet breadth improved late in the week as non-AI cyclicals rallied. Expect “violently flat” tape: big ranges, muted trend until a catalyst resets the earnings/discount-rate mix. Positioning is rotating toward cash-returners and old-economy beneficiaries of the AI build (power gear, engines, grid).
European risk assets are bifurcating. Banks and defense/aerospace remain relative winners on regulatory flexibility and fiscal rearmament talk, while exporters tethered to capex goods lag amid weak global manufacturing. Lagarde’s push for single-market deepening is equity-positive in the long run but slow-acting; near-term, EU assets key off the dollar and the U.S. rate path.
JGBs are under persistent pressure as supply and term premia reprice. Foreign inflows into long JGBs have picked up given improved hedged yields and life-insurer asset-liability shifts, but the market will still demand higher coupons if fiscal packages multiply. The BOJ’s slower purchase pace adds another marginal bear impulse. Expect global spillovers via reallocation out of U.S. duration, particularly on hedged bases.
Oil’s micro is dominated by logistics and refined-product dynamics more than OPEC headlines in the very near term. U.S. product demand is running a touch above 20 mb/d into late November, with gasoline normalizing and distillates steady; a prolonged tanker squeeze would tighten physical benchmarks even if OECD inventories look comfortable, a setup that can push Brent time-spreads into backwardation on shipping-led tightness.
Strategic forecasts (3–12 months)
For the euro area, the base case is low-trend growth with positive dispersion. Countries that execute on services liberalization and defense/dual-use tech will outgrow heavy-industry incumbents. A successful Russian-asset loan would stabilize Ukraine support and reduce tail-risk premia in European credit and FX by anchoring war financing, though Kremlin countermeasures are an overhang. The upside risk is a faster-than-expected single-market push that narrows the EU-U.S. productivity gap; the downside is political fragmentation that delays reforms and keeps potential growth sub-1%.
For Japan, modest real growth with rising nominal anchors is plausible if fiscal offsets persist and the BOJ gradually normalizes. The yen’s fair value shifts stronger over the horizon as real yields creep up and the current account benefits from capex-related reshoring and tourism, but path dependence is messy: any USDJPY slide below “lines in the sand” could trigger MoF action that sparks risk-off waves across Asia.
For the U.S., AI-led investment remains a growth prop, yet the financing mix raises credit-cycle sensitivity. If bond buyers demand wider spreads and private credit tightens structures, 2026 capex could slip to the low end of Street estimates for data-center developers. The soft-landing case still holds if labor eases without a profits recession, but the equity factor mix tilts from “duration + narrative” toward “cash + capacity to fund.”
Fiscal and political implications
Lagarde’s critique implies Brussels-level initiatives: capital-markets union, cross-border banking waivers, and defense R&D funding, all of which raise EU banks’ ROE and M&A option value if they materialize. Japan’s fiscal stance, tax cuts and subsidies, keeps households whole but lifts JGB supply needs and medium-term debt-sustainability questions. In the U.S., a divided Fed and a Congress that toggles between deregulatory pushes (e.g., accounting conflicts reconsidered) and tactical industrial policy keeps policy risk high for megacap tech, auditors, and regulated utilities powering data centers.
Key asset implications
Gold (XAUUSD) is a geopolitical hedge caught between elevated real yields and fresh conflict/energy frictions. With the Fed divided and the dollar bid on growth-and-carry, rallies can stall in the absence of a shock; sustained oil shipping tightness or an escalation in Ukraine would argue for renewed upside via risk premia and central-bank diversification. Think choppy with upward spikes on event risk.
S&P 500 and Dow Jones are likely to remain range-bound into year-end as earnings revisions flatten and the market digests the true cost of AI. Favor cash-flow-rich defensives, power-grid/engine suppliers riding off-grid data-center builds, and U.S. industrials with pricing power; fade thematic spikes in highly levered AI-infrastructure plays if spreads re-widen and CDS headlines recur.
USDJPY should stay positively correlated with global yields. Japan’s stimulus and BOJ gradualism keep dips shallow, but any acceleration toward 160 would invite verbal or actual MoF intervention; rallies back toward 150 would likely require either softer U.S. data or a BOJ policy surprise. Expect realized vol to stay high as life-insurers and foreign reserve managers rebalance.
DXY retains a carry and growth premium as long as the Fed resists rapid easing and European/Japanese yields lag on a hedged basis. Event-risk spikes tend to be bought, especially if EU reform is slow and Japan telegraphs only incremental normalization. A clear pivot from the Fed or a synchronized non-U.S. growth surprise would be needed to knock the dollar into a new down-trend.
Crude oil is fundamentally range-bound but tactically skewed higher on logistics. Elevated “oil on water,” rising freight, and U.S. product resilience offset soft spots in OECD macro. Watch how quickly India/China re-route to non-sanctioned grades and whether winter diesel tightens; a fast normalization of shipping would cap rallies, but another sanctions turn could put $5–$10 on Brent via spreads.
Playbook (30–90 days):
The market is rotating from “rates-only” narratives to a three-engine regime, policy mix, financing cost of AI infrastructure, and logistics-driven energy micro. In that mix the base case for the next one to three months is range-bound risk with violent factor swings: the dollar stays resilient on carry, global curves keep a mild steepening bias as Japan and Europe inch toward fiscal-led reflation, and oil trades the logistics tape rather than headline supply. Under that backdrop the most robust portfolio stance is barbelled: own quality cash generators and “picks-and-shovels” to the data-center build on one side, and convex hedges to financing or FX shocks on the other. Below are concrete trade expressions, triggers, and risk controls for your named assets, written to be executable without relying on a single macro outcome.
For gold (XAUUSD), treat the metal as event-volatility insurance funded by carry elsewhere. The near-term headwind is real yields when the Fed sounds cautious on further cuts, but the tail winds, sanctions volatility in energy markets, sovereign asset seizures crossing new legal lines, and central-bank diversification, keep upside convexity alive. Express longs through a call-spread ladder dated beyond the next Fed meeting to avoid theta bleed around speeches; a typical construction buys a call roughly 3% to 5% out of the money and sells one 8% to 10% out, sized so that the maximum loss is under one week of average P&L. If you prefer linear, add on dips that coincide with dollar up-days and U.S. 10-year breakevens steady to higher; cut if the dollar breaks out with real yields rising in tandem, because that mix historically compresses gold’s risk premium rather than reprices it higher. The hedge to a core long is a tight tenor risk-reversal (sell a small put to part-fund the call), but keep the short put notional capped so assignment would be a one-day VaR event, not a portfolio reset.
For U.S. equities via the S&P 500, run a “cash-plus-protection” frame rather than a pure beta bet. Earnings revisions are good but flattening as the street digests the true cost of the next leg of AI capex and the debt it rides in on. Overwrite strength in the index level with 30–45-day covered calls against quality positions that already yield high free cash flow; recycle the premium into 2%–3% out-of-the-money index put spreads, which finance cheaply when implied correlation is low. If you prefer outright index structures, a collar that sells a call roughly 4% out and buys a put 3% down, then sells a second put 7% down in smaller size, creates downside funding without over-insuring grindy tapes. Upgrade the factor mix inside the sleeve: overweight grid equipment, power electronics, engines and backup power tied to data-center build-outs, plus U.S. industrials with pricing power; underweight highly levered AI-infrastructure stories that require continuous market access. The invalidation for a constructive stance is a sharp, credit-led widening in IG spreads alongside a stronger dollar; that combo says “financing is the problem,” in which case switch from collars to outright long puts for a few weeks.
For the Dow Jones, lean into the value tilt as your relative hedge against a stumble in long-duration tech. A simple spread, long Dow futures versus short Nasdaq futures, keeps you market-neutral on U.S. growth while monetizing any further de-rating of capex-heavy stories. If you don’t run futures, you can synthesize with large-cap value ETF versus a mega-cap growth ETF, but keep the pair dollar-neutral and rebalance weekly because factor drift is high in this tape. The stop is not a level but a condition: close the spread if the 3-month change in 10-year real yields rolls over while IG spreads tighten; that mix usually re-accelerates duration leadership and hurts the pair.
For USDJPY, keep a two-handed plan: long-USD tactical swings on dips toward well-telegraphed “lines in the sand,” paired with cheap optionality for a policy or intervention surprise that strengthens the yen. The driver into year-end is still rate-differentials and issuance: Japan’s supplementary budget lifts JGB supply and nudges term premia up, while BOJ normalization remains incremental. Buy USDJPY on retracements that coincide with U.S. yields firming and oil bid, but carry a protective 1-by-2 put spread (long one nearer-dated USDJPY put, short two further-dated deeper-strike puts in much smaller notional) to monetize any Ministry of Finance shock move. Size the options so that, in an intervention gap-down, your delta flips long JPY rather than leaving you naked. If you own Japanese equities, consider funding partial FX hedges via rolling forwards when the basis softens; the carry drag is smaller than the earnings volatility from a fast yen rally.
For the broad dollar via DXY, the path of least resistance is still a buy-the-dip stance as long as non-U.S. growth is patchy and the Fed resists a rapid easing path. The way to trade it without basis noise is a basket: long USD versus EUR and GBP in larger weight and versus a liquid Asian cross in smaller weight to capture policy divergence. Use futures or forward points rather than options unless you specifically want tail cover; if you do, own USD calls struck just beyond recent highs with maturities that hop over the next central-bank meetings. The risk to this stance is a synchronized upside surprise in European services activity together with a BOJ signal that accelerates normalization; should that occur, flip to selling DXY rallies and close any EURUSD shorts first, because the euro will do the heavy lifting of any non-U.S. growth surprise.
For crude oil, trade the structure rather than the headline. Freight tightness, sanction routing and “oil on water” dynamics are as important to prompt pricing as OPEC chatter, and they predominantly express through time-spreads and cracks. If you have access to futures curves, a small long prompt-minus-next calendar (long the nearer month, short the next) benefits from shipping bottlenecks and inventory draw-downs without taking full flat-price beta; pair that with a modest crack-spread long if U.S. product demand firms into winter. If your toolkit is listed options on WTI or Brent, a diagonal call spread—long a nearer-dated at-the-money call and short a further-dated call a few dollars higher, lets you monetize a transient tightness while selling more expensive longer-dated vol. The invalidation is a rapid normalization in tanker availability or a clear downdraft in U.S. product supplied; if either occurs, close structure longs and keep only residual upside via cheap calls.
Risk management across the sleeve should emphasize condition-based exits and position sizing that assumes gap risk. For gold and crude options, cap premium outlay on each structure to no more than your average daily P&L to avoid “insurance becoming the risk.” For equity collars and put spreads, avoid clustering maturities: stagger them so you’re not forced to roll the entire hedge book on the same week. For USDJPY and DXY, treat policy meetings and unscheduled official comments as jump risk; keep some of the FX exposure in options so your first response to a gap is to adjust delta, not liquidate at the worst print. For the Dow-versus-Nasdaq pair, monitor credit spreads and real yields daily; those two variables explain most of the pair’s variance right now, and a regime flip there is your earliest warning to step aside.
Scenario mapping is straightforward. In a benign glide, U.S. growth okay, Europe improving at the margin, Japan steady, shipping constraints lingering, the dollar stays firm but not disorderly, gold grinds with episodic spikes, oil’s structure outperforms flat price, the S&P 500 chops but rewards cash-returning cyclicals, and the Dow-over-Nasdaq pair works. In a financing shock, AI-capex issuers pay up, IG spreads widen, and the dollar rallies, beta underperforms protection, the S&P 500 put spreads pay, Nasdaq lags the Dow, USDJPY pops higher unless MoF steps in, and gold initially stalls before catching a late safe-haven bid. In an intervention or policy upside shock, BOJ hints at faster normalization or MoF acts decisively, the yen strengthens abruptly, DXY softens, gold rallies alongside duration, oil dips on stronger yen and softer global growth expectations, and you monetize the USDJPY downside optionality while covering some equity hedges.

BTC temporary recovery - short term this week📌 BTC Weekly Outlook Update — Plan Remains on Track
Bitcoin continues to follow the expected roadmap with precision. The recent price action confirms a corrective move to the upside before resuming the larger bearish structure.
📍 Current Structure & Price Behavior
BTC has shown a short-term bullish retracement after forming a temporary low. However, the overall outlook remains bearish as price continues to trade below key moving averages and under the major downtrend line.
Price is now heading toward the resistance area between 94,300 and 100,780 USD, where the following confluence exists:
Previous support turned resistance
Fibonacci retracement zone
Trendline rejection zone
Liquidity pool
This area remains the most important zone to watch early this week.
📈 Expected Move — Still Valid
The original plan remains unchanged:
Short-term move upward into the supply zone at 94K → 100K.
Rejection and continuation of the downtrend.
Price targets the Fibonacci 1.618 extension zone at ~80,000 USD.
🎯 Key Target: Fibonacci 1.618 (≈ 80,500 USD)
This level is crucial as it aligns with:
✔ A major demand zone
✔ The 1.618 Fibonacci extension
✔ A deep liquidity sweep level
✔ Potential cycle correction completion
This area is expected to act as the macro support level where buyers step in aggressively.

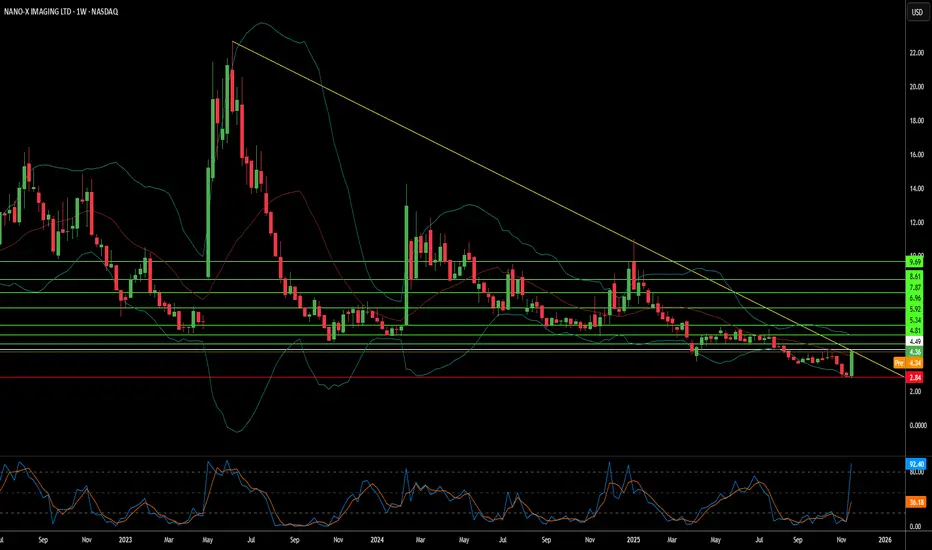
Can X-Ray Technology Really Disrupt a 125-Year-Old Industry?Nano-X Imaging is attempting to fundamentally restructure the medical imaging industry through a convergence of semiconductor innovation and business model disruption. The company has commercialized a cold cathode X-ray source that replaces the century-old thermionic emission technology, which wastes 99% of energy as heat, with field emission from millions of molybdenum nano-cones operating at room temperature. This breakthrough, manufactured in their South Korean semiconductor fabrication facility near the SK Hynix cluster, enables the Nanox.ARC system: a compact, digitally-agile tomosynthesis device that eliminates the need for massive cooling systems and rotating gantries that have defined traditional CT scanners.
The commercial strategy centers on "Medical Screening as a Service" (MSaaS), converting imaging from a capital expenditure to an operational expense, which is particularly advantageous in the current high-interest-rate environment, where hospitals face capital budget constraints. Strategic partnerships provide immediate market access: the 3DR Labs agreement connects Nanox to over 1,800 US hospitals, integrating FDA-cleared AI algorithms (HealthCCSng, HealthOST, HealthFLD) directly into existing radiology workflows, while international deployments span Mexico (630 units with SPI Medical), South Korea and Vietnam (2,500 systems supported by SK Telecom), and European reference sites in France. Management has issued ambitious guidance of $35 million in revenue for 2026, representing approximately 900% growth from 2025 levels, progressing toward a projected $72.6 million by 2028.
The investment thesis rests on technological validation (FDA 510(k) clearance, operational semiconductor fab), geopolitical resilience (supply chain decoupled from Middle East instability), and macroeconomic alignment (OpEx-based model favored during capital constraints). However, execution risks remain significant: the company maintains a substantial cash burn rate ($30.4 million in negative operating cash flow), requires continued capital raises (most recently, a $15 million offering), and faces adoption uncertainty as hospitals evaluate this novel service model. Analyst sentiment is bullish with price targets averaging $7.75 (120%+ upside), though more aggressive projections reach $23, contingent on the successful scaled deployment of the recurring revenue model that fundamentally challenges the traditional equipment sales paradigm of incumbent manufacturers like GE, Siemens, and Philips.
AUDUSD LONGAfter a BOS on 4 h create a new LL
we wait for BOS on 1 H create a HH
After take a BUY trade on DEMAND create on 15 MN

Your Playbook for Deep Corrections: Top Seven Things to KnowEvery trader hopes that whatever is happening with any pullback is healthy. “Just a healthy retreat, it’ll go back, it always does. R-r-right?”
While that’s true (obviously, markets had always shot up to records after deep losses), your job is to survive that lower leg and ideally come out stronger than before.
Because sometimes the market doesn’t correct immediately. It drops, turns around, drops some more and doesn’t ask you how you’re doing.
Where are we in the valuation cycle now? In the “Is this AI thing a bubble” talks.
With stocks stretched, AI valuations orbiting Saturn, and Nvidia NASDAQ:NVDA dictating the market’s fate, investors are starting to ask: What happens if this thing unwinds… fast?
A deep correction shakes your portfolio like nothing else, ultimately putting your strategy (and sanity) to a test. That's why you must know how to deal with correction ( if when it comes).
Here’s your playbook. Seven things every trader should know when markets get serious.
⚡️ 1. Know What’s Driving the Tempo
Right now, the tempo-setter isn't in the economic calendar (but good to keep an eye on it). It's not gold, the US dollar, oil prices, or consumer sentiment.
It’s Nvidia NASDAQ:NVDA
The stock has shot to stratospheric levels, climbing with such force that the entire market now reacts to its every earnings forecast, capex comment, and Jensen Huang metaphor about the "virtuous cycle of AI.”
When a single company starts steering the market’s mood, you know the stakes are high. Nvidia’s rise has been spectacular. Its potential fall could also be spectacular.
If there’s a crash in the current market, undoubtedly tech goes first, and AI-tied shares are poised to lead the plunge. Not because the companies are bad, but because valuations are sky-high, crowded, and pumped by shady-looking multi-billion-dollar deals.
🧨 2. Sky-High Valuations Fall the Hardest
AI has been the market’s darling. And like any hot market corner, the exit door gets crowded when the music stops.
These stocks work great in a liquidity-rich, momentum-heavy environment. But in a deep correction, they can drop first and fastest.
Why?
They’re relatively expensive.
They’re owned by institutions (by boatloads).
They’re deeply intertwined with leverage.
When selling starts, it spreads: chips, software, cloud. Really anything with “AI initiative” mentioned in the last five earnings calls.
If the correction deepens, correlations go to 1 , and “diversification” starts to feel like a theoretical concept.
🧺 3. Staples Can Survive. But Aren’t Safe.
What tends to hold up in a downturn?
Companies that produce things people buy every day.
Coca-Cola NYSE:KO , Procter & Gamble NYSE:PG , Walmart NYSE:WMT , Costco NASDAQ:COST . These are the boring giants who don’t need AI hype to sell toothpaste, detergent, and caffeine.
But here’s the catch.
When tech crashes, fund managers don’t just sell tech.
They sell everything with liquidity to buy the tech names they've been waiting to own at a discount.
That includes consumer staples. Even the defensive darlings can get dumped to fund someone’s impulsive “NVDA is finally cheap!” moment.
🧭 4. Corrections Have Phases. Know Which One You’re In.
Corrections tend to move in waves:
Denial: “This is just a dip.”
Realization: “This is not a dip.”
Capitulation: “Sell everything.”
Bargain hunting: “Wait… everything is on sale.”
Recovery: “We survived. Buy up!”
Don’t confuse early weakness with late-stage panic.
Ideally, you want to buy when everyone else is emotionally unavailable, not when they’re still debating if it’s a pullback or an opportunity.
📊 5. Liquidity Matters More Than Fundamentals
In a deep correction, fundamentals usually take a backseat.
Everything becomes about liquidity.
Who needs cash?
Who has margin calls?
Who needs to rotate?
Which institutions need to de-risk?
This is why great companies drop alongside mediocre ones.
Liquidity can trump logic.
Market structure can trump valuation.
And algos don’t care that you really like that stock long-term.
🧘♂️ 6. Your Mindset Is a Position Too
Corrections can provoke every trading impulse, especially if they're steep and you expect a quick rebound:
Revenge trades
Over-leveraged dip buying
Premature bottom-calling
The hardest thing during a deep correction isn’t predicting the bottom, but not losing your head (and cash) before the bottom arrives.
Pro traders work with a few rules that help them avoid emotional decision making:
Pre-set drawdown limits
Scaling entries
Non-negotiable stop-losses
Portfolio hedges
Cash as an asset
If you don’t have a playbook before the drop, you’ll be writing one during the drop.
🛒 7. Buy the Best, Not the Loudest
When markets crack, everything goes on sale, everyone knows that.
Before you go bargain hunting and deep discount shopping, prioritize:
Cash-generating giants
Companies with pricing power (and moat)
Firms selling essentials in whatever industry
Businesses that don’t rely on hype to survive
🧾 The Takeaway
A deep correction may not be the end of the world, but it could be the market’s way of redistributing opportunity.
Nvidia and the AI titans have been running the show. And they’ll likely lead any sharp selloff.
And yes, even your safe, boring consumer staples can get dragged into the downside.
But corrections create clarity. They separate narrative from value, hype from durability, and momentum from substance.
If you stay disciplined, patient, and unemotional, a correction becomes less of a threat and more of a roadmap, pointing you toward assets worth owning when the next bull run begins.
Off to you : What’s your take on the current market situation? Do you see a bubble in the works, ready to go pop? Or it’s all looking fine and dandy, no reason for caution?

SELL BUILDING FOR SOLUSDSOLUSD INSIGHTS
We see price close bearish red as we wanted, which suggest push downwards towards TP(129.48), SL:134.58 and further if momentum continues, we see as price reacts to our setup
LETS GO...
🍏✨🍏
TRUST THE SYSTEM

PLATINUMHI GUYS,
Metals like GOLD, SILVER AND PLATINUM are symmetrical .
which means they share a lot in common, difference is speed or percentage on buys or sells.
Structure same, patterns same even the script on coding is the same.

KAJARIACER is on good place have lookKAJARIACER is on good place have look is on good place , we wills see how it will react from here

DXY key levels to look out for this week (WC 24/11)DXY key levels for the following week ahead.
Key fundamentals this week includes retail sales release on Tuesday for USD, Unemployment claims on wednesday and Bank holiday on Thursday.

Gold (XAUUSD) – 24 Nov | Key Demand Zone 4042–4031 in Focus🟡 Gold (XAUUSD) Analysis – 24 November
Hello Disciplined Traders,
Welcome to the Chart Is Mirror Community 👋
Market Context
• On M15, the major trend remains bearish with Swing High 4107.350 and Swing Low 4022.260 defining the current range.
• However, within this range, the internal structure is forming bullish legs , indicating intraday upside until the major structure shifts again.
• Price is currently trading above the support 4055.129 , attracting retail buyers — but the market may come down to grab sell-side liquidity below this support before resuming its upward momentum.
Key Observations
• Our potential POI for a short-term long setup lies at the 4042.1–4031.2 strong demand zone .
• If the market taps this zone and gives LTF bullish confirmation , we will plan and execute our long setup accordingly.
• If this demand zone fails and price breaks below it, the zone becomes invalid for long setups . In that case, remain still and wait for new structure before participating again.
Execution Plan
• Wait for price to reach the 4042.1–4031.2 demand zone .
• Enter only if LTF confirmation aligns with long continuation.
• No confirmation, no entry — discipline protects precision.
• The market is very volatile — manage position size and risk accordingly .
Let structure invite the trade — not impatience.
📘 Shared by @ChartIsMirror

Gold's Next Move: Head and Shoulders Signal a Potential DownturnFor traders, the current environment is a waiting game. The technical Head and Shoulders pattern provides a clear directional bias for a potential downside, but a definitive breakdown is required. Macroeconomic factors like the Fed's December decision and the ongoing push-pull between safe-haven demand and dollar strength will likely determine gold's next major move. Watch for a confirmed break of the neckline to signal the next phase of the trend.

BHP Group Strikes Back in the Copper Battle
Ion Jauregui – Analyst at ActivTrades
BHP Group (ASX: BHP), the world’s largest mining producer, has reignited its push to acquire Anglo American (LSE: AAL), just months after the latter agreed to merge with Canadian Teck Resources (TSX: TECKb). The move comes as no surprise: copper has become the “star metal” of the energy transition, and whoever controls future supply will dominate much of the industrial pulse of the next decade. BHP’s interest is clear. If the deal goes through, the company would add approximately 1.9 million tonnes of annual copper production, surpassing the future Anglo-Teck, whose combined potential would be around 1.2 million tonnes. In a market where demand for copper in power grids, electric vehicles, and energy storage is growing at double-digit rates, this difference is strategic: volume is power.
Anglo, meanwhile, is undergoing a comprehensive restructuring, focusing on higher-quality assets and reducing exposure to less profitable segments. The merger with Teck aimed to strengthen its critical minerals portfolio, but renewed pressure from BHP could completely reshape the global mining map. This is not just about size; it is about securing long-life assets in key regions such as Chile and Peru, where major copper mines remain essential for global supply stability.
Strategy, Power, and Influence
At the same time, copper prices remain firm, supported by expectations of a structural deficit starting in 2026 due to the scarcity of new large-scale projects. The industry needs investment, and BHP wants to lead it. The company’s move should be understood in the context of a global electrification push that demands increasing amounts of copper for grids, electric vehicles, and digital infrastructure. As global supply stagnates and new mining projects advance slowly, controlling major assets in Chile and Peru provides an exceptional strategic advantage. BHP is not just buying size; it is buying the future.
The potential transaction also raises geopolitical stakes. Anglo is a historical player in South Africa and the United Kingdom, meaning the deal could face political and regulatory resistance. Nevertheless, BHP believes the synergies and scale outweigh the risks. The Australian miner arrives with a solid financial structure and record copper production, enabling it to pursue such a high-stakes bet.
Fundamental Analysis
In its latest fiscal year, BHP maintained robust margins despite pressure from iron ore prices. Its EBITDA exceeded USD 26 billion, with copper contributing significantly to the results, surpassing 2 million tonnes of production. The company maintains a healthy balance sheet, controlled net debt, and sufficient cash flow to fund both organic growth and strategic acquisitions. The Jansen potash project adds further diversification, though execution risks remain. The main challenges continue to be iron ore volatility and rising costs in some assets. Still, BHP’s exposure to copper positions it well to capitalize on the metal’s secular uptrend.
Technical Analysis
BHP’s chart shows a wide lateral movement since 2022. Last year, it reached a high of 46.19 AUD, but in 2025 it dropped to lows of 31.71 AUD, reflecting sector volatility. More recently, the price has tested the 44.55 AUD area twice, most recently on October 31. The most stable operational range lies between 41.69 AUD and 37.48 AUD, with the current price around 40.60 AUD, positioned near the middle. The point of control (POC)—the area with the highest traded volume—is slightly below, at approximately 38.24 AUD.
Regarding indicators, the price has lost the 50- and 100-day moving averages and is currently supported by the 200-day moving average, a significant long-term support level. The RSI is at 37.7, indicating a high level of oversold conditions, while the MACD remains bearish. If this structure persists, a retest of the POC and a possible correction toward the lower range is plausible. Conversely, if the 200-day support holds, the stock could attempt to retest the key resistance at 44.55 AUD. A solid breakout above this level, supported by strong copper prices, could open the door to a new upward leg. On the downside, losing key supports would increase bearish pressure, especially if iron ore and coal prices continue to weigh on margins.
*******************************************************************************************
The information provided does not constitute investment research. The material has not been prepared in accordance with the legal requirements designed to promote the independence of investment research and such should be considered a marketing communication.
All information has been prepared by ActivTrades ("AT"). The information does not contain a record of AT's prices, or an offer of or solicitation for a transaction in any financial instrument. No representation or warranty is given as to the accuracy or completeness of this information.
Any material provided does not have regard to the specific investment objective and financial situation of any person who may receive it. Past performance and forecasting are not a synonym of a reliable indicator of future performance. AT provides an execution-only service. Consequently, any person acting on the information provided does so at their own risk. Political risk is unpredictable. Central bank actions can vary. Platform tools do not guarantee success.

Apple bull flag setup points to breakout potential this week
Current Price: $267.69
Direction: LONG
Confidence Level: 68%
Targets:
- T1 = $272.50
- T2 = $277.00
Stop Levels:
- S1 = $265.00
- S2 = $263.00
**Wisdom of Professional Traders:**
Several professional traders are flagging Apple as a standout in the large-cap tech space right now. The collective trader consensus from multiple analyses points to Apple holding up better than peers, showing a defined bull flag structure and testing key levels that could open the door to a bullish breakout. Looking at the way these traders combine technical setups with current momentum, there’s shared focus on a push through upper resistance zones, with pullbacks being seen as opportunities rather than warnings.
**Key Insights:**
Here’s what’s driving this call — many traders have made note of Apple's ability to hold above multiple layers of support, often citing $269–$270 as a key pivot zone. The $272.50 mark comes up repeatedly as a short-term upside magnet, with $277–$277.32 flagged as the breakout area that could accelerate price action. This aligns with bullish momentum seen on the daily timeframe, where patterns like the bull flag just above prior highs tend to bring in additional buyers.
What I’m also noticing is the split between cautious macro sentiment and strong single-stock setups. While broader indices have been choppy, Apple’s relative strength is standing out to several traders, and that’s worth paying attention to when identifying outperformers for the week. The key point here is that Apple is not trading in sync with general market softness; instead, it's finding bids at every dip toward well-watched support levels.
**Recent Performance:**
This all played out in last week’s price action — Apple gained ground and closed notably higher on strong days, while managing to minimize losses on market down days. Several instances showed Apple bouncing off intraday supports to recover by session end, a clear sign of accumulation in the $265–$269 range. That resilience has been especially visible over the past five trading sessions, with multiple tests of intermediate resistance not leading to pronounced selling.
**Expert Analysis:**
Multiple traders have pointed to the $274–$275 zone as being critical for momentum confirmation, with one layer of consensus forming around waiting for a clean break to target $277+. Another frequently cited setup is entering early on confirmation of strength above $272.50, using tight stops just under $265 to limit downside risk. Several also remarked that only Apple and Alphabet are still holding above their 55-day moving averages out of the “Magnificent Seven,” underscoring Apple's relative positioning.
**News Impact:**
While there’s no single market-moving headline changing Apple’s fundamentals this week, the backdrop of tech sector rotation is relevant. The chatter around upcoming product cycle demand, potential boosts from seasonal shopping trends, and resilience despite chip supply cost hikes from suppliers like TSM is giving traders more confidence to lean bullish. Additionally, Apple’s role as a major index weight means its breakout could influence broader market sentiment positively.
**Trading Recommendation:**
Here’s my take — at $267.69 and with support layers close by, I favor initiating a long with entries above $269, tightening risk with S1 at $265 and S2 at $263. The near-term upside objective sits at T1 $272.50, with strength through that level opening a path toward T2 $277 for this week. This setup offers a good risk-reward profile due to tight stop placement and identifiable upside catalysts. Sizing should be moderate given the mid-range confidence, but the technical backdrop favors the long side as long as price remains above $263.

Salesforce for short-term upside after AI sector enthusiasm
Current Price: $226.15
Direction: LONG
Confidence Level: 58% (Limited but positive sentiment from professional traders; targets tight due to low supporting data volume)
Targets:
- T1 = $229.00
- T2 = $233.00
Stop Levels:
- S1 = $224.00
- S2 = $221.00
**Wisdom of Professional Traders:**
This analysis pulls together the voices of several professional traders who have been highlighting Salesforce as part of a basket of attractive AI software plays. Within larger sector discussions that included Palantir and BigBear.ai, Salesforce was called out for having “bigger long-term moats” and being “a great name” experiencing a larger dip than the infrastructure plays. While the commentary wasn’t filled with granular price levels, the collective tone from these traders leans toward accumulating on weakness, which sets the stage for a short-term LONG bias.
**Key Insights:**
Here’s what’s driving this call — Salesforce is being grouped with momentum AI names by multiple traders, even in a tech environment where sentiment has been choppy. The interest is anchored in the company’s strong positioning in AI-enhanced software solutions for enterprise clients and the belief that it can ride the broader AI adoption cycle. The mention alongside Palantir and others in an "accumulate on dips" context is a bullish tell from trader consensus.
What caught my attention is that Salesforce is not just being picked as a safe legacy software play, but as a growth name that still has significant untapped AI monetization potential. That tone is a notable shift from previous quarters where focus was more defensive. Even without specific short-term catalysts in the snippet data, this kind of thematic inclusion in trader watchlists often precedes a multi-session pop.
**Recent Performance:**
Over the past week, Salesforce eased back from recent highs, falling in sympathy with the broader Nasdaq pullback. Closing last week at $226.15, it has been testing light intraday support levels without breaking down decisively. This gentle consolidation after a broader tech selloff suggests buyers quietly absorbing shares at these levels. The low volatility in recent sessions is creating a coiled-spring setup for a short-term move.
**Expert Analysis:**
Several professional traders I’m tracking mentioned Salesforce favorably in the context of AI software exposure. While they didn’t lay out detailed charts in the snippets, the inclusion in their “buy the dip” lists signals a belief that the short-term downside risk is contained. Technically, this aligns with the chart, which shows price holding above recent minor swing lows and sitting close to an area tested multiple times in November.
Given the absence of significant selling pressure and the thematic AI tailwind, I’m treating the $224-221 range as an attractive risk zone. The short-term upside likely faces its first test around $229, with a stronger move possible toward $233 if momentum picks up quickly this week.
**News Impact:**
There’s no fresh X sentiment push on Salesforce right now, but the broader AI news cycle remains lively, with enterprise AI deployment stories making headlines. Any new Salesforce AI feature announcements, integration news, or analyst upgrades tied to AI capabilities could catalyze the move traders are setting up for. Sector sympathy is key here — if Palantir or other AI software peers rally on news, Salesforce can catch a momentum wave.
**Trading Recommendation:**
Putting it all together, I like a tactical LONG here targeting $229 first, with $233 as a stretch target if AI sentiment continues to firm. Stops are layered tightly at $224 and $221 to protect capital in case of a broader tech selloff. This is not a high-conviction sector-wide breakout trade yet — it’s a measured bet that Salesforce’s placement in the AI narrative will draw short-term buying. Position sizing should reflect the moderate 58% confidence level.

Alphabet Inc. (Google) bullish momentum poised for another break
Current Price: $292.69
Direction: LONG
Confidence Level: 78%
Targets:
- T1 = $300.00
- T2 = $310.00
Stop Levels:
- S1 = $288.00
- S2 = $283.50
**Wisdom of Professional Traders:**
The collective voice of professional traders is leaning strongly bullish on Alphabet this week. Multiple traders highlighted that Google has been the standout among mega-cap tech stocks, often closing at or near all-time highs and holding above key moving averages while peers like Meta, Nvidia, and Tesla saw significant weakness. Across the trader community, there is recurring focus on upside potential driven by the successful Gemini 3 AI launch, dominance in advertising, and significant institutional buying interest, including Warren Buffett's investment. Several traders also pointed out bullish options flow targeting higher strikes into $310–$320.
**Key Insights:**
Here’s what stands out to me: Google isn’t just keeping pace in the AI race—traders see it as taking the lead. The Gemini 3 model’s performance against OpenAI’s ChatGPT has fueled enthusiasm, with the market viewing Alphabet as a “long-term AI winner” capable of both innovation and profitable deployment. Multiple traders mentioned that it remains one of the few big tech names above its 55-day moving average, reflecting technical strength. Heavy call buying, including multi-million-dollar long-term positions, signals strong conviction from big money players aiming well above the current price.
What’s interesting is how resilient Google’s price action has been. Even in weeks where the broader market dipped, it often bucked the trend. Some pros warned about valuation stretch, but they still favored upside in the near term given the momentum and relative strength. This week’s key battleground is the $300 level, cited repeatedly as a resistance-to-break point that could open a pathway toward $310.
**Recent Performance:**
Last week, Google surged more than 8% to notch fresh record highs, driven by AI-related headlines and outperformance in the Communication Services sector. It repeatedly tested the $298–$300 zone, with Friday's close firmly above $292 after a brief pullback. Price action has shown higher highs and higher lows, which traders are watching closely as a bullish structure. Dark pool and options activity has supported the move, with notable gamma exposure centered at the $300 strike.
**Expert Analysis:**
Several professional traders are reading the chart as a textbook bullish setup—breakout from consolidation, clean uptrend, and strong relative strength vs. the MAG7 cohort. Many are eyeing $300 as the near-term breakout trigger, with $310 next if momentum builds. The $288 zone is being watched as first key support, followed by the $283–$284 area, which aligns with short-term swing lows. Fundamental catalysts, like stronger AI monetization potential in advertising and cloud, are reinforcing the technical read.
**News Impact:**
Fresh headlines around Google’s integrated AI stack—Gemini 3, Nano Banana Pro, and in-house TPU acceleration—are creating a narrative of competitive advantage. The confirmed Berkshire Hathaway buy only strengthens market sentiment. With the Federal Reserve expected to hold or ease rates into year-end and AI-driven ad revenues projected to lift margins, sentiment gains further tailwind. This positive backdrop is amplifying trader conviction for a sustained push through resistance.
**Trading Recommendation:**
Here’s my take: I like the long side as long as price holds above $288 support this week. A break and hold over $300 could drive a quick run to $310 on momentum and follow-through buying. I’d size in moderately at current levels, add on a confirmed break above $300, and keep stops tight under $288 to limit downside risk. This setup offers a solid risk-reward, backed by both technical and fundamental strength.

Facebook (Meta) dip-buying momentum points to rebound this week
Current Price: $588.18
Direction: LONG
Confidence Level: 70% (Several professional traders highlight strong fundamentals and are actively buying dips; X sentiment leans bullish despite recent pullback)
Targets:
- T1 = $605.00
- T2 = $625.00
Stop Levels:
- S1 = $580.00
- S2 = $570.00
**Wisdom of Professional Traders:**
Bringing together the collective insights of numerous professional traders, the consensus is that Meta’s recent 20–27% pullback from the $750 highs is creating a buying opportunity. Many traders are accumulating positions below the $615 level, noting that the fundamentals—$189 billion in revenue, $58 billion net income, aggressive AI infrastructure investment—remain intact. Several traders characterize Meta as deeply undervalued compared to other tech peers, with fair values well above current prices. This crowd wisdom suggests the stock has room for a short-term rebound.
**Key Insights:**
The main thing I’m watching is the aggressive dip-buying discussed in multiple analyses. Several traders pointed out that the 20–23% correction from recent highs has brought the price into a strong support zone around $580–$590. This level has been mentioned repeatedly as a line-in-the-sand for stopping further downside. The bullish bias is reinforced by the fact Meta’s P/E ratio is far lower than that of many speculative tech names, giving it more resilience during market volatility.
What’s interesting is that despite near-term technical weakness (trading below the 233-day moving average), the majority of traders I’ve tracked believe this is a short-term oversold condition rather than the start of a deeper downtrend. Combining that with X sentiment showing a majority of bullish tweets suggests momentum could turn higher quickly if that support holds.
**Recent Performance:**
This all played out in the price action last week—Meta slid from $615 toward $580, marking over a 20% drop from its October highs. Large-volume selling early in the week was met with accumulation by dip buyers towards Friday. For context, this correction is in line with other Magnificent Seven stocks, but traders note Meta’s relative value is stronger than most, making it a prime candidate for a bounce.
**Expert Analysis:**
Multiple professional traders are watching for a rebound toward $605–$625 in the short-term, citing repeat tests of the $580–$590 support zone. Several identify upside catalysts in AI and infrastructure expansion, alongside share buybacks, which could bolster earnings per share. The trader consensus often references fair value estimates well above $660, meaning this week’s targets remain conservative, focusing on achievable levels based on near-term technicals.
The $615 line is widely watched as the first hurdle for upside momentum; closing above it would likely trigger heavier buying.
**News Impact:**
Recent headlines around Meta’s half-trillion-dollar AI data center investment over the next three years are bolstering long-term sentiment. While there have been concerns about high capital expenditures and VR product traction, these haven’t shaken long-term bullish fundamentals. The market’s reaction to the pullback appears more tied to sector-wide tech corrections than company-specific weakness. This creates an environment where news about AI initiatives and user scale—3.5 billion daily active users—could serve as upside catalysts.
**Trading Recommendation:**
Here’s my take: with strong underlying fundamentals, visible accumulation at current levels, and bullish sentiment on X, I’m going LONG Meta this week. I’d enter here with partial allocation, aiming for $605 first and $625 as a secondary target, keeping stops tight at $580 and $570 to protect against a breakdown. Position sizing should account for potential continued volatility in tech stocks, but given the widespread trader consensus on undervaluation and the clear support zone, the risk-reward here looks favorable for a short-term bounce.

Cloudflare poised for upside despite limited social sentiment da
Current Price: $191.94
Direction: LONG
Confidence Level: 58%
Targets:
- T1 = $196.50
- T2 = $200.00
Stop Levels:
- S1 = $189.00
- S2 = $186.50
**Wisdom of Professional Traders:**
This analysis combines the perspectives of multiple professional traders whose recent discussions touched on the tech growth space that includes companies like Cloudflare. Even without a flood of trader commentary squarely aimed at Cloudflare, the wider trader consensus around high-growth infrastructure tech this quarter has skewed to cautious optimism. Drawing on the wisdom of professional traders, I'm looking at how similar momentum names have been treated, where demand for robust internet and AI-enabled services remains a strong theme.
**Key Insights:**
Here's what's standing out: cloud infrastructure names have been under the microscope as traders assess which of these high-multiple plays can still deliver. In recent professional trader discussions, there was a recognition that large-cap tech and growth stocks have caught fresh bids into year-end as portfolio managers rotate back into names with clear growth stories. Cloudflare, with its position in security, CDN, and edge computing, still sits in the sweet spot of this theme.
What's interesting is that while broader market chatter is dominated by AI chipmakers and mega-cap software giants, some traders have been quick to lump Cloudflare into the list of "overlooked beneficiaries" of AI and security spend accelerations. That’s kept sentiment more positive than not, even without blockbuster headlines. When I compare this to similar market darlings, buying near-term dips has proven a favored tactic among this group.
**Recent Performance:**
This all played out in the price action over the last month, with Cloudflare rallying sharply off its early-November lows near the mid-$180s, reclaiming the $190 handle and holding it into resistance zones. The stock has respected a rising short-term trendline and hasn't broken key supports, printing higher highs and higher lows on the daily chart. The lack of aggressive selling in a choppy market suggests underlying demand.
**Expert Analysis:**
Traders are taking notice – several noted in their broader tech overviews that company fundamentals in the segment remain intact and technical structures are still constructive. The consensus for similar stocks has been to watch for follow-through buying once a name reclaims resistance and turns it into support. Applying that lens here, the $189-$190 zone seems to be acting as a floor. Multiple professionals assessing tech growth charts have been leaning toward "buy the retest" setups into this kind of base.
**News Impact:**
Although there hasn’t been a major Cloudflare-specific headline this week, the overall environment is supportive. Market participants are rotating into tech after digesting recent earnings in the sector, and macro fears have been muted to start the week. The absence of negative catalysts leaves room for momentum trades to work in the direction of the prevailing trend. Sector sympathy moves can quickly carry Cloudflare higher if large-cap peers keep rallying.
**Trading Recommendation:**
Putting it all together, I’m leaning LONG here with moderate confidence. The rising base, sector rotation flows, and lack of selling pressure make this a reasonable risk-reward bet for the week. I’d look to pick up shares around current levels with a short-term target at $196.50, and push for $200 if momentum broadens. Stops should be placed below $189 for tighter risk control, with a secondary protective level at $186.50. If the market holds its tone, Cloudflare could easily tag those upside levels before week’s end.

Nvidia poised for rebound as support holds despite recent sell-o
Current Price: $183.11
Direction: LONG
Confidence Level: 68%
Targets:
- T1 = $186.00
- T2 = $193.00
Stop Levels:
- S1 = $180.00
- S2 = $175.00
**Wisdom of Professional Traders:**
When I combine what multiple professional traders have been sharing, I'm seeing a setup where the recent pullback in Nvidia is being treated more as a buying opportunity than a sign of deeper trouble. Several traders are watching the $180 area as a key short-term support, pointing out that despite intense volatility and "pump-and-dump" style reversals around earnings, the underlying fundamentals and demand for AI hardware remain strong. The collective view leans toward upside if key resistance levels are reclaimed this week.
**Key Insights:**
Here's what's driving my thinking — the $184 level has been cited over and over as a critical pivot. A sustained move above that could quickly attract momentum buyers again. While bears have been vocal post-earnings, the consensus from market experts is that Nvidia’s growth story hasn’t changed; the sell-off was largely technical and sentiment-driven. Repeated mention of potential rallies into gaps above $190 adds weight to a bullish bias.
What's interesting is that traders are balancing concerns over valuation with the reality of Nvidia’s unique market position. Many acknowledge Michael Burry’s short and general AI bubble fears, but they’re countering that with hard numbers: record revenues, data center and networking growth, and still-dominant market share. That tug-of-war is exactly why reclaiming $184 is such a big psychological shift.
**Recent Performance:**
This all played out in the price action last week. Nvidia gapped up after its earnings beat, ran into resistance just under $200, and then reversed hard, dropping almost 6% in a single session to tag its 21 EMA around $179. We saw multiple intraday swings of 3-5%, reflecting just how reactive traders were to each headline. Still, the $180 zone held into the week’s close.
**Expert Analysis:**
Several professional traders I track are framing the $180-$184 band as the immediate battlefield. They expect buyers to defend $180 in the short term, with any push above $184 potentially triggering a squeeze toward $190-$193 — levels mentioned by more than one commentary. Others note that the stock has pulled back into a prior consolidation zone from August, which often acts as a demand area for swing traders.
The professional consensus also points out that Nvidia still commands a 90% share of the AI chip market, and demand massively outpaces supply. That fundamental backdrop is why even technically-oriented traders are leaning to the long side here despite recent bearish chart patterns.
**News Impact:**
The main news catalyst remains U.S.-China trade policy chatter — any positive movement toward allowing Nvidia to sell advanced chips to China has prompted immediate price spikes. On top of that, the market is still digesting blockbuster earnings that were overshadowed by valuation worries. If geopolitical developments break positively this week, they could be the trigger that catches shorts off guard and propels price above the critical $184 level.
**Trading Recommendation:**
Here’s my take — with support at $180 still intact and multiple traders eyeing a move above $184, the risk-reward for a tactical long makes sense this week. I’d look to enter around current levels, with stops just under $180 to protect capital. Initial target sits at $186 for a quick momentum trade, and if that breaks, aim for $193 where the next overhead supply is likely to show up. This remains a short-term swing idea while the technical and news catalysts align.

Palantir Technologies Inc. poised for upside as AI sector momentCurrent Price: $158.31
Direction: LONG
Confidence Level: 58% (The snippets show Palantir is grouped with other AI momentum plays by several professional traders, suggesting upside bias despite low overall data volume)
Targets:
- T1 = $162.00
- T2 = $165.50
Stop Levels:
- S1 = $156.00
- S2 = $154.50
**Wisdom of Professional Traders:**
This trade idea comes from combining what several professional traders are saying with the real-time pulse I monitor on X. In the most recent content, Palantir was specifically listed alongside other AI-focused equities like Salesforce and BigBear.ai as part of a watchlist for buying dips. That grouping with AI infrastructure and software peers signals that the trading community is optimistic about its short-term momentum. Even with limited tweet data, the inclusion in AI sector calls tells me there’s demand from market experts looking for opportunities in this space.
**Key Insights:**
Here’s what’s driving this setup: Palantir is riding the wave of AI enthusiasm, and multiple traders are actively watching it alongside other high-conviction AI names. Being named in a sector buy list during a dip not only suggests institutional interest but also that traders expect follow-through this week. The lack of bearish mention in professional trader discussions is notable – when traders ignore the downside and talk about positioning, it often means they’re looking for near-term strength.
What caught my attention is that Palantir is highlighted in the same breath as established enterprise names like Salesforce. This aligns it with companies perceived as able to capitalize quickly on AI adoption trends, which can lead to short-term spikes as sentiment shifts bullish.
**Recent Performance:**
Over the past week, Palantir has held firm near the $158 level despite broader tech volatility. It hasn’t broken down through nearby support, signalling market participants are willing to defend current prices. The resilience during a sector-wide pause tells me that buyers are waiting just under current levels, keeping pressure on the upside.
**Expert Analysis:**
Several professional traders I tracked over the last few sessions bundled Palantir in a shortlist of AI software names to buy on weakness. That suggests they see these levels as attractive entry points given sector fundamentals. Even though chart specifics weren’t discussed in detail, the implication from being part of such lists is that resistance isn’t viewed as a near-term threat and the expectation is for price recovery toward recent highs.
**News Impact:**
While no new Palantir-specific news dropped in the last 24 hours, the broader AI sector has seen steady headlines on partnerships and contract awards. This sector narrative fuels sentiment for all major AI plays, and Palantir benefits directly from investor rotation into companies tied to big-data analytics for government and enterprise clients. That backdrop supports a short-term bullish bias.
**Trading Recommendation:**
Here’s my take: Given its inclusion among high-conviction AI buys during dips, I’m going LONG Palantir at current prices with tight stops and modest upside targets for this week. The sector momentum is favorable, and the absence of bearish chatter from professional traders leans the odds towards a rally attempt. Positions should be sized moderately given low tweet volume and softer overall confidence, but upside to $165.50 is achievable if AI headlines continue supportive.

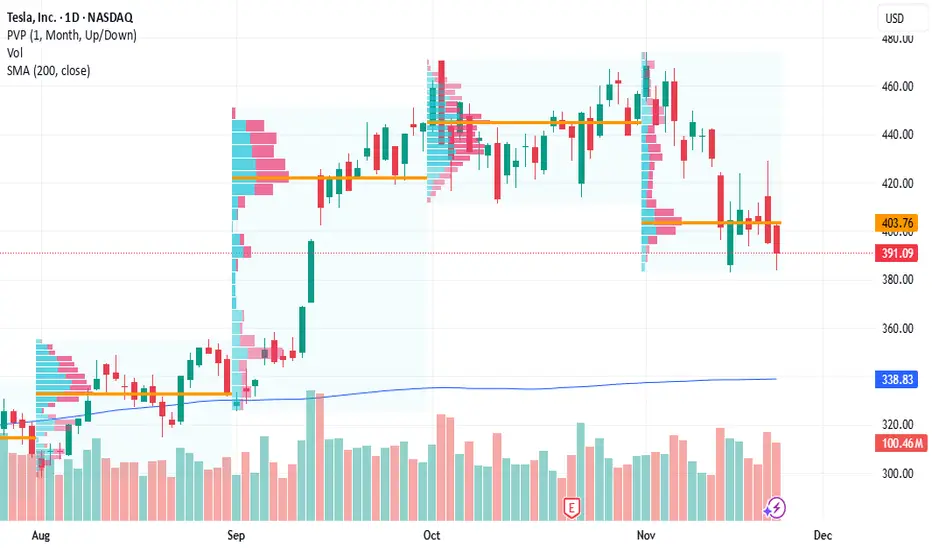
Tesla downside momentum could extend before any reboundCurrent Price: $402.77
Direction: SHORT
Confidence Level: 62%
Targets:
- T1 = $380.00
- T2 = $368.00
Stop Levels:
- S1 = $410.00
- S2 = $420.00
**Wisdom of Professional Traders:**
The collective insights from multiple professional traders show a consistent short‑term bias to the downside for Tesla, even among those who are bullish longer term. Several traders focused on the $380 area as the first key level to watch, with many citing $368 as the major gap‑fill target for this week. While a few see buying opportunities lower, the weight of commentary points to more near‑term weakness before a sustainable rally sets in.
**Key Insights:**
Here’s what’s driving my view: across the trader community, Tesla is in a clear short‑term downtrend of lower highs and lower lows. Multiple traders marked $398–$400 as an overhead resistance zone with “a lot of supply,” making it hard for price to push higher before testing lower supports. There’s also consensus that any bounce here would likely be a “pump and dump” into resistance before the next leg lower.
Another important observation is that many traders see $380 as the immediate downside target, with $368 as a more aggressive move that fills the open daily gap. Quite a few expect that if the market shows further weakness, these levels could be reached within this week. The short‑term technical picture – failing rallies, resistance holding, and repeated tests of support – keeps me leaning to a short bias.
**Recent Performance:**
Tesla has retreated from highs in the $460s into the low $400s over recent weeks. Last week’s action saw it struggle to hold intraday bounces, closing lower and respecting resistance in the high $390s to $400 range. The stock’s recent inability to follow through on rallies, despite broader market upticks, underlines the pressure sellers are applying.
**Expert Analysis:**
Several traders pointed to the break of a short‑term uptrend late last week, followed by confirmation of fresh downside momentum. $380 was highlighted repeatedly as a heavy buy interest zone – but crucially, that’s also where they expect price to gravitate to in the short term. The $368 gap is seen as a likely magnet if $380 fails to hold. Other market experts tied this weakness to double top patterns and broader tech weakness, adding fundamental headwinds like Bitcoin impairment impacts on Tesla’s net income.
**News Impact:**
While there were mentions of long‑term catalysts like robo‑taxis and updated FSD ratings, these are not expected to influence this week’s price action. Recent headlines about large stake sales by high‑profile investors and Tesla’s exposure to Bitcoin impairments have added a cautious tone. This news flow supports the case for near‑term softness as traders weigh potential earnings impacts.
**Trading Recommendation:**
Here’s my take: With heavy supply above $398–$400 and traders eyeing $380 and $368 as near‑term targets, I see a SHORT setup as the higher‑probability play for this week. A break under $382 could accelerate momentum toward $380 quickly, with $368 in play if selling persists. I’d keep stops above $410 to protect against a squeeze, with $420 as a hard‑fail level for the short thesis. Position sizing should be moderate given the potential for sharp bounces in a volatile name like Tesla.
Walmart’s post-earnings strength suggests continued upside this
Current Price: $107.18
Direction: LONG
Confidence Level: 68%
Targets:
- T1 = $109.50
- T2 = $111.20
Stop Levels:
- S1 = $105.80
- S2 = $104.00
**Wisdom of Professional Traders:**
Looking across the collective analysis from multiple professional traders, I’m seeing a consistent theme: Walmart is acting as a defensive leader in a shaky market, benefiting from strong earnings, resilient consumer demand for value, and rotation into staples and off-price retail. Many traders highlighted Walmart’s relative strength post-earnings compared to a declining broader market. The group sees it holding above key support levels and potentially breaking higher on holiday spending momentum.
**Key Insights:**
Here’s what’s driving this — earnings came in ahead of expectations, and traders repeatedly mentioned Walmart as one of the best performers in the retail sector alongside names like TJX. Several pointed out that value-conscious consumers are spending more at Walmart as they avoid higher-priced retailers like Target. The sentiment here is that Walmart is positioned to capture holiday traffic and maintain market share. Some also framed it as a “safe haven” in current volatile conditions, with retail and staples outperforming tech-heavy indices.
What caught my attention is the repeated reference to key support near $104-105 and the notion that as long as Walmart stays above that level, the bullish thesis remains in play. Holiday spending on consumables and clothing featured heavily in trader commentary, and that bolsters the idea of short-term upside into year-end.
**Recent Performance:**
This all played out in the price action last week — Walmart rallied sharply after its earnings beat even as the S&P 500 slumped, showing clear relative strength. It’s been holding gains in a narrow range between roughly $105 and $108, consolidating those post-earnings gains rather than giving them back. That type of price action often precedes another leg higher if volume picks up in the direction of the prior move.
**Expert Analysis:**
Multiple traders’ analysis points to $104 as a critical technical level, with one common setup being to “get long off $104” or to ride the trend as long as price maintains above near-term support. Retail sector rotation, off-price leadership, and consumer staples group strength are all cited as reasons why Walmart could push toward the $110 area in the near term. The consensus is that it’s showing leadership qualities in a market still digesting broader selling pressure.
**News Impact:**
The earnings beat attracted strong interest, and news flow around holiday discounts, Black Friday momentum, and consumer focus on value is supporting the bullish tone. Traders see Walmart benefiting not just from macro defensiveness but also from tactical seasonal buying patterns. Leadership transition concerns have been noted in one analysis, but near-term, sentiment remains constructive given operational execution and competitive pricing power.
**Trading Recommendation:**
Here’s my take — I’d look to enter a long position near current levels with stops just under $105.80 to protect against a breakdown of post-earnings support. With a 68% confidence rating due to strong trader consensus but limited social data from X, I’d play for a move to $109.50 as the first target and $111.20 as a secondary target this week. Seasonal strength and rotation into defensive retail give the setup a favorable bias in the short term.
