Weak CNY inflation can put a little downward pressure on the AUDAUD/JPY short position, and a tough trading morning
Beyond Technical Analysis

BITCOIN : (67.200 Buy Stop)Bitcoin-(67.200) buy stop this is a scalp trade and also make sure to trial all stops, keep your trading simple and remember that the trend is your friend , no need to complicate your charts , all you need is the direction and apply technicals accordingly

GOLD : (Piercing Through 5099.506)Gold scalp trade (5099.506) and above can enter a nice quick scalp trade towards the upside, huge potential to continue with its trend, make sure to trial all stops and make sure to take partials, remember to keep all trading simple and follow instructions carefully

It would be quite nice if this happens after the NFP releaseStop is just 16 pips
If price takes out this zone, I'll be expecting price to use the poi lower to buy.

USD/MXN with the possibility of buying at the previous weekly loWe have an excellent daily bearish structure, which is an accumulation reaching the indicated price for buying; the price is expected to close in the same zone as the Asian close.


G O L D : (Trade Update 5078.496)Gold has held on very well giving us a nice spike towards the upside crossing (5078.496) this would be a great time to close partials as much as possible probably close (80% leave 20%) and adjust your stop loss to the entry

Is alt season closer then we thinkAs you can see the monthly cross over is kicking in on the mac d indicator while stochastic rsi and rsi indicator approaching the 50. It comes to say its a good time to accumulate and hold. Once break the decending channel then off we go. Is history repeating or rhyming again? Let's wait and see.

Trading balanceThe price of the asset has rebounded from the balance zone. With the prospect of growth into the resistance zone.
@FXOpen

Xauusd NFP news USDJPY Beauty Of Bigger Time Frame Most traders wait for candles.
Professionals wait for levels.
USDJPY was never “random.”
The daily structure was already bearish.
The retracement into the green zone wasn’t hope — it was liquidity engineering.
Trendline stops were obvious.
And obvious liquidity never survives.
Market took them.
Then respected higher timeframe supply — exactly where it was supposed to.
I don’t chase price.
I let price come to my map.
If it reaches my level and confirms — I execute.
If it doesn’t… it was never my trade.
I’m not attached to outcomes.
I’m attached to process.
Patience is not waiting.
Patience is discipline while temptation screams.
When structure aligns with your plan, execution feels effortless.
No fear. No rush. No revenge.
The market doesn’t reward excitement.
It rewards precision.
And precision belongs to the prepared.
follow me for more insights

BTC / SHORT / 10.02.26Entry reasons:
1-hour liquidity sweep within the 1-hour bearish imbalance
Inversion 15-min bearish imbalance and 1-hour absorption
30% retracement of the bearish impulse

EURGBP SHORT Date: February 11, 2026
Asset: EUR/GBP (Euro / British Pound)
Bias: Bearish (Short)
Executive Summary
The EUR/GBP currency pair is exhibiting a high-probability shorting opportunity based on a multi-timeframe alignment of market structure, Fibonacci retracement, and momentum indicators. Current price action as of February 2026 confirms that sellers remain in control, with the pair trading below key pivot levels and responding to technical resistance zones.
Technical Analysis Breakdown
1. Market Structure: H4 Bearish Continuation
The H4 (4-Hour) timeframe serves as the primary trend indicator for this setup. The market has recently completed a Break of Structure (BOS) to the downside, invalidating previous minor support levels and confirming a sequence of lower highs and lower lows.
• Significance: A BOS in a downtrend indicates that the "path of least resistance" remains downward. This structural shift suggests that any upward movement is merely a corrective phase (retracement) rather than a trend reversal.
2. Fibonacci Retracement: Premium Reversal Zone
The recent corrective rally has pulled back into the 75%–84% Fibonacci retracement level. In institutional trading, this is often referred to as a "Deep Premium" zone.
• Analysis: Price reached this level and encountered significant selling pressure, forming what appears to be a "rejection wick" or a slowing of bullish momentum. This zone aligns with previous H4 supply areas, providing the confluence needed to justify a short entry.
• Key Level: Traders are closely watching the 0.8720 – 0.8730 resistance cluster for sustained rejection.
3. Execution Signal: H1 13/21 EMA Crossover
To refine the entry, the H1 (1-Hour) timeframe provides the tactical trigger. We are monitoring the 13-period Exponential Moving Average (EMA) crossing below the 21-period EMA.
• The Signal: This "Death Cross" on the intraday chart confirms that short-term momentum has shifted back in favor of the primary H4 downtrend.
• Current Status: The crossover acts as a final filter, ensuring we are not "catching a falling knife" but rather entering as the momentum confirms the reversal from the Fibonacci premium zone.

Can Neutral Atoms Make Quantum Computing Profitable?Infleqtion is emerging as a formidable player in the quantum technology race, uniquely positioned at the intersection of computing and sensing. The company's forthcoming public listing through a merger with Churchill Capital Corp X at a $1.8 billion valuation marks a watershed moment, as it will become the first publicly traded pure-play neutral-atom quantum specialist under ticker INFQ on the NYSE. With over $540 million in gross proceeds expected from the transaction, Infleqtion is capitalizing on its dual-domain strategy while competitors remain locked into single-focus approaches. The neutral-atom platform offers inherent scalability advantages, using identical atoms found in nature rather than fabricated chips subject to trade restrictions and high production costs.
The company's strategic positioning within the AUKUS security alliance (US, UK, Australia) provides critical geopolitical advantages in an era of intensifying quantum competition between the United States and China. Infleqtion's sovereign capabilities across three nations allow it to navigate complex export controls while participating in defense-critical projects like quantum timing systems for the Royal Navy's submarines and NASA's space-based quantum gravity sensor launching in 2030. These government partnerships, including a $6.2 million ARPA-E contract for grid optimization and a $2 million Army contract for AI-powered navigation, provide non-dilutive funding and real-world validation that most pure-play computing firms lack. The company's quantum timing products generate immediate revenue, creating a vital financial bridge while its computing platform scales toward the ambitious target of 1,000 logical qubits by 2030.
Despite significant technical achievements, including 12 logical qubits with error detection and a 1,600-physical-qubit array, Infleqtion faces substantial risks. Churchill X reports a concerning current ratio of 0.04, indicating liquidity pressures that warrant close monitoring post-merger. The company must compete against tech giants like Google, IBM, and Microsoft with vastly deeper pockets while managing burn rates carefully. However, Infleqtion's 230-patent portfolio, partnerships with NVIDIA (NVQLink real-time quantum-GPU integration) and Safran (global distribution for timing products), and seasoned executive team, including former Intel and Amazon veterans, suggest the company is positioning for long-term dominance. As quantum technology transitions from laboratory demonstrations to industrial deployments, Infleqtion's practical, revenue-generating approach combined with cutting-edge research may prove to be the formula for sustainable success in the quantum era.

GOLD Today NFPHi, I’m Maicol, an Italian trader.
I study Gold since 2019.
I need your support.
Leave a like and follow me.
It’s a small thing for you, but important for my work.
Please read the description to understand the trading plan.
Don’t focus only on the chart. Thanks.
Live today at 14:00 CET (Rome time).
🌞 GOOD MORNING EVERYONE 🌞
Yesterday Gold closed the daily candle bearish, but it is still holding above our key level.
For now, I remain bullish until we see a daily close below 5000.
A confirmed daily repositioning below that level would change the bias.
What to watch today?
NFP at 14:30.
After NFP, monitor:
Yesterday’s daily lows
The dynamic liquidity zone
A potential trap around the gap / the area marked with the spheres
The initial price reaction will be crucial.
If price pushes immediately and aggressively toward the 5100 daily imbalance, it may become difficult to look for longs from the marked levels.
If instead price drops first, takes liquidity, and then reacts, we could have a more valid setup — always keeping today’s data in mind.
We’ll go through everything live at 14:00.
With the chart in front of us, it will be much clearer.
See you later and have a great Wednesday.
🔍 Reminder 🔍
I avoid trading during the Asian and London sessions.
I focus on the 14:30 news and the New York open at 15:30.
🔔 Turn on notifications so you don’t miss anything.
📬 If you have any questions, message me. I’ll reply.
🔍 NEXT APPOINTMENTS 🔍
As usual, we’ll be live at 14:00 to follow the market in real time.
In the meantime, have a good day.
-GOOD TRADING
-MANAGE RISK
-BE PATIENT

Potential 600Pips on EURAUDWait for price to rally into the 1.7780 – 1.7805 region.
Confirmation:
A structural shift, confirmed by a break and close below 1.7690.
Possible Entries
Entry 1
Sell Limit @ 1.7885
Stop Loss @ 1.7838
Entry 2
Sell Limit @ 1.7870
Stop Loss: Refined on entry
Target Levels
T1: 1.7484
T2: 1.7330
T3: 1.7180
This move can be anticipated to develop between 19:00 UTC, 17th December 2025 and 02:00 UTC, 26th January 2026.
This setup offers a projected risk-to-reward of approximately 1:11 when executed from refined entries.
Trade Safe.
Patience is the Way!
Ieios

Crude oil is ready to break to 66-67Crude oil might be ready to break to 66-67 area, as the momentum develops.
The rising demand amid colder weather conditions and OPEC+ decision to not raise the production, can lead to the price discovery towards the higher area.
Geopolitical tensions around Iran add running uncertainty and drives prices of oil futures higher.
Don't forget - this is just the idea, always do your research and never forget to manage your risk!

Report 11/2/26Macro & Geopolitical Report
Report Summary:
This report evaluates the market impact of the Trump administration’s decision to formally rescind the EPA’s 2009 greenhouse-gas “endangerment finding”, the legal keystone used to regulate CO₂ and other GHGs under the Clean Air Act—especially for vehicles. The central thesis is that this is not a simple “pro-oil / anti-EV” headline; it is a regime-uncertainty shock. Near-term, it reads as regulatory cost relief for parts of legacy autos, refining, and carbon-intensive industry. Medium-term, it raises the probability of multi-year litigation, state-federal fragmentation, and cross-border compliance divergence (EU/UK/others), which can increase the cost of capital for long-cycle investments and push multinationals toward the strictest-common-denominator standard anyway. In the next 1–4 weeks, the most visible market expression should be sector dispersion and volatility premia, not a broad macro risk-off—unless it collides with other tails (Middle East energy shocks, trade retaliation, or U.S. fiscal stress).
What happened and why it matters now
The White House announced the president will formalize a rollback that rescinds the 2009 finding that greenhouse gases endanger public health and welfare. That finding sits downstream of the Supreme Court’s Massachusetts v. EPA decision and is the predicate EPA has relied on to set and tighten vehicle GHG rules. The administration is presenting the rollback as a major deregulatory action, including claims of roughly $2,400 per vehicle in compliance cost relief and an aggregate savings headline near $1.3 trillion (figures that will be contested and, importantly, do not remove the reality of global compliance for many manufacturers). In policy terms, the move aims to remove the federal legal foundation for broad GHG regulation; in market terms, it injects uncertainty into the rulebook that governs autos, utilities, and heavy industry capex decisions.
This matters now because the market is already running hot in risk assets (major indices elevated, credit conditions still functional), so the first-order response tends to be “who wins/loses on margins.” But the second-order effect is larger: when the rulebook itself becomes unstable, investors demand higher compensation for policy risk—especially in capital-intensive sectors where payback periods are long and regulatory outcomes materially change cash flows.
Market reaction and positioning signal
In the immediate window, markets typically do not reprice the entire macro complex on climate policy alone. Instead, they reprice dispersion. Legacy automakers and ICE-heavy suppliers can catch a relief bid on the assumption of lower near-term compliance pressure, while clean-tech and some renewables can see multiple compression if investors fear weaker mandated demand. Utilities and grid infrastructure can trade in both directions: less federal pressure can reduce near-term capex urgency, but uncertainty and state-level divergence can raise required returns and complicate planning.
The positioning signal to watch is whether this becomes a “one-day sector rotation” or a broader repricing of policy credibility. If implied volatility and defensive hedging demand rise while indices remain stable, that’s the market saying: “We can rally, but we’re paying for tail risk.”
Macro transmission mechanism
This event transmits through three linked channels. The first is the regulatory cost channel: if federal rules are weakened, compliance costs and product-mix constraints can ease near-term, supporting margins for certain incumbents. The second is the uncertainty channel: litigation risk, whiplash risk, and state-level divergence raise discount rates and can delay or re-shape capex decisions (especially in autos, utilities, industrials). The third is the cross-border channel: even if U.S. federal standards loosen, major exporters still face overseas standards and carbon-cost regimes. That cross-border constraint often pushes firms to keep decarbonization capex alive, but executed in a more complex, less efficient way—raising frictional costs rather than eliminating them.
Political and fiscal implications
Politically, the rollback turns climate regulation into a sharper partisan wedge and invites immediate legal challenges, which increases the probability of policy whiplash across election cycles. That’s the key reason markets should treat the “cost relief” narrative cautiously: relief is only durable if the legal strategy survives and if future administrations do not reverse course. Fiscal optics matter because the administration is framing deregulation as an implicit consumer and industry “tax cut,” yet critics will argue that any near-term savings are offset by long-run external costs (disaster losses, insurance repricing, health burdens) and that the federal posture could increase state and private-sector costs through fragmentation.
Internationally, a looser U.S. federal stance widens divergence with Europe at a moment when the EU is tightening carbon-cost enforcement mechanisms at the border. That can increase trade friction and compliance costs for U.S. exporters in carbon-intensive sectors—even if domestic rules relax—creating a structural incentive for large firms to maintain “global standard” product pathways.
Strategic forecast: base case and pivot points
The base case is litigation + fragmentation. Courts will likely be asked to evaluate whether EPA can rescind the finding consistent with statutory obligations and established administrative law standards, and regardless of outcome, the time horizon is long. Under that base case, markets should expect prolonged uncertainty rather than a clean deregulation dividend. That typically supports the largest incumbents (scale to manage multiple regimes) and penalizes smaller or highly levered firms whose business model assumes one stable regulatory path.
The bullish fork is “rollback largely stands + states don’t fully substitute + global growth stays steady.” That improves near-term margins for ICE-linked supply chains and can modestly support U.S. industrial activity, especially if energy prices are contained. The bearish fork is “rollback blocked or whipsawed + states accelerate tougher rules + trade partners tighten carbon enforcement.” That produces the worst investable mix: higher compliance complexity, higher cost of capital, and delayed investment efficiency.
Asset impact section
XAUUSD (Gold)
Gold is not a direct one-for-one climate headline trade; it is a regime hedge. If investors interpret this move as increasing U.S. political and legal volatility—especially if it contributes to broader institutional conflict—gold tends to stay supported on dips. If, instead, markets price it as growth-positive and disinflationary through lower compliance costs and potentially cheaper vehicle pathways, gold may consolidate rather than trend. The key is whether this policy shock adds to the market’s perception of U.S. governance risk; that’s what feeds gold structurally.
S&P 500
For the S&P, the impact is mostly composition and dispersion, not index direction. Energy, industrials, and some legacy auto exposures can benefit from perceived cost relief. Clean-tech and certain renewables can face valuation pressure if mandated demand assumptions are weakened. The macro risk is longer-run: if policy instability raises the equity risk premium for capital-intensive sectors, the index’s multiple can face a gradual headwind even while earnings hold up.
Dow Jones
The Dow can look relatively resilient in this regime because it is more exposed to industrial cyclicals and mature cash-flow profiles that can be perceived as beneficiaries of deregulation. However, that outperformance is conditional on rates stability. If litigation and policy whiplash feed into higher term premium (investors demanding compensation for governance uncertainty), cyclicals can de-rate quickly even if they were “headline winners.”
USDJPY
USDJPY is primarily a relative-rates trade, and this climate policy event affects it indirectly through growth and term-premium expectations. If markets interpret deregulation as supportive for U.S. growth and therefore U.S. yields, USDJPY can bias higher. If the dominant interpretation becomes “U.S. policy volatility rising,” risk-off episodes can strengthen JPY via deleveraging and hedging flows. Practically, this reinforces a two-way, volatility-sensitive USDJPY profile rather than a clean trend.
DXY
The dollar impact is second order. A “growth-supportive deregulation” read can support DXY modestly through rate expectations. But if the event is absorbed into a wider narrative of U.S. institutional volatility and legal unpredictability, it can cap DXY rallies as global allocators diversify—especially if overseas policy frameworks look more stable. The durability of DXY strength during equity drawdowns is the real tell.
Crude Oil
Crude is not mechanically lifted by a regulatory rollback. Oil prices still anchor primarily to the global supply/demand balance and geopolitical risk premia. Where this matters is the medium-term demand narrative: if EV penetration expectations are revised lower in the U.S., it can marginally support longer-dated refined product demand assumptions. But the nearer-term tape will still be dominated by OPEC+ policy, inventory dynamics, and Middle East risk. In other words: this is more of a micro and policy-volatility catalyst than a spot-crude driver.
Closing synthesis
The market should treat this as a policy-risk premium event, not a simple “industry winner” trade. Near-term, dispersion favors legacy and cash-flow durability while challenging parts of clean-tech duration that rely on stable mandates. Medium-term, the larger macro effect is whether the U.S. drifts into a patchwork regime that raises compliance complexity and increases the cost of capital for long-cycle investments. If policy volatility rises across multiple fronts simultaneously, gold’s regime-hedge bid strengthens, equity multiples become more sensitive to term premium, and USD becomes more headline-reactive.

BTC long As always deviation into 0.5 and Monday open
Entery on current prices or after returning into range

Bullish on the DAX40Looking for price to continue its bullish direction today. Yesterday we were range bound at 25K. And this morning currently seeing price trade below the range. If I see bullish confluences on the LTF, could see price extend towards previous weeks high.
Keeping is nice and simple and always :)
Aman - SMC Wolf FX

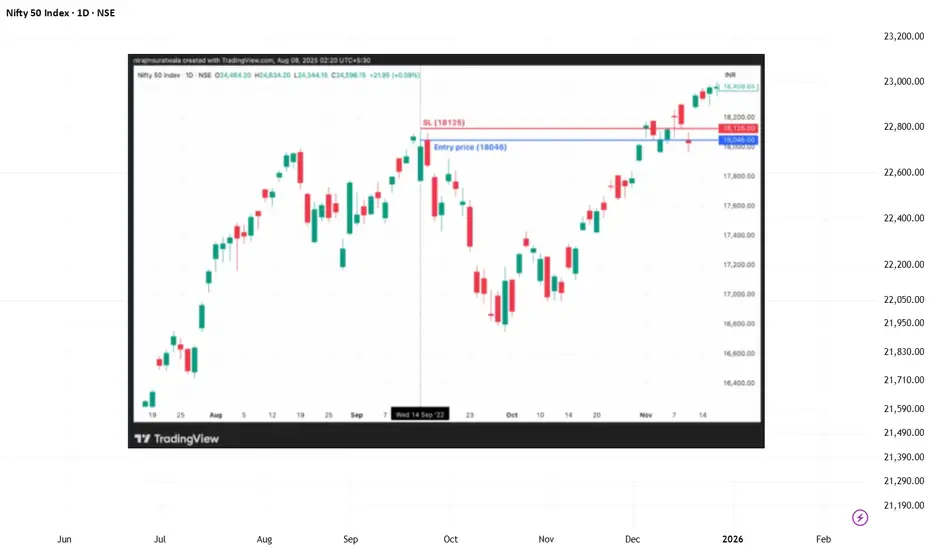
NIFTY 50 | Price–Time Exhaustion Zone Study (September 2022)This idea presents a historical market structure study based on WD Gann’s price–time principles, focusing on how downside pressure often pauses near exhaustion zones.
⚠️ This post is not a trading signal and is shared strictly for educational purposes.
📌 Context of the Study
By late September 2022, NIFTY was still under downside pressure.
However, price–time symmetry and vibration balance suggested that the decline was approaching a temporary pause zone, rather than an immediate trend reversal.
The key observations were:
Downside momentum was losing balance
A pause or consolidation phase was statistically more likely
Blind buying without confirmation carried higher risk
Sustainable moves require price confirmation after pressure release
📊 What the Chart Illustrates
A well-defined downside pressure zone
Price reaction near a time-aligned level
Market stabilization following pressure exhaustion
How markets often pause before clarity emerges, not at emotional extremes
🧠 Educational Takeaways
Markets respond to pressure zones created by price and time
Not every pause is a reversal — structure comes first
WD Gann analysis emphasizes patience and confirmation
Studying completed structures improves future decision-making
⚠️ Disclaimer
This analysis is shared for educational and research purposes only and does not constitute financial advice.

NIFTY 50 | Vibration-Based Reversal Zone Study (September 2022)This idea shares a historical market structure study based on WD Gann’s Law of Vibration, focusing on how specific price zones become sensitive when vibration balance shifts.
⚠️ This is not a trade recommendation or signal.
The post is shared strictly for educational purposes.
📌 Study Background
In mid-September 2022, NIFTY reached a price region where vibration alignment and structural symmetry became more relevant than short-term momentum.
Rather than reacting to price movement, this study observes:
Pre-defined vibration-sensitive zones
Market behavior near structural extremes
How reversals often occur when vibration conditions change
📊 What the Chart Demonstrates
A clearly defined resistance zone
A time-aligned price reaction
Expansion in volatility following vibration shift
How markets often move after internal balance changes, not news events
🧠 Educational Takeaways
Vibration governs when reversals become possible
Price reacts only after internal conditions shift
WD Gann analysis focuses on structure and balance
Studying completed cycles helps understand future behavior
⚠️ Disclaimer
This analysis is shared for educational and research purposes only and should not be considered financial advice.
onsemi’s Strategic Pivot: Dominating Power and AIOnsemi is currently redefining its position in the global semiconductor landscape. The company recently achieved record milestones within its data center business. Analysts responded by maintaining strong "Buy" ratings and high price targets. They specifically highlighted margin expansion as a primary growth catalyst. This financial resilience underscores onsemi’s successful transition toward high-value, intelligent power solutions.
The AI and Data Center Revolution
Artificial Intelligence now drives onsemi’s most ambitious growth phase. The company’s data center segment recently hit unprecedented revenue levels. These facilities require massive amounts of efficient power management to operate AI workloads. Onsemi provides the specialized hardware necessary to reduce energy waste. This technological edge positions the firm as a critical partner for global tech giants.
Mastering Silicon Carbide Innovation
Silicon Carbide (SiC) technology remains the cornerstone of onsemi’s industrial strategy. The company holds a significant patent portfolio in advanced power semiconductors. These chips enable faster charging and longer ranges for electric vehicles. By focusing on SiC, onsemi secures a dominant role in the green energy transition. This specialized focus creates a formidable barrier to entry for competitors.
Geostrategy and Supply Chain Resilience
Geopolitics heavily influence the current semiconductor market. Onsemi proactively diversified its manufacturing footprint to mitigate regional risks. The company’s geostrategy aligns with Western efforts to secure domestic chip supplies. This alignment reduces vulnerability to trade disputes and logistical bottlenecks. Consequently, institutional investors view Onsemi as a stable bet in a volatile global climate.
Leadership and the "Fab-Liter" Model
Management’s "Fab-Liter" business model continues to yield impressive results. This strategy optimizes internal manufacturing while leveraging external foundries for flexibility. Leadership prioritizes high-margin products over high-volume consumer electronics. This disciplined approach protects the bottom line during cyclical market downturns. Executives foster a culture of lean innovation and rapid technological iteration.
Addressing Cyber and Strategic Risks
Rapid AI integration introduces complex legal and cybersecurity challenges. Onsemi acknowledges these risks while maintaining its aggressive growth trajectory. The company invests in robust cybersecurity frameworks to protect its intellectual property. Managing these strategic vulnerabilities is essential for long-term stability. Onsemi’s proactive stance on risk management builds deep trust with corporate stakeholders.
Macroeconomic Outlook and Valuation
Market confidence remains high regarding onsemi's ability to expand margins. Despite broader economic headwinds, the company maintains a clear path to profitability. Its exposure to automotive and industrial automation provides a structural advantage. The stock remains a premier choice for those seeking high-tech industrial growth in a shifting economy.

AUD/USD Surge: Navigating the Aussie’s Three-Year HighThe AUD/USD pair recently shattered market expectations by climbing past the 0.7100 threshold. This rally marks a definitive three-year peak for the Australian Dollar. Domestic monetary strength and shifting global dynamics drive this impressive performance. Investors now prioritize the Australian Dollar as a premier "risk-on" asset.
The Monetary Pivot: RBA Takes the Lead
Hawkish commentary from the Reserve Bank of Australia (RBA) ignited the latest surge. The RBA maintains a restrictive stance to combat persistent inflation. Unlike its global peers, the RBA resists premature interest rate cuts. This policy divergence creates a significant yield advantage for the Aussie Dollar.
Geostrategic Leverage and Critical Minerals
Australia occupies a vital position in the modern global supply chain. Its geostrategy focuses on providing critical minerals to Western allies. Nations prioritize Australian lithium and rare earths to decouple from volatile markets. These strategic partnerships ensure consistent capital inflows and bolster the currency's value.
Industrial Innovation and Business Excellence
Australian mining giants lead the world in automation and high-tech integration. Companies deploy autonomous fleets to maximize efficiency and safety. These innovations lower operational costs and increase export volumes. Such robust business models attract significant foreign direct investment into the Australian economy.
Leadership and Corporate Culture
Australian corporate leaders embrace agile management and transparency. They foster cultures that prioritize sustainable growth and technological adoption. This leadership style builds immense investor confidence in Australian equities. Strong corporate governance provides a stable foundation for currency appreciation during volatile periods.
Technological Sovereignty and Cybersecurity
Australia invests heavily in quantum computing and biotechnology. Rising patent filings in green hydrogen technology showcase a diversifying economy. Simultaneously, the government enforces world-class cybersecurity frameworks to protect financial infrastructure. This digital resilience encourages institutional traders to maintain long-term positions in AUD.
Macro Outlook: Risk Appetite and Data
The current market environment reflects a rampant appetite for risk. Global traders are moving away from the safe-haven US Dollar. Upcoming US Non-Farm Payroll data will likely dictate the next short-term move. However, the structural strength of the Australian economy suggests a continued bullish trajectory for AUD/USD.
