ZED/USD mirroring ETH/USD from Dec, 2016 to Jan, 2018Zcash (ZEC) is a cryptocurrency that prioritizes privacy and security, offering users the option of shielded transactions to protect their financial information. This focus on privacy positions Zcash as a leading digital asset in an era where data protection is increasingly important.
The development team behind Zcash is renowned for their expertise in cryptography and commitment to innovation. They have consistently implemented advanced features to enhance the protocol's security and efficiency. For instance, the integration of zk-SNARKs (Zero-Knowledge Succinct Non-Interactive Arguments of Knowledge) enables private transactions without compromising the integrity of the blockchain.
Zcash's governance model includes a development fund that allocates a portion of the block rewards to support ongoing research, development, and community initiatives. This sustainable funding mechanism ensures continuous improvement and adaptation to the evolving digital currency landscape.
Market analysts have projected significant potential growth for Zcash. A report by Grayscale Investments suggested that ZEC could reach a value exceeding $62,000 by 2025, assuming it captures a portion of the offshore wealth market seeking privacy-preserving financial instruments.
In summary, Zcash's emphasis on privacy, backed by a skilled development team and a sustainable funding model, positions it as a strong contender in the cryptocurrency market. Its potential for substantial value appreciation further underscores its appeal to investors seeking exposure to digital assets with robust privacy features.
Do you believe it?
Beyond Technical Analysis

BTCUSD MAKET OUTLOOK!BTCUSD trades at 114,623 it’s a healthy bullish trend that we’re looking forward to capitalizing from. I’m buying this pair from the current market price. I anticipate more bullish price action to develop away from the current market price. This trend is still bullish Therefore, a buy opportunity is envisaged

NAS100 ShortElite analysis
Both possibilities played out
Price liquidated NY high
Price reacted off of 4h structural liquidity
Targets lower liquidity pools

SPX500 ShortElite analysis
2 Possibilities
Price reacted off 4h structural liquidity
targets, lower liquidity pools

TSLA - Important!🔥 Tesla Analysis (Daily Structure) 🔥
Alright, let’s break this one down 👇
🧱 Structure Overview
Tesla’s price is currently hovering around $452, sitting right below a major resistance zone between $455 – $470 (highlighted in orange). This area has acted as a strong ceiling multiple times — every approach has been met with rejection pressure.
Below, the support floor sits clean around $420 – $425, which has been holding the range low for a while. We’re essentially trapped in a sideways consolidation box — a range between that $420 low and the $470 resistance cap.
🧭 Bias
Current structure = Neutral to Bearish
Price just wicked into resistance, showing signs of rejection. Unless we see strong follow-through above $470 with clean volume, this is likely a reaction zone for shorts.
💡 Key Zones
Resistance (Sell Zone): $455 – $470
Strong supply — expect sellers to defend this area.
Support (Buy Zone): $420 – $425
Range demand base — liquidity resting below.
🎯 Scenarios
Bearish Setup (Higher Probability for Now)
If Tesla fails to break and close above $470, look for a move back down to $420 — possibly a liquidity grab under the range. Confirmation would be bearish engulfing or a strong rejection candle from resistance.
Bullish Setup (Breakout Play)
If price cleanly closes above $470 and retests it as support, we could open the door toward $500 (measured move target). That’d be a breakout from the range and continuation of the larger bullish channel.
⚖️ Risk Management
Bears: Stop above $475 – $480
Bulls: Stop below $445 if entering after breakout retest
Keep R:R ≥ 1:2
🧠 Summary
Tesla’s in a tight range — smart money likely accumulating or distributing near these highs. Watch for rejection signs around $470 for short plays, or confirmation above it for the next leg to $500.
This is the make-or-break zone — the next move will define Tesla’s mid-term direction. ⚡️
Why Most Traders Exit Too Early — Psychology of Taking Profits1. Introduction
Most traders obsess over finding the perfect entry.
But what really separates professionals from everyone else is how they exit.
Closing trades too early kills more profits than bad setups ever will.
The problem might be one's psychology.
2. The Two Fears That Control Exits
When managing profits, every trader battles two emotions:
Fear of Loss – “ What if the PRICE reverses?”
Fear of Regret – “What if it keeps running after I close?”
Both pull you in opposite directions. One makes you take profit too soon; the other makes you hold too long.
The balance between them defines your discipline.
3. Why Most Traders Close Too Early
After entering a good trade, emotions rise. As profit builds, so does anxiety.
Instead of trusting their plan, traders imagine losing what they’ve just gained, so they close the trade prematurely.
In doing so, they trade emotion, not logic.
It feels safe in the moment, but long term it destroys reward-to-risk consistency.
4. The Solution: Predefine the Exit
The only way to remove hesitation is to plan exits before entering.
Decide in advance:
– Target levels based on structure or risk-reward.
– Conditions that justify partial profits.
– Situations that allow for trailing stops.
When these decisions are made beforehand, emotions can’t interfere mid-trade.
You act according to a plan, not a feeling.
Visual idea: Screenshot-style mockup of trade plan with marked “Entry,” “Partial,” “Final Target.”
5. The Real Lesson
Profit-taking should be systematic, not emotional.
Your job isn’t to catch every little move, it’s to execute your plan without hesitation.

Ethereum (ETH/USDT): Possible Short OpportunityHi guys!
ETH is currently testing the ascending trendline support after forming a potential lower high near the $4,165 zone. The structure shows early signs of weakness as buyers failed to maintain momentum above the last swing top.
A clean break below the trendline could confirm a short-term bearish shift, targeting the $4,030–$4,000 support zone, which aligns with the previous breakout level. The invalidation of this setup would occur if the price breaks and holds above $4,165, signaling renewed bullish momentum.
important levels:
Resistance: $4,165
Support: $4,030 – $4,000
Bias: Bearish below $4,165

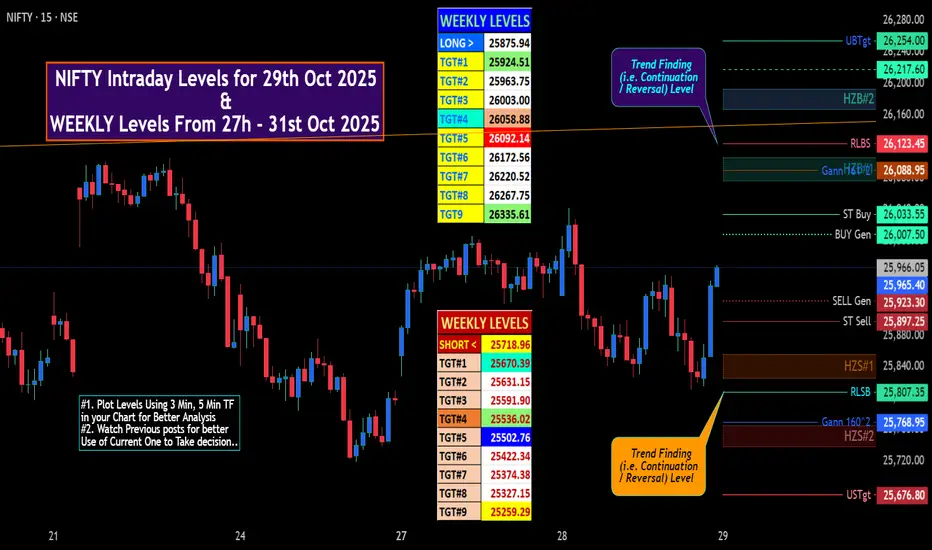
NIFTY IntraSwing Levels for 29th Oct 2025🚀 "WEEKLY Levels" mentioned in BOX format.
🌡️Plot Levels Using 3 Min, 5 Min Time frame in your Chart for Better Analysis
L#1: If the candle crossed & stays above the “Buy Gen”, it is treated / considered as Bullish bias.
L#2: Possibility / Probability of REVERSAL near RLBS & UBTgt
L#3: If the candle stays above “Sell Gen” but below “Buy Gen”, it is treated / considered as Sidewise. Aggressive Traders can take Long position near “Sell Gen” either retesting or crossed from Below & vice-versa i.e. can take Short position near “Buy Gen” either retesting or crossed downward from Above.
L#4: If the candle crossed & stays below the “Sell Gen”, it is treated / considered a Bearish bias.
L#5: Possibility / Probability of REVERSAL near RLSB & USTgt
HZB (Buy side) & HZS (Sell side) => Hurdle Zone,
*** Specialty of “HZB#1, HZB#2 HZS#1 & HZS#2” is Sidewise (behaviour in Nature)
Rest Plotted and Mentioned on Chart
Color code Used:
Green =. Positive bias.
Red =. Negative bias.
RED in Between Green means Trend Finder / Momentum Change
/ CYCLE Change and Vice Versa.
Notice One thing: HOW LEVELS are Working.
Use any Momentum Indicator / Oscillator or as you "USED to" to Take entry.
⚠️ DISCLAIMER:
The information, views, and ideas shared here are purely for educational and informational purposes only. They are not intended as investment advice or a recommendation to buy, sell, or hold any financial instruments. I am not a SEBI-registered financial adviser.
Trading and investing in the stock market involves risk, and you should do your own research and analysis. You are solely responsible for any decisions made based on this research.
"As HARD EARNED MONEY IS YOUR's, So DECISION SHOULD HAVE TO BE YOUR's".
Do comment if Helpful .
In depth Analysis will be added later (If time Permits)
BTC/USDT: Symmetrical Breakout and Channel ContinuationHi guys!
Bitcoin has successfully broken out of a symmetrical triangle, confirming a bullish continuation pattern after several days of consolidation. The breakout was followed by a clean retest of the triangle’s upper boundary, which now acts as support.
Currently, the price is moving inside a rising parallel channel, showing a healthy bullish structure with higher highs and higher lows. As long as BTC maintains above the midline of this channel, the short-term trend remains upward.
In the coming sessions, price may continue oscillating within this ascending channel, forming a series of higher lows before reaching the next key resistance around $118,682 , and potentially extending toward the triangle’s measured target at $122,56 7.
On the downside, a confirmed close below the channel’s lower line would be the first sign of weakening momentum and could lead to a deeper pullback toward $112,000–$113,000.
Important levels:
Support: $114,000 / $112,500
Resistance: $118,682 / $122,567
Trend: Bullish above $114,000

Gold at a Critical Crossroad: Bounce or Breakdown Ahead?Hi!
The gold price is currently trading around $4,042, sitting just above a critical support area near $3,953.80. This gray zone is a key decision point for the next major move.
Trend Structure:
The broader trend remains bullish, moving within a well-defined ascending channel.
Double Top Formation:
A short-term double top has formed near recent highs, triggering a corrective move down into the channel’s midline and the gray support area.
Critical Support Zone ($3,953.80):
This level aligns with previous structure support and the channel’s bottom, making it a high-probability reaction zone.
________________
Scenario 1: Bullish Reaction (Primary Scenario)
If gold holds above the gray critical area and bounces within the ascending channel, we could see a renewed bullish wave.
Confirmation: A strong bullish reaction or higher low around $3,953–$3,980.
Target: The green target zone around $4,619.57, corresponding to the upper channel boundary and a potential measured move from the recent correction.
Scenario 2: Bearish Breakdown
If the gray area fails to hold, it could signal deeper downside momentum.
Trigger: A clean break and 4H close below $3,953.80.
Target: The pink support zone near $3,656.01, which aligns with prior accumulation and the lower channel boundary.
________________
Disclaimer: As part of ThinkMarkets’ Influencer Program, I am sponsored to share and publish their charts in my analysis.

· XAUUSD Buy Opportunity
Identifying a long opportunity on #XAUUSD. Price is entering a key demand Buy Zone where sentiment is turning positive. Risk is managed with a logical stop loss below 3848.
#Gold #Trading #Forex

Novartis Increases Purchase of Avidity BiosciencesNovartis Strengthens Its Rare Diseases Strategy with the Purchase of Avidity Biosciences
By Ion Jauregui – Analyst at ActivTrades
Novartis (SWX: NOVN) has taken an important step to strengthen its presence in therapies for rare diseases. The company announced the acquisition of Avidity Biosciences (NASDAQ: RNA) for 12 billion dollars in cash, paying 72 USD per share, 46% more than Friday's close.
As part of the deal, Avidity will separate its cardiac unit into a new publicly traded SpinCo, allowing Novartis to concentrate its resources on the rare diseases segment, a strategic area with high margin potential and lower competition. The operation comes at a critical moment, amid the loss of patents for key products such as Entresto and Cosentyx, making pipeline diversification a priority to sustain revenues.
Fundamental Analysis
The acquisition of Avidity strengthens Novartis’ portfolio in the face of patent expirations, offering a pipeline with innovative therapies and potential for sustainable growth. The company maintains a solid financial position, with sufficient liquidity to finance the operation without compromising its balance sheet. This allows it to reduce risks from declining revenues of mature products while positioning itself in a high value-added segment.
Technical Analysis (Ticker AT: NOVN.CH)
The stock is trading today around 99.47 Swiss Francs, after recently rebounding from highs of 106.88 CHF. Since then, bullish volume has been losing strength, and yesterday the 50-day moving average support was breached. The current support in the first trading hour is located at the 100-day moving average. The medium-to-long-term trend has remained bullish.
The RSI has dropped to 34.96%, reaching oversold levels, which could indicate that a technical bottom has been reached. The MACD has entered negative territory, although its signal and moving averages remain above the histogram in negative territory, with volume gradually increasing. This could suggest that if the current price loses value, it may test the 96 CHF support in the coming sessions if the 100-day moving average does not hold. The Point of Control (POC) coincides with this level, concentrating most of the trading power in this zone.
The ActivTrades Europe Market Pulse indicates a neutral risk, slightly increasing, but with no relevant market data showing correlation with these company developments.
Indicators:
RSI: 34.96%, moderate relative strength signal in oversold territory
MACD: positive, with an increasing bearish histogram, anticipating continuity of the impulse
Key support: 96 USD
Resistance: 106.88 USD highs if the current trend holds, key pivot for bullish momentum near the point of control (~102 USD)
The market interprets the acquisition as a strategic reinforcement of the pipeline and an action to diversify revenues, which could maintain bullish momentum in the short and medium term. The current correction is interpreted as a temporary devaluation following the acquisition, very common after consolidations of this type.
*******************************************************************************************
The information provided does not constitute investment research. The material has not been prepared in accordance with the legal requirements designed to promote the independence of investment research and such should be considered a marketing communication.
All information has been prepared by ActivTrades ("AT"). The information does not contain a record of AT's prices, or an offer of or solicitation for a transaction in any financial instrument. No representation or warranty is given as to the accuracy or completeness of this information.
Any material provided does not have regard to the specific investment objective and financial situation of any person who may receive it. Past performance and forecasting are not a synonym of a reliable indicator of future performance. AT provides an execution-only service. Consequently, any person acting on the information provided does so at their own risk. Political risk is unpredictable. Central bank actions can vary. Platform tools do not guarantee success.

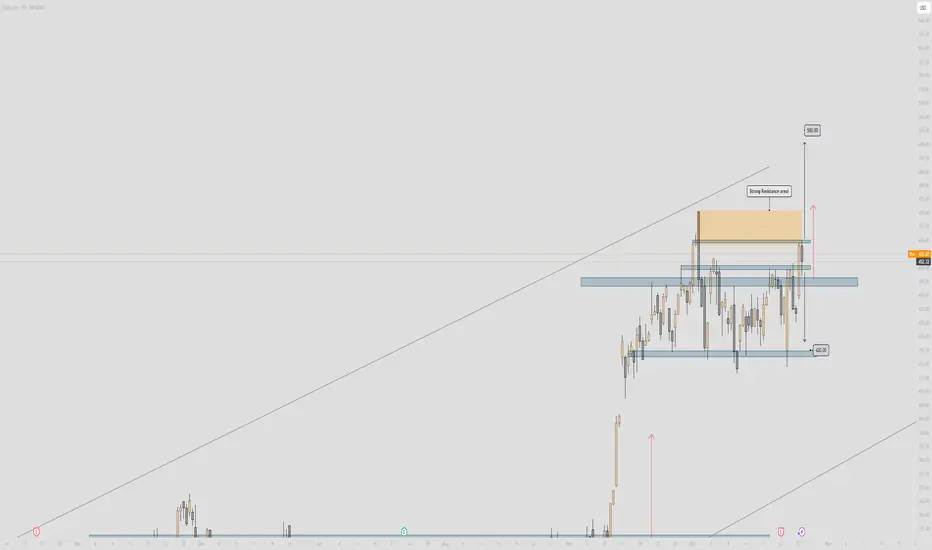
How to Find the Next 19X in crypto Like ZcashEver wondered what makes some coins suddenly explode in price?
If I told you that the same patterns keep repeating, would you believe it?
Let’s learn how to read the market’s mind, not just its charts.
Hello✌️
Spend 2 minutes ⏰ reading this educational material.
🎯 Analytical Insight on Zcash:
I still see at least another 20% potential upside for Zcash before the whales who bought it at the bottom start taking profits. However, investing in it right now is highly risky and should be considered a short-term trade with a strict stop loss and, even more importantly, a clear take-profit target.
Now , let's dive into the educational section,
💭 The Fear and Greed Cycle That Controls Every Market
Crypto markets always move between fear and greed.
When everyone feels greedy, prices are already high.
When fear dominates, the best setups quietly form.
Smart traders don’t react to emotion; they read it like a signal.
🔍 Spotting Early Signs Before the Big Move
Before every major rally, something small changes first.
Watch for strong volume at key support zones when price still looks weak.
If buyers appear while price moves sideways, it often means accumulation.
The earlier you notice this, the higher your edge becomes.
🧠 Mastering the Trader’s Mindset
Winning traders are not those who never lose, but those who stay calm.
They understand that every panic or hype wave is just a part of the game.
Confidence in process beats confidence in prediction every single time.
Emotional control is the most underrated trading skill.
💡 Combining Technical and Mental Strength
Charts can tell you what’s happening, but your mindset decides what you do next.
Many traders use indicators but still fail because they can’t control reactions.
When you plan your move before emotions hit, you become consistent.
Think of trading as a test of patience, not just analysis.
🧩 How Smart Money Leaves Clues
Smart investors never chase green candles.
They build positions when the market is silent and boring.
You’ll see higher volume with almost no price change, that’s the clue.
Once price breaks out, they’re already in and the crowd comes late.
📊 TradingView Tools to Catch the Next 19x Setup
Use the Volume Profile to see where the strongest trading activity happens.
When the highest volume appears near lows, accumulation might be active.
Next, check RSI Divergence.
If price makes new lows but RSI doesn’t, momentum is shifting quietly.
Third, study On-Balance Volume (OBV).
A rising OBV with flat price often signals hidden buying pressure.
Finally, the Moving Average Ribbon helps confirm a trend flip.
When short MAs like 20 and 50 cross above the 200 MA, bullish energy starts to build.
Combine these four tools in one TradingView layout and track five low-cap coins.
This simple routine can reveal early-stage moves that later become 19x rallies.
🧾Summary
Finding the next big crypto gem isn’t luck, it’s patience, structure, and awareness.
Every breakout begins when fear dominates and attention disappears.
Train your eye to see what others ignore, that’s where profits grow.
Golden Tips
Watch how volume reacts, not just how price moves.
When the market feels boring, opportunity is quietly forming.
Write your strategy down and follow it, discipline beats emotion every time.
✨ Need a little love!
We pour love into every post your support keeps us inspired! 💛 Don’t be shy, we’d love to hear from you on comments. Big thanks , Mad Whale 🐋
📜Please make sure to do your own research before investing, and review the disclaimer provided at the end of each post.

XAUUSDHello Traders! 👋
What are your thoughts on Gold?
Gold experienced a sharp decline last week, but found support around the $4,000 zone, leading to a modest rebound.
Since then, the price has entered a range-bound phase, oscillating between key support and resistance levels.
Current Outlook:
The next directional move depends on a breakout from this consolidation range:
A break above the resistance zone could trigger a move toward the previous high.
Conversely, a break below the support zone would likely signal a deeper bearish continuation and formation of new lows.
For now, gold remains in a neutral range, and it’s best to wait for a confirmed breakout before taking new positions.
Don’t forget to like and share your thoughts in the comments! ❤️

EURUSD Buy Setup | Liquidity Sweep + OB + LTF Confirmation📈 On EURUSD , the market has been moving within a corrective phase, showing early signs of potential bullish reaction zones forming.
There’s a clear liquidity pool from the Asian session, and just below that sits a bullish Order Block (OB) — the perfect area for smart money to accumulate orders before driving price higher.
💧 Liquidity Context:
During the Asian session, the market built liquidity both above and below short-term structure.
Now, we can see resting liquidity above the OB, which makes this area a prime zone for manipulation and reversal setups.
The plan is to wait for the market to sweep all liquidity — including Asian highs/lows and inducement above OB — before reacting from the OB zone.
💡 Setup Plan:
1️⃣ Wait for the Asian session liquidity to be taken — price should collect liquidity above OB.
2️⃣ Once the liquidity sweep is done and price taps into the OB, focus on the Lower Timeframe (LTF) (1M–5M) for strong bullish confirmation.
3️⃣ Confirmation examples:
✅ Clear MSS / CHOCH in the bullish direction,
✅ Strong rejection candle or engulfing formation,
✅ LTF structure shift forming higher highs & higher lows.
4️⃣ After confirmation, we’ll plan for buy entries, following the new order flow shift upward.
5️⃣ If no LTF confirmation, no trade — patience is key 🧘♂️
🎯 Target:
Aim for the next swing high, liquidity pool above recent structure, or potential intra-session high depending on momentum.
🧩 Setup Summary:
Market Bias → Bullish (Liquidity + OB Reaction)
Confluence → Asian Session Liquidity + OB + Inducement Sweep
Entry → Only after strong LTF confirmation (1M–5M)
Target → Next Swing High / Liquidity Pool Above
Type → Scalp to Intraday Buy Setup
Risk Rule → Confirmation required — no confirmation, no entry ❌
⚠️ Disclaimer:
This is my personal analysis and not financial advice.
Always confirm with your own analysis and manage risk properly before executing any trade.

GBPUSD Buy tradeThere is a good buying opportunity on GBPUSD as there was a strong drop on the pair but not on EURUSD. This indicates that the pair is looking for liquidity areas and is likely to rise from the 1.33030 level.

EURUSD 28th October - Short ideaMy reasoning to a short idea of EURUSD today in London session
EURUSD 28th October - Short idea
Entry @ 1.16610
Stop @ 1.16675
Take Profit @ 1.16354

AUD/USD has finally broken out of consolidation, showing strong Hey traders!
New day — new setups 🌤
AUD/USD has finally broken out of consolidation, showing strong buyer momentum.
After a clear triangle breakout, price seems to be taking a short pause — likely a retest before moving toward 0.6600.
🎯 Target: 0.6600 – 0.6620
❌ Invalidation if price dips below breakout zone.
Trade with patience, stay disciplined — and let the profits follow 🔥💎

GBPJPY RiskyRisky position... yes, based on my method, also yes, guaranteed to probably go wrong, also yes

Gold breaks below $4000 – Downtrend extends toward $3950📊 Market Overview
Gold prices continued to drop sharply today, falling to around $3970/oz after breaking the key psychological level of $4000. Profit-taking pressure and a stronger USD weighed on the metal. Rising U.S. Treasury yields and expectations that the Federal Reserve may delay rate cuts further weakened investors’ appetite for gold.
🧭 Technical Analysis
• Trend: Strongly bearish; H1–H4 charts show an extended downward wave.
• Resistance (near): $3988 – $4005
• Resistance (upper): $4025 – $4040
• Support (near): $3950 – $3938
• EMA 50 & 200 (H1): EMA50 crossing below EMA200 confirms bearish bias.
• Candlestick pattern: Series of long-bodied bearish candles showing strong selling momentum.
• RSI (H1): 28 – oversold zone; possible short-term technical rebound.
💡 Outlook
Gold remains in a deep correction phase after several weeks of strong gains. The area between $3950–$3938 may trigger technical buying or short covering. If prices fail to break above $4005, the downtrend could extend toward $3920–$3900.
⚙️ 4. Trading Strategy
🔻 SELL XAU/USD : $4000 – $4003
🎯 TP: 40 / 80 / 200 pips
🛑 SL: $4007
🔺 BUY XAU/USD : $3938 – $3941
🎯 TP: 40 / 80 / 200 pips
🛑 SL: $3934

China Stocks — The Calm Before a New U.S.–China Trade Reset?The upcoming Trump–Xi meeting could mark a major turning point for Asian markets. While headlines focus on tariffs and semiconductors, the real leverage point lies in rare-earth metals — materials where China still dominates global supply and processing. Any sign of easing U.S. restrictions or a framework for new technology cooperation could quickly reprice Chinese industrial and resource names that have been heavily discounted since 2022.
The Hang Seng Index has quietly rebounded from its spring lows and is now testing the lower line of its rising channel. A sustained break above this zone could trigger a technical rotation back into Chinese equities — especially those tied to critical materials, power technology, and domestic AI infrastructure.
After years of capital flight and valuation compression, many Chinese mid-caps trade at fractions of Western peers despite solid earnings recovery. If the political narrative shifts from confrontation to cautious cooperation, the asymmetric upside could be significant. The market still doubts it — which is exactly what gives the move potential energy.
In short: rare-earth leverage + trade détente + ultra-low valuations = potential spark for a new China rally. Watch for follow-through after the Trump–Xi meeting and confirmation on the Hang Seng channel breakout. Comment Below if you have any Chineese stocks that you like, here are mine :)
NYSE:BABA NASDAQ:BIDU NASDAQ:JD NASDAQ:XNET NASDAQ:PDD

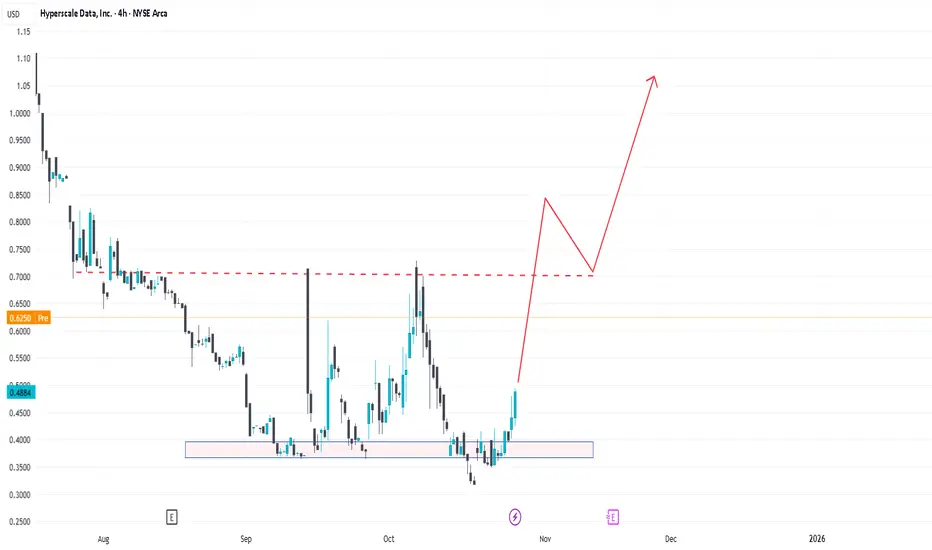
GPUS – The Hidden NVIDIA-Linked Microcap That Might 10×The market is full of AI infrastructure stories, but very few come from companies that already survived multiple industrial cycles. GPUS is one of those rare cases — a firm with decades of history that keeps reinventing itself. What used to be a crane and hotel business is now morphing into a modern data-infrastructure and Bitcoin-mining company, replacing declining legacy assets with the most demanded resource of this decade: computing power.
Through its Sentinum subsidiary, GPUS has begun building facilities powered by NVIDIA GPU clusters and high-efficiency miners. The goal is to scale to several thousand active mining and compute units — targeting roughly 5 000 machines in the coming phase. It’s a bold pivot: from lifting steel to lifting data. And in a market obsessed with AI capacity, this is exactly the kind of story that can explode when execution meets narrative.
The numbers highlight the asymmetry. GPUS trades at roughly $50 million market cap — microscopic compared with peers like NASDAQ:APLD , whose valuation exceeds $8 billion. Both target similar fields: AI-grade compute infrastructure and digital-asset power utilization. If GPUS manages to build even a fraction of its announced capacity, the valuation gap leaves theoretical upside north of 1 000 %. Add to that their new Bitcoin treasury strategy and expanding Michigan data-center power capacity, and the picture starts to resemble an undervalued optionality play on both crypto and AI.
Still, this isn’t a risk-free moonshot. The balance sheet shows losses; the pivot is capital-intensive; and dilution remains a possibility as the company raises funds to scale. Execution speed will be crucial — the market won’t reward empty announcements for long. But if management delivers actual installed GPU capacity and lands enterprise clients, the repricing could be violent.
In short, GPUS is the kind of microcap that the market usually ignores — until suddenly it doesn’t. It’s volatile, speculative, and not for the faint-hearted. Yet for traders searching for asymmetric setups, it sits right at the intersection of Bitcoin mining, AI compute, and under-discovered transformation. A clean breakout above recent resistance could be the technical confirmation that fundamentals are finally catching up with the story.
The AI swap seems to have been the answerAs a software engineer, energy and focus becomes your greatest resources.
When you push too hard, those can be depleted and mistakes then follow
Needless to say, I've been going too hard and that begins to show when choosing the wrong AI model to forecast...
Making the swap between the options has worked out (phew!)
