AMD LONG, SHORT TERM, kurz‑ und langfristig.AMD is seen as a strong long‑term investment due to its position in CPUs, GPUs, and AI/data‑center chips, with many analysts expecting growth over the coming years. Short‑term price swings can still happen around earnings or market news, so volatility should be expected. Please do your own research before doing your trades or investments; I am not responsible.
Beyond Technical Analysis

100 years!www.tradingview.com
Does this keep you up at night? You might look for this pattern across smaller time frames, but to see it across 100 years is well.. (no words).
3 Scenarios:
1. Yields blast off directly from here.
2. A crisis (real/manufactured) comes in allowing them to pull rates down to the 6M IDM (0-0.36%) and perpetuate the divergence. Then yields spike next cycle.
3. We break the divergence and head into negative rates?
The bond market doesn't lie.

SP500 Consolidation a bullish mid rangeSP500 Price is trading within a rising and maintaining a broader bullish structure despite recent volatility the market found strong demand near the lower boundary of the channel, followed by an impulsive bullish recovery signalling buyers stepping back in with strength.
Currently, price is consolidating above the mid-channel support zone, forming higher lows and suggesting a potential continuation to the upside. The highlighted grey zone represents a key demand / accumulation area, where price previously reacted and built momentum.
Key Level Zone;
Resistance Level ; 7,001 / 7,040
Support Levels ; 6,940 / 6,910
A clean break and acceptance above the mid-range could open the door for a measured move toward the upper channel, while failure to hold current support may trigger a pullback toward the lower range support before continuation.
You may find more details in the chart,
Trade wisely best of luck buddies.
Ps; Support with like and comments for better analysis Thanks for Supporting.

Designing a Trading Process You Can ScaleA scalable trading process is built to function independently of mood, focus, or screen time. Many traders remain inconsistent because results depend on how alert they feel or how closely they watch price. That approach does not scale. A process that scales is one where decisions are defined in advance, execution follows fixed rules, and outcomes can be evaluated objectively. The trader executes the process rather than improvising inside it.
The foundation of scalability is clear role separation. Analysis, execution, and review must operate as distinct phases with defined inputs and outputs. Analysis establishes context. It answers where the market is positioned, which conditions are active, and which areas matter. Execution exists only to act on pre-approved conditions with predefined risk. Review evaluates whether rules were followed and whether the process behaved as expected. When these phases overlap, emotional interpretation enters the workflow and consistency breaks down.
The next requirement is standardized inputs. A scalable process uses the same timeframes, the same market types, and the same session windows every day. It does not scan endlessly for opportunity or adapt rules based on boredom. Instead, it waits for price to reach predefined locations under known conditions. This reduces trade frequency, but it increases signal quality and mental clarity. Fewer decisions lead to higher execution accuracy.
Risk rules are the structural backbone of scalability. Fixed risk per trade, daily loss limits, and exposure caps ensure that no single decision can materially damage the system. These rules must be non-negotiable. They protect the process during drawdowns and prevent emotional recovery behavior. A strategy that cannot survive losing periods without modification is not scalable, regardless of its upside.
A scalable process also defines when not to trade. Conditions such as low volatility, unfavorable sessions, or unclear structure should be explicitly excluded. This prevents forced participation and preserves capital for higher-quality environments. Discipline is reinforced not by activity, but by selective absence.
Finally, the process must be transferable. A scalable framework can be written, explained, and followed by someone else. If your edge exists only in intuition or experience, growth is capped. When rules are documented, tested, and reviewed, improvement becomes systematic. Performance feedback becomes actionable rather than emotional.
Scaling in trading is not about increasing trade count or leverage. It is about building a process that holds up under repetition, pressure, and time. When execution no longer depends on how you feel, consistency becomes a natural outcome rather than a constant struggle.
Keep it short, keep it simple and avoid unnecessary mistakes is the path to greatness. 💚

USNAS100 consolidation bullish range formationUS100 trading in a broad consolidation a rebound Price recently formed a strong bullish recovery from the February low near 24,300, followed by a corrective pullback and short-term range formation.
Tecnically Price is currently trading around 25,260, consolidating above the lower support zone near 25,000, which is acting as a key demand area. The structure suggests a potential accumulation phase, highlighted by choppy price action and higher lows inside the range.
A clear resistance zone is marked around 25,600, which aligns with prior structure and supply a successful breakout and hold above this level could open the path toward the next major resistance near 26,200, which represents the previous swing high and range top.
You may find more details in the chart,
Trade wisely best of luck buddies,
Ps; Support with like and comments and comments for btter analysis Thanks for Supporting.

Gold consolidation remains bullish structureGold consolidation remains bullish after price action slowed and closed above the 5000 level. This behaviour suggests healthy digestion following the recent rally rather than trend exhaustion.
Gold prices rose today and tested the highest resistance level of the week. The move was supported by softer real yields, a weaker U.S. dollar, and renewed safe-haven demand ahead of key macroeconomic data.
Recent Federal Reserve signals have reinforced expectations for easier monetary policy. Comments from Fed official Mary Daly, indicating openness to one or two rate cuts, combined with risks of softer U.S. jobs and CPI data later this week, have increased bullish sentiment for bullion.
Tecnically, if bulls maintain control within the current range, a pullback toward the support zone is possible. As long as price holds this area and then achieves a daily close above 5060, upside momentum should strengthen. In that scenario, the next key resistance zone lies between 5130 and 5252.
You may find more details in the chart,
Trade wisely best of luck buddies.
Ps; Support with like and comments for better analysis Thanks for Supporting.

US30 Consolidation Growth momentumUS30 trading within a well-defined ascending channel, confirming a medium-term bullish trend. Price has consistently respected both the upper resistance and lower support boundaries of the channel, indicating strong trend structure and controlled momentum.
Recently, price produced a strong impulsive bullish breakout from the mid-range consolidation zone, pushing above prior resistance around the 49,600–49,800 area. This move suggests renewed buying strength and continuation intent.
Tecnically the breakout, price is currently consolidating just below the upper channel resistance, forming a short-term pullback this behaviour is typical of bullish continuation, where the market digests gains before the next directional move.
You may find more details in the chart,
Trade wisely best of luck buddies.
Ps; Support with like and comments for better analysis Thanks for Supporting.

EUR/USD Bullish Consolidation & Potential BreakoutEUR/USD is currently consolidating after forming a base that halted the local downtrend. Price action suggests bullish intent, with buyers defending key levels and compressing price beneath resistance.
From a fundamental perspective, the U.S. dollar remains under pressure due to strength in the Japanese yen following Japan’s early parliamentary election. This shift in sentiment could weigh on the dollar in the medium term, supporting further upside in EUR/USD.
Technically, the consolidation appears to be acting as a pause before continuation. If bullish momentum is maintained and price successfully breaks above resistance, the pair may exit consolidation and resume growth.
In a bullish scenario, price may first retest support after the breakout (a typical pullback), before continuing higher. Upside targets are projected in the 1.19600 – 1.20008 zone.
You may find more details in the chart,
Trade wisely best of luck buddies,
Ps; Support with like and comments for better analysis Thanks for Supporting.

US100 Cycle 4 phase 2 of 4Up to this point the Phase 2 is completed, the initial positions was opened at 25,203.7$ and 24,880.4$ on M and P(c) level. Will the next phase be Phase 3 as called safe exit? We are navigating the market to see what happens next.
Phase: 1
Date & Time: 2026-02-04 11:40 -5 GMT
Primary Entry M: 25,062.2 $
Secondary Entry P(c): 24,728$
Mean Entry: (25,062.2+24,728)/2=24,895.1$
Trapezoid Time Duration: 15 Days
3th Triangle domain (%): 2 * 1.76% = 3.52%
Risk coefficient (R): 2
Risk domain (%) (D): (3th Triangle domain) *(Risk coefficient) = 3.52%*2 = 7.04 %
Hypothetical Capital: 100,000$
Contract Size: 10 Unit
Expected Max Drawdown (%): 5%
Expected Max Drawdown $ (EMDD): 100,000 * 5% = 5,000
Expected Low Price: (1 – 7.04%) * 24,895.1$ = 23,142.5$
Size: 5,000 / (24,895.1 – 23,142.5) ~= 2.85 Unit
Position Size: Size/Contract Size = 2.85 /10 = 0.28
Each Trade Size = 0.28 /2 = 0.14
Targets:
T1 (Mirror / Lower Trapezoid): 25,120$
T2 (Apex N): 25,495 $
T3 (Trapezoid Top): 25,860$
Expected Profit by first entry and Exit at T3 for Scenario No 1:
(T3 - Entry M) * Contract Size * Each Trade Size = (25,860 -25,062.2) *10*0.14= 1,117$
Expected Total Profit for Scenario No 1: 1,117$
Expected Return % for Scenario No 1: 100*(1,117/100,000) = 1.12%
Expected Annual Return% for Scenario No 1: (1.12%*365/15) =27.25%
Expected Profit by 2th entry and Exit at T2 for Scenario No 2:
(T3 - Entry M) * Contract Size * Each Trade Size = (25,860 -25,062.2) *10*0.14= 1,117$
(T2 - Entry P(c)) * Contract Size * Each Trade Size = (25,495 -24,728) *10*0.14= 1,074$
Expected Total Profit for Scenario No 2: 1,117+1,074=2,191$
Expected Return% for Scenario No 2: 100*(2,191/100,000) =2.19%
Expected Annual Return% for Scenario No 2: 2.19%*365/15=53.29%
Notes: P(c) may or may not be reached; both M and P(c) are Phase 1 only.
"Both trade sizes are calculated using the hypothetical capital, the investor’s maximum allowed drawdown, the 3rd Triangle Domain percentage, the Risk Coefficient, and the Contract Size."
TotalSize=(EMDD=5000)/(2*D*R*MeanPrice*ContractSize)
Phase: 2
Current Date & Time: 2026-02-10 09:00 -5 GMT
The Price after declined to 24,138$, climbed up and touched the Delayed Mirror at 25,270$, So The Delayed Mirror touched after phase 1.
Up to this point, the initial position was opened at 25,203.7$ and 24,880.4$ on M and P(c) level. Will the next phase be Phase 3 as called safe exit? We are navigating the market to see what happens next.

Become a Successful Trader- Full Course in 10 minutesThis is not an advert, this is my entire trading curriculum taught as a lesson live on trading view to help you guys out. This covers your motivation for trading, trading maths (risk of ruin, variance, expected value, game theory), momentum structures to read price action correctly, Money Makers (key levels to target for liquidity and why) and finally managing trades and yourself through journaling and trendlines.
Hopefully this is a great starting point for you guys and you get value from this!

XAUUSDHello Traders! 👋
What are your thoughts on GOLD?
After a strong bearish rejection from the previous high, Gold entered a deep corrective phase and declined into the highlighted demand zone, where strong bullish reaction and buyer participation were observed.
Subsequently, price formed a higher low, signaling the development of a bullish structure, and is currently trading above the ascending trendline.
At the moment, price is testing a key resistance area .
As long as Gold holds above the rising trendline and the identified support zone, the overall outlook remains bullish, and price has the potential to advance at least toward the marked upside target.
Currently, price has entered a trading range, and it is now trading near the upper boundary of this range. From here, two main scenarios are in focus:
Scenario 1: A confirmed breakout above the range high could trigger a continuation toward the specified upside target.
Scenario 2: Price may correct toward the range support area, and from there, buyers could step in again and push price higher.
Therefore, waiting for confirmation is essential before entering any position, while proper risk management remains key.
Don’t forget to like and share your thoughts in the comments! ❤️

traduce lo que te pondre de español a ingles ¡Entendido! Estoy We see an excellent daily structure of accumulation in Asia and London, with a New York reaction in a liquidity zone to trigger a reversal.

Gold getting ready for next Major Bull RunGOLD Getting ready for the next bull run.
Bull run with little pullback. Levels mentioned- www.tradingview.com
Levels brought up, with technical analysis, including Fib levels at various intervals, previous trend moves, support and resistance levels.
Note: This is purely my idea, I am using for my trades. Use your thoughts before executing your trades.
MCX:GOLD1!

Ethereum explosionOn the weekly timeframe, Ethereum is still oscillating within the movement steps of the previous cycle. After a significant upward wave, the price has entered a corrective phase and is now in important long-term support zones. These areas have played a key role in market phase changes in past cycles and can once again become points of price reaction.
From a market correlation perspective, during periods when Bitcoin enters a bearish phase, Ethereum usually corrects more sharply, as liquidity tends to exit altcoins first. Therefore, Bitcoin weakness can put additional selling pressure on Ethereum and increase its volatility range.
Alongside technical structure, risks in international markets, monetary policies, and geopolitical tensions can intensify volatility and rapid movements in the cryptocurrency market. In such conditions, risk management, a cyclical perspective, and avoiding impulsive entry are particularly important for long-term investors.

SFM Swing Trade!I am long and hoping we hold this level. I expect us to test $117 as it is a huge yearly fib level that will draw price up like a magnet. If we go down a few more dollars per share, I would reconsider this play. Long for now!

Trading balanceThe price of the asset has rebounded from the balance zone. With the prospect of growth into the resistance zone.

MSTR - How to profit from a $140 short target🔱 The MS ponzi is taking its toll. 🔱
I’m not laughing, because it’s genuinely unfortunate for everyone who believed in this scam.
But today, I don’t want to rant about that.
I want to show how one could profit from a potential drop of more than $100.
As an Andrews Pitchfork trader, I know there’s roughly an 80% chance that price will reach the centerline. From there, price either reverses in the opposite direction or breaks through the centerline to continue its journey.
That’s exactly what happened with MSTR.
You can see how the price first reached the centerline, held there a few times, and then broke it. Since then, it’s been following the rulebook by moving further to the downside.
Now, there’s another rule worth remembering:
price often tests or retests the line it just broke.
In our case, that line is the centerline.
This means we could be lucky enough to get a pullback to the centerline, and that would be a good level to consider shorting.
The target is usually the opposite line of the centerline, which in our case is the L-MLH (Lower Median Line Parallel).
👉 If you want to learn the full framework and its rules, check the links for free material.
I hope this helps many of you, and I wish you all good profits.

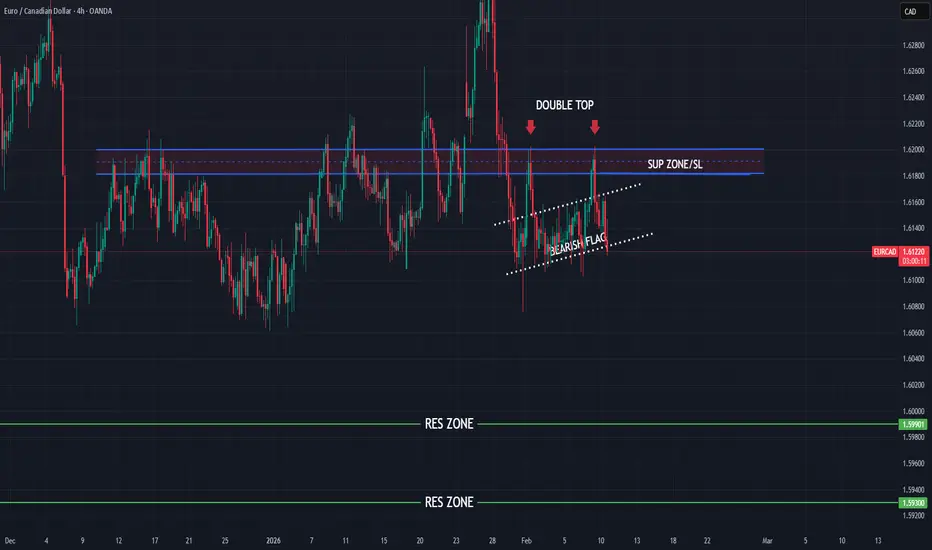
EURCAD bearish view
OANDA:EURCAD interesting chanrt, currenly price in BEARISH FLAG, we are have and bounces on sup. zon, where will put and DOUBLE TOP pattern, from here having higher bearish expectations.
SUP zone: 1.61800
RES zone: 1.59900, 1.59300
Bitcoin explosionOn the weekly timeframe, Bitcoin is still fluctuating within the framework of past movement cycles, and its price behavior closely resembles the mid-phase of the previous cycle. After a strong upward wave, the market has entered a phase of correction and distribution and is now in a structurally sensitive long-term zone.
The identified support levels can play a key role in determining the future path; maintaining these areas increases the likelihood of the uptrend resuming as the cycle continues, while losing them could trigger a deeper correction.
From a risk perspective, the current conditions of global markets, central bank monetary policies, and geopolitical tensions can lead to increased volatility and unpredictable movements. Therefore, in long-term scenarios, risk management, capital allocation, and avoiding emotional decision-making are highly important.

Resistance 5141 - Fibo 0.618 , GOLD today Related Information:!!! ( XAU / USD )
Indirect negotiations between the United States and Iran over the future of Tehran’s nuclear program concluded on Friday with a broad consensus to pursue a diplomatic track. The outcome has helped to alleviate fears of a potential military escalation in the Middle East, lifting investor confidence and reinforcing risk-on sentiment. As a result, capital has rotated away from traditional safe-haven assets, including gold, during the Asian session on Tuesday.
Commenting on the talks, Iranian Foreign Minister Abbas Araghchi characterized the eight-hour discussions as a constructive first step conducted in a positive atmosphere. US President Donald Trump also described the negotiations as “very good,” adding that a follow-up meeting is expected to take place early this week.
personal opinion:!!!
Gold prices are primarily awaiting NF news this week, with accumulation and a potential rebound back to the 5141 resistance level according to the 0.618 Fibonacci retracement.
Important price zone to consider : !!!
Resistance zone point: 5086, 5141 zone
Support zone : 4967 , 5000 zone
Follow us for the most accurate gold price trends.

USDJPY review for todayA Brief Analysis of USDJPY making key moves. We look at longer term structure before moving into short term structure showing the full situation.
This could be a turning point for JPY strength with politics going on. Interesting times.

`bitcoin await breakout#BTCUSD price await 69900 for bullish trend, after break there it will reach 70545 which shows another trend on H4. Valid breakout there will push price to 72k,74k
Buy stop 69900, target 72k,74k, SL 68700.
Below 68200 break holds sell continuation till 65k

General Market Overview and Focuses for the WeekLooking at general overview of where things stand, what my focuses are and reaching out in friendship if you guys want to network.
