GIFTNIFTY at a GLANCE.GIFTNIFTY Overview
GIFT Nifty is a derivatives index based on the Nifty 50 , traded on the NSE International Exchange (NSE IX) within Gujarat International Finance Tec-City (GIFT City ), India’s first International Financial Services Centre (IFSC). It serves as India’s international gateway for equity futures trading, providing foreign investors access to Indian markets with extended trading hours and flexibility.
What is GIFT Nifty
GIFT Nifty replaced SGX Nifty (which was traded on the Singapore Exchange) and began operations from July 3, 2023 . The transition aimed to bring offshore derivative trading back to India under a regulated domestic framework managed by the International Financial Services Centres Authority (IFSCA).
The index tracks the top 50 NSE-listed companies using a free-float market capitalization methodology, mirroring the Nifty 50. It is denominated and traded in US dollars, offering two trading sessions—
• Morning: 6:30 AM to 3:40 PM IST
• Night: 4:35 PM to 2:45 AM IST
This 21-hour structure aligns closely with global markets, improving accessibility for foreign investors.
Purpose and Function:
GIFT Nifty allows global investors to trade in Indian equities without exposure to local currency risk or registration with domestic regulators. It acts as:
• A hedging tool for institutions and large investors managing India-related portfolios.
• A predictive indicator for the Indian market’s opening direction, similar to how SGX Nifty once operated.
• A bridge for cross-border investment flows, contributing to India’s ambition of becoming a global financial hub through GIFT City.
Significance and Recent Performance
GIFT Nifty has rapidly gained volume and global traction. In May 2025, its monthly turnover reached USD 102.35 billion, marking record growth and signaling strong global confidence in India’s financial infrastructure. The platform offers tax incentives, seamless international fund transfer, and advanced trading technology to attract global funds to Indian assets.
Connection to GIFT City
GIFT City, located near Gandhinagar, Gujarat, houses India’s first IFSC and serves as the operational base for GIFT Nifty. The city hosts over 550 global financial entities, including major banks, fintechs, and exchanges. It integrates world-class infrastructure with tax-friendly regulations and aims to make India a major fintech and capital markets hub.
In essence, GIFT Nifty marks India’s evolution into an international financial powerhouse, offering liquidity, innovation, and global participation in India’s equity markets through a domestic but globally integrated platform.
🌡️Plot Levels Using 3 Min, 5 Min Time frame in your Chart for Better Analysis
L#1: If the candle crossed & stays above the “Buy Gen”, it is treated / considered as Bullish bias.
L#2: Possibility / Probability of REVERSAL near RLB#1 & UBTgt
L#3: If the candle stays above “Sell Gen” but below “Buy Gen”, it is treated / considered as Sidewise. Aggressive Traders can take Long position near “Sell Gen” either retesting or crossed from Below & vice-versa i.e. can take Short position near “Buy Gen” either retesting or crossed downward from Above.
L#4: If the candle crossed & stays below the “Sell Gen”, it is treated / considered a Bearish bias.
L#5: Possibility / Probability of REVERSAL near RLS#1 & USTgt
HZB (Buy side) & HZS (Sell side) => Hurdle Zone,
*** Specialty of “HZB#1, HZB#2 HZS#1 & HZS#2” is Sidewise (behaviour in Nature)
Rest Plotted and Mentioned on Chart
Color code Used:
Green =. Positive bias.
Red =. Negative bias.
RED in Between Green means Trend Finder / Momentum Change
/ CYCLE Change and Vice Versa.
Notice One thing: HOW LEVELS are Working.
Use any Momentum Indicator / Oscillator or as you "USED to" to Take entry.
⚠️ DISCLAIMER:
The information, views, and ideas shared here are purely for educational and informational purposes only. They are not intended as investment advice or a recommendation to buy, sell, or hold any financial instruments. I am not a SEBI-registered financial adviser.
Trading and investing in the stock market involves risk, and you should do your own research and analysis. You are solely responsible for any decisions made based on this research.
"As HARD EARNED MONEY IS YOUR's, So DECISION SHOULD HAVE TO BE YOUR's".
Do comment if Helpful .
In depth Analysis will be added later (If time Permits)
Beyond Technical Analysis

XAUUSD Trading Setup - 24 Oct 2025
Monitoring a potential buy zone for #XAUUSD on the hourly chart. Key level at ~4,004,702 with a logical stop loss at 3970. Today's data release could be the catalyst. #GoldTrading #Forex #TradingSetup

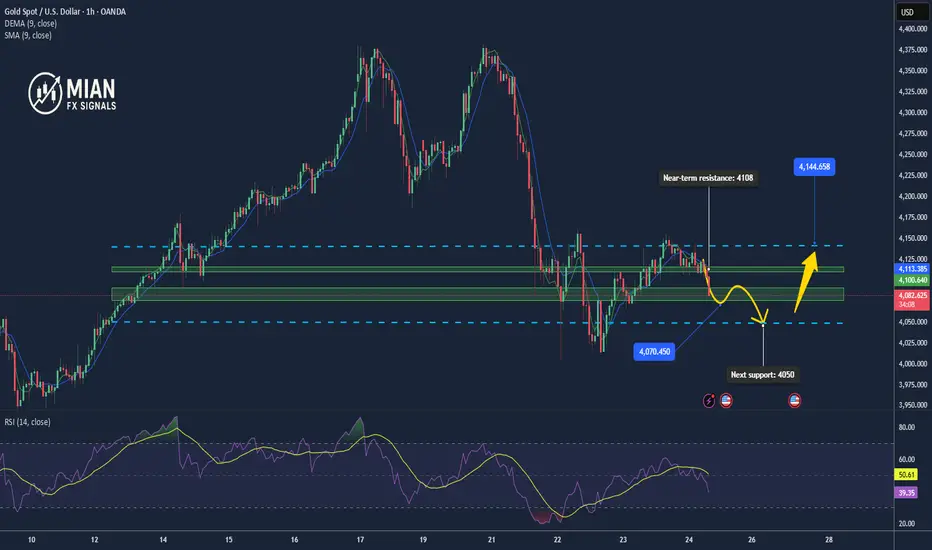
Gold weakens, retesting key 4080 supportMarket Overview
After failing to hold above the 4115–4120 zone, gold (XAU/USD) has turned lower toward 4085, signaling the loss of short-term recovery momentum.
Profit-taking pressure increased as U.S. bond yields rose again and traders turned cautious ahead of the upcoming U.S. PCE data.
Buyers are now defending the 4080–4078 support area, which will be crucial in determining the next market direction.
📊 Technical Analysis
• EMA50 (H1): 4107 → price now trading below EMA50, indicating a clear correction phase.
• EMA200 (H1): 4126 → remains the main resistance until a firm close above it.
• RSI (H1): dropped to 40, showing bearish momentum dominance.
• Near-term resistance: 4108 – 4115
• Upper resistance: 4130 – 4142
• Immediate support: 4080 – 4075
• Next support: 4062 – 4050
On the H1 timeframe, a bearish engulfing pattern is forming — a signal that deeper downside could follow if 4080 is broken.
💡 Outlook
The short-term trend has shifted back to neutral-to-bearish.
If price closes below 4078 (H1), gold could extend losses toward 4062 – 4050.
Conversely, a bullish reversal candle around 4080–4078 may trigger a rebound toward 4108–4115.
🎯 Trading Strategy
🔺 BUY XAU/USD: 4053 – 4050
🎯 TP: 40 / 80 / 200 pips
🛑 SL: 4047
🔻 SELL XAU/USD : 4108 – 4112
🎯 TP: 40 / 80 / 200 pips
🛑 SL: 4116
BANKNIFT (Spot) Intraday & Swing Levels for 27th Oct 2025Today BankNIFTY (Spot) Made LOW @ 57482.05 (Mentioned USTgt @ 57477.65 Difference JUST 4.4 points ) and Covered 259+ points (at Lower Level of "HZS#1")
Can I say Level Works. (Watch Previous Posts as Back testing.)
🚀 "WEEKLY Levels" mentioned in BOX format.
🌡️Plot Levels Using 3 Min, 5 Min Time frame in your Chart for Better Analysis
L#1: If the candle crossed & stays above the “Buy Gen”, it is treated / considered as Bullish bias.
L#2: Possibility / Probability of REVERSAL near RLB#1 & UBTgt
L#3: If the candle stays above “Sell Gen” but below “Buy Gen”, it is treated / considered as Sidewise. Aggressive Traders can take Long position near “Sell Gen” either retesting or crossed from Below & vice-versa i.e. can take Short position near “Buy Gen” either retesting or crossed downward from Above.
L#4: If the candle crossed & stays below the “Sell Gen”, it is treated / considered a Bearish bias.
L#5: Possibility / Probability of REVERSAL near RLS#1 & USTgt
HZB (Buy side) & HZS (Sell side) => Hurdle Zone,
*** Specialty of “HZB#1, HZB#2 HZS#1 & HZS#2” is Sidewise (behaviour in Nature)
Rest Plotted and Mentioned on Chart
Color code Used:
Green =. Positive bias.
Red =. Negative bias.
RED in Between Green means Trend Finder / Momentum Change
/ CYCLE Change and Vice Versa.
Notice One thing: HOW LEVELS are Working.
Use any Momentum Indicator / Oscillator or as you "USED to" to Take entry.
⚠️ DISCLAIMER:
The information, views, and ideas shared here are purely for educational and informational purposes only. They are not intended as investment advice or a recommendation to buy, sell, or hold any financial instruments. I am not a SEBI-registered financial adviser.
Trading and investing in the stock market involves risk, and you should do your own research and analysis. You are solely responsible for any decisions made based on this research.
"As HARD EARNED MONEY IS YOUR's, So DECISION SHOULD HAVE TO BE YOUR's".
Do comment if Helpful .
In depth Analysis will be added later (If time Permits)

USDCHF I Monthly CLS I Model 2 - Big swing require patienceHi friends, new range created. As always we are looking for the manipulation in to the key level around the range. Don't forget confirmation switch from manipulation phase to the distribution phase to make the setup valid. Stay patient and enter only after change in order flow. If price reaches 50% of the range take partial or full close.
🧩 Complete proces and Strategy explained 👇 Click Below
🎯 Why your market approach also should be mechanical ?
NO Fixed Mechanical Trading Logic - You are guessing random patterns
NO Defined trading plan - Every trade different logic
NO Same logic in each trade - Not possible to backtest
NO Backtests on at least 300 trades - Not knowing Statistics
➡️ No Statistics ➡️ No Edge ➡️ Mindset ProblemS
🧠 Core of mindset problems
If you don't know your statistics on large enough data sample. You don't know your probabilities of win rate once the losing streak happen and it happens to every strategy. You will start doubting, hesitating to take next trade because you don't know statistics of your losses. In the end you will be doubting strategy and then jump to different one. You will be in the endless loop for years, looking for new better strategy. 👊 Your ultimate goal as a trader is not to be a generalist who knows 10 000 patterns. But rather create one system with narrowed criteria of each element of the trade to remove subjective and emotional decisions as much as possible and stick to this system no matter what. Practice it 10 000 times become a MASTER.
✨ Trading Mastery is reflection of your life
Have a longterm plan, No Alcohol & Drugs, Ignore others, Focus on your journey , Backtest regularly, Review your weeks, Journal mistakes, Exercise, Sleep well, Read books, Walks in nature (no phone) , Meditate, Reduce social media time, Spend time with family, Live Life.
Trading is hard, but not impossible. I believe in you 💪
David Perk aka Dave Fx Hunter

5 Essentials of Trading Success
Trading is the greatest roller coaster you’ll ever ride.
Trading has its thrills, challenges, and endless potential for growth.
But, before you hit “Buy” or “Sell,” it’s crucial to lay down a solid foundation.
Too many traders jump in without preparation, and without knowing the real life variables.
When things go great, they feel normal and you feel in charge.
When things go bad, you feel it’s the end of the world.
So you need to learn to harness each of the 5 essentials to trading success.
Essential #1: Build a Solid Foundation of Knowledge
You wouldn’t drive a car without knowing the rules of the road, right?
Trading is no different.
Before placing your first trade, you’ll need to understand the key concepts and market basics that will serve as your roadmap.
Key areas to cover include:
Market types:
Know the difference between stocks, forex, commodities, and cryptocurrencies. Know which is the best stock screener. Also you need to know which markets will work for you and your trading personality.
Trading terminology:
Terms like “bearish,” “bullish,” “short-selling,” “leverage,” and “margin” might sound like jargon now, but they’ll soon become your everyday vocabulary.
Order types:
Limit orders, market orders, stop-loss, take-profit. Each of these orders serves a specific purpose. Mastering them is essential for making controlled and effective trades.
Essential #2: Select what you want to trade first: The Art of Asset Allocation
Trading is thrilling, but let’s face it.
No one knows what the market will do tomorrow.
That’s why choosing the right mix of assets—and learning the art of asset allocation—is crucial for long-term success.
What does asset allocation mean in practice?
Diversify your portfolio: Don’t put all your eggs in one basket. Invest and trade across different asset classes to spread out risk.
It’s better to trade different portfolios with stocks, Forex, indices and even commodities.
Successful trading isn’t about picking one “winning” asset.
It’s about managing risk and creating a balanced portfolio that can weather market storms.
Diversification is KEY!
Essential #3: Risk Management: Strategies to Protect Your Capital
If you only remember one thing from this article, let it be this:
Risk management is your best friend in trading.
Not only do you learn how to be a trader, but also a risk portfolio manager.
A smart trader doesn’t only think about potential gains—they think about how to protect their capital when things don’t go as planned.
Simple, powerful ways to manage risk include:
Set stop-loss orders: Automatically sell a position when it drops to a certain price to minimize losses.
Use position sizing: Avoid putting too much of your capital into a single trade. Limit each trade to a small percentage of your total funds—usually no more than 0.5%-2%.
Apply the “2% rule”: Never risk more than 2% of your capital on a single trade. This can help prevent one loss from wiping out your progress.
Remember, every trader has losses; it’s part of the game.
But with a solid risk management strategy, those losses won’t be catastrophic.
Essential #4: Charting the Path: Introduction to Technical Analysis
Charts are a trader’s treasure map. Learn to interpret them, and you’ll have insights into market trends, price movements, and potential buy/sell signals. Technical analysis allows traders to make data-driven decisions rather than relying on gut feelings.
Key tools for technical analysis:
Candlestick patterns: These can show trends, reversals, and market sentiment. Patterns like “doji,” “hammer,” and “engulfing” candles can offer powerful insights.
Indicators: Tools like moving averages, RSI (Relative Strength Index), and MACD (Moving Average Convergence Divergence) help you assess price momentum and potential reversal points.
As you might know by now. I like to stick to three indicators: Breakout patterns, 2 Moving Averages and Trend lines.
We need to learn to simplify our strategy because we will be following it over our entire trading career.
Trendlines: Drawn on charts, trendlines reveal price direction and potential breakout or breakdown levels.
Essential #5: The Psychology of Success: Developing a Trader’s Mindset
Trading isn’t just about strategies and technical skills; it’s also a mental game.
Emotions—fear, greed, EGO, frustration — can interfere with sound decision-making.
If you can’t manage your mind, you can’t manage your portfolio.
And that’s why it’s essential to develop a mechanical, professional and calm mind when trading.
Developing a disciplined mindset is what separates successful traders from those who burn out.
Conclusion
Let’s sum up the 5 ESSENTIALS to trading success.
Essential #1: Knowledge First: Understand trading terminology, market types, and order types.
Essential #2: Asset Allocation: Diversify your portfolio based on your risk profile.
Essential #3: Risk Management: Protect your capital with stop-losses, position sizing, and the 2% rule.
Essential #4: Technical Analysis: Learn chart patterns, indicators, and trendlines to guide decisions.
Essential #5: Trader’s Mindset: Control emotions, maintain discipline, and focus on long-term success.
Trading isn’t just a skill—it’s an adventure that rewards preparation, patience, and resilience.
Keep learning, stay focused, and remember: your success is built one trade at a time.
BTC accumulates and starts to recoverBitcoin (BTC/USD) – Daily Analysis
BTC continues to trade within a broad ascending channel, currently rebounding strongly from the key demand zone around 106,000–108,000. This zone has acted as a major liquidity area where buyers have repeatedly stepped in to defend price.
After forming a double rejection at the lower channel boundary, BTC has reclaimed the EMA 34 and is now attempting to stabilize above 110,000, signaling early bullish recovery momentum.
If buyers can maintain price action above 110,000, the next resistance levels to watch are:
113,000–114,000: confluence of EMA 89 + prior structure resistance.
126,000–127,000: upper trendline of the ascending channel and potential medium-term target.
Technical Outlook:
Price respected long-term ascending channel support.
EMAs show potential for a bullish crossover if momentum continues.
Higher low formation supports a recovery scenario.
Bullish Scenario:
Holding above 110,000 would confirm strength, with possible continuation toward 113,000 → 126,000.
Bearish Scenario:
Failure to hold 108,000 could trigger a deeper retracement toward 106,000 or even 102,000 (next demand zone).

Nekkar at 10 Year High at 12 - Danske Bank with BUY rating at 18Nekkar weekly chart
Huge sell transaction in september 2024 has taken a long time to absorb, but the stock is finally presenting a bullish movement to the upside that could breach the 10 year high point at around 12 NOK.
Danske Bank recently published BUY recommendation with tp 18 NOK.

REVEALED: What REAL Trading isWhat is Financial Trading in a nutshell?
For the last 20 years I’ve summed up trading as just ONE BIG AUCTION.
It sounds like a fast-paced, high-risk, Wall Street movie scene with shouting brokers and skyrocketing graphs.
But, here’s the truth:
Trading is the most relaxing thing – when done right!
It’s a lifestyle, a process, and a mindset.
It’s one thing where YOU can take your finances on an exciting adventure — if you do it right.
Whether you’re a complete newbie or a seasoned trader, here is a refresher to dive into what trading really is.
Trading Is More Than Just an Auction of buying or selling…
Let’s clear up one thing first.
For the last 20 years I’ve summed up trading as just ONE BIG AUCTION.
And yes it is one big market of buying and selling – but that’s only part of it.
TRADING is all about solving a puzzle of analyzing probabilities, managing risks, and navigating uncertainty.
Every time you enter a trade (buy or sell), you’re making an educated guess on where the market is LIKELY to go next.
And you’re placing a bet on human behavior — how millions of people around the world (with their emotions, news reactions, and strategies) will affect the price of an asset.
That’s the technical side of trading. Here’s where I want you to integrate trading into your life…
Trading Is A Lifestyle
It’s not just about making money — it’s about integrating trading into your lifestyle.
You need to find the right markets, time, time frame, styles, strategy and approach.
Trading is like hitting the gym; it requires discipline, consistency, and a whole lot of sweat equity.
And just like you don’t get a six-pack or lose weight after ONE workout.
You shouldn’t expect to master trading overnight.
It’s a routine you build day by day.
A typical trading day might include:
Pre-market analysis (Weekly bias):
You need to check what’s happening in the world with other markets with both Asian, American, European and even London session.
You also need to look at the US Economic Calendar to see what news is arising for the week.
Analyse and Execute trades:
Once done the pre analysis, you need to do the actual analysis. See what trades are lining up according to your proven strategy. And if anything looks good to go EXECUTE.
Review and track your trades:
This is where you will reflect on what went right and what went wrong. This is where you’ll track and review your trades that lined up to add to your journal.
The key takeaway: Trading isn’t just what you do; it’s who you become.
Trading Is a Forever Game
When it comes to trading, think long-term.
Like, REALLY long-term. Because trading is a forever game.
Unlike sports with seasons or video games with levels, trading doesn’t end.
The markets will be there tomorrow, next week, and 100 years from now.
And as a trader, your mission is to stay in the game for the long haul.
That means managing your risk, protecting your capital, and always looking to improve your skills.
Trading Is A Business Where YOU Are The Boss
The beauty of trading?
You’re in control.
Trading is a business, and you are the CEO.
You call the shots, decide when to enter and exit trades, and ultimately, you take control of your financial destiny.
Like any business, trading requires:
Planning and strategy:
Risk and reward management:
Tracking performance and improving:
And, just like in any business, you’ll make mistakes.
But those mistakes are not failures; they’re lessons.
You learn from them, adapt, and get better. That’s what makes trading such an empowering journey.
Final Words:
Financial trading is more than a job, a hobby, or a side hustle.
It’s a process-driven approach to decision-making, a lifestyle to live, a forever game to play, and a business where you’re in charge.
If done right, trading can be one of the most rewarding pursuits you’ll ever undertake.
Key Takeaways
Trading is a process: Follow a set strategy, criteria, and rules for success.
Trading is a lifestyle: Incorporate trading into your daily routine and stick with it consistently.
Trading is a forever game: It’s not a one-time event; it’s a lifelong pursuit.
Trading is a business: You’re the CEO — plan your moves, manage your risk, and take charge of your financial destiny.

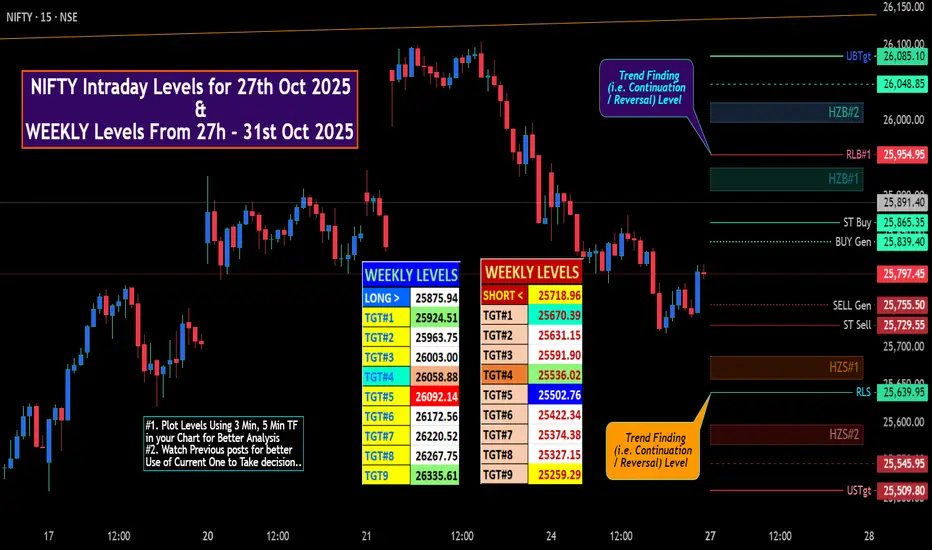
NIFTY Intraday & Swing Levels for 27th Oct 2025🚀 "WEEKLY Levels" mentioned in BOX format.
🌡️Plot Levels Using 3 Min, 5 Min Time frame in your Chart for Better Analysis
L#1: If the candle crossed & stays above the “Buy Gen”, it is treated / considered as Bullish bias.
L#2: Possibility / Probability of REVERSAL near RLB#1 & UBTgt
L#3: If the candle stays above “Sell Gen” but below “Buy Gen”, it is treated / considered as Sidewise. Aggressive Traders can take Long position near “Sell Gen” either retesting or crossed from Below & vice-versa i.e. can take Short position near “Buy Gen” either retesting or crossed downward from Above.
L#4: If the candle crossed & stays below the “Sell Gen”, it is treated / considered a Bearish bias.
L#5: Possibility / Probability of REVERSAL near RLS#1 & USTgt
HZB (Buy side) & HZS (Sell side) => Hurdle Zone,
*** Specialty of “HZB#1, HZB#2 HZS#1 & HZS#2” is Sidewise (behaviour in Nature)
Rest Plotted and Mentioned on Chart
Color code Used:
Green =. Positive bias.
Red =. Negative bias.
RED in Between Green means Trend Finder / Momentum Change
/ CYCLE Change and Vice Versa.
Notice One thing: HOW LEVELS are Working.
Use any Momentum Indicator / Oscillator or as you "USED to" to Take entry.
⚠️ DISCLAIMER:
The information, views, and ideas shared here are purely for educational and informational purposes only. They are not intended as investment advice or a recommendation to buy, sell, or hold any financial instruments. I am not a SEBI-registered financial adviser.
Trading and investing in the stock market involves risk, and you should do your own research and analysis. You are solely responsible for any decisions made based on this research.
"As HARD EARNED MONEY IS YOUR's, So DECISION SHOULD HAVE TO BE YOUR's".
Do comment if Helpful .
In depth Analysis will be added later (If time Permits)
The Real 3 Thrills of Trading: (Hint: It’s Not When You Think)Trading.
It’s a game.
A challenge.
A journey.
It’s a lifestyle.
And yes having a passion to trade is half the battle won.
But it’s not just about winning.
If you feel thrill when you win a trade. Then you’re enjoying the wrong parts of successful trading.
If you’re in a winning streak and feel thrill – Same story.
Because you know the losses are inevitable.
And you know the drawdown is coming too.
So that’s why you need to enjoy the FULL journey…
And here’s where you should feel the THRILL for trading.
THRILL #1: When you survive the drawdown
Like I said earlier, your next drawdown is coming.
Your BIGGEST drawdown is coming.
So you need to embrace and prepare for these times.
I have gone through more drawdowns than you can imagine.
And yet my portfolio keeps heading to all time highs.
HOW?
Well you need to endure the drawdown.
You need to keep following your rules and strategy.
And when the market environment is more favourable, your portfolio will turn from down to up.
And it will continue to go up until you not only recover – but your portfolio breaks to all time highs.
And when you survive the drawdown – FEEL THRILL!
THRILL #2: Knowing your strategy works (through the good and bad)
The markets are like an ocean.
Waves come and go, the tide shifts, and sometimes there’s a storm.
If you go look at the US Economic Calendar you’ll know the market is about to swivel in ways you can’t even imagine!
The thrill doesn’t come from riding one good wave (winner).
It should come from taking every trade that lines up perfectly with the strategy.
If you followed your rule and criteria to a T – Feel THRILL that you are on the right path to success.
Regardless of whether the trade is a winner or a loser.
See the bigger picture and what it can do for you!
THRILL #3: The Love for the Game and the benefits of trading
Remember I said trading is more than just money.
Trading helps with everything in your life!
It teaches you to be a risk manager.
It teaches you how to toughen your mind.
It teaches you how to be disciplined, consistent.
And it teaches you how you can CREATE your own wealth without depending on a BOSS.
The Challenge, the Mental Toughness, and the Growth
And the thrill?
FINAL WORDS – Celebrate the Right Thrills
The thrill of trading isn’t about the quick wins, the big gains, or riding the market waves.
It’s about resilience. Mastery. Passion. Patience. And growth.
Well fall in love with what trading has offered and taught you, other than the money aspect.
It’s not just about making money; it’s about becoming better. Sharper. Wiser.
Every trade you take is a lesson.
Every loss is a learning opportunity.
And every time you wake up excited to face the market, that’s the thrill of passion.
Because trading isn’t just a job.
It’s a craft.
A skill.
A calling.
If you find yourself waking up early, excited to start your day, knowing full well there’s a challenge waiting for you—you’ve found the thrill.
If you find weekends are not ending early enough because you want to trade – that’s a thrill!
Let’s sum up some reasons to feel THRILL when trading.
THRILL #1: When you survive the drawdown
THRILL #2: Knowing your strategy works (through the good and bad)
THRILL #3: The Love for the Game and the benefits of trading
Do you agree and how has trading changed your life?
WHY Financial Markets Will Always ChangeChange is the only constant in the financial markets.
And that’s why it’s important to stay humble and grounded because everyday is a UNIQUE day to the markets and the pre market movers.
No matter how much experience you have, you can’t get too comfortable with the way things are.
Because we know they won’t stay that way for long.
The markets are like a living, breathing entity—constantly shifting, evolving, and transforming.
And now I want to explain why I believe the markets are ALWAYS changing.
REASON #1: The Fresh Faces of Trading
Continuous flow of new and old traders.
Every day, new traders enter the game while seasoned veterans continue to play.
This constant influx of fresh perspectives creates a dynamic market environment.
New traders bring innovative strategies, emotions, and decision-making processes into the market, while the veterans tweak their systems to keep up with ever-evolving trends.
And so the demand and supply is constantly shifting in new ways – which changes the markets style, moves and algorithms.
End of the day, the market is one big AUCTION as I have told my members for the last 15 years.
They’re influenced by the people who trade in them.
REASON #2: The Never-Ending Stream of New Information
New information – shining on the market
Here’s the thing: the financial markets thrive on information.
New data points, news reports, earnings releases, and economic indicators flow in non-stop, impacting prices and trends at every turn.
Sometimes there is good days with amazing news coming out.
Other days there is catastrophic news.
And then you get the mundane boring days with no reaction.
If a central bank announces an unexpected interest rate cut, or if a company releases disappointing earnings, the market is going to react swiftly.
Even geopolitical events and natural disasters play their part in shaping the direction of markets.
So no matter how much analysis you’ve done, be prepared for the fact that new info can change the game in an instant.
REASON #3: Micro, Macro, and Inner Fundamentals
New micro, macro and inner fundamentals
The fundamentals that underpin market movements are far from static.
On the micro level, individual companies are constantly evolving.
New product launches
Mergers and acquisitions
News and earning reports
Prospects
Leadership changes can all affect a stock’s price.
Zoom out a little, and you’ve got macro fundamentals.
These show the big-picture factors like:
Interest rates
inflation, and
unemployment rates,
All of which influence the broader economy.
REASON #4: Global Economies and World Events
World info from the economies
The financial markets are more interconnected than ever.
What happens in one part of the world now ripples through the rest of the global economy in minutes, not weeks.
A change in China’s trade policy can directly impact European markets.
An unexpected election result in America could influence the South African or UK equities.
REASON #5: The Endless Actions of Traders
Constant actions of traders around the world
Then, of course, we have the daily actions of traders around the world.
Every time a buy or sell order is placed, the market shifts.
I like to think of it as the Stock Market’s Butterfly-Effect.
These actions are a direct result of human behavior—our emotions, analysis, strategies, and even fear and greed.
When traders believe in a trend, they pile on, creating momentum.
But when panic strikes, markets can spiral down in a blink of an eye.
Since traders are constantly reacting to new information, the market flows like an ever-shifting river.
Conclusion
The financial markets are in a constant state of flux.
They will forever change and we need to learn how to evolve, adapt or die trying.
But there is one thing that is inevitable.
The markets will KEEP moving and trending. And for that, we will always be profiting in the medium to long term.
Let’s sum up why the markets will always change…
REASON #1: The Fresh Faces of Trading
Continuous flow of new and old traders.
REASON #2: The Never-Ending Stream of New Information
New information – shining on the market
REASON #3: Micro, Macro, and Inner Fundamentals
New micro, macro and inner fundamentals
REASON #4: Global Economies and World Events
World info from the economies
REASON #5: The Endless Actions of Traders
Constant actions of traders around the world

GBPNZD BUY IDEA!The overall trend of GBPNZD remains bullish. I’m looking forward to seeing more bullish price action develop away from the current market price. We can see how buyers has been in control of this market from the price of 2.25000. Current price as at the time this idea was published is 2.31946 Also, it’s important to note that we recently had a counter trend movement that started around the 2.3500 A buy opportunity is envisaged.

POWERFUL Quote about TradingHere is a quote I want you to write down and hold close to your heart.
Trading is a Game of Focus, Sheer Will, and Unstoppable Determination
Trading is not for the faint-hearted.
It’s a game of focus, sheer will, and the kind of determination that doesn’t back down when the market throws punches.
If you’ve been in the trading world long enough, you know it’s not about making a quick buck.
It’s about holding your ground when the waves get rough and staying in the game even when the winds are blowing against you.
Let’s break this down…
Focus Is Your Superpower
To succeed, you need to zero in on your strategy and trust the process, no matter how loud the noise around you gets.
Focus is what separates a good trader from a great one.
It’s about staying laser-focused on your plan.
Do not get rattled when the market throws a curveball.
If you’re jumping from one strategy to another or chasing every shiny new stock, you’re spreading your energy too thin.
And in trading, scattered focus equals scattered results.
How to Strengthen Your Focus:
Create a daily routine and stick to it. Consistency fuels discipline.
Set specific trading goals for each session.
Block out distractions. Social media can wait.
Review your trades regularly to keep your mind sharp.
Sheer Will Gets You Through the Tough Times
Let’s not sugarcoat it:
There will be rough patches.
Trading will test you.
Your willpower will be stretched like a rubber band, and sometimes it might snap.
But those who make it are the ones who refuse to quit.
There’s a misconception that the best traders are the ones who never lose. Wrong.
The best traders are the ones who keep getting back up.
You will lose trades.
It’s part of the game.
But if you have the will to persist, those losses become your greatest teachers.
Ways to Build Your Willpower:
Start small. Set short-term, achievable goals to build momentum.
Learn from each mistake. Losses are part of the learning curve.
Celebrate your progress, even if it’s slow.
Stay connected with other traders to keep motivated.
Determination is Your Guiding Force
What makes a trader stick to their plan even when everything seems to be going wrong?
Determination.
It’s that relentless drive to keep going no matter what.
It’s about having a clear vision of where you’re headed and refusing to let setbacks derail you.
Determination means playing the long game.
It’s easy to get discouraged after a few losses or slow weeks, but successful traders know that big wins take time.
You’ve got to be in it for the long haul.
Strengthening Your Determination:
Write down your trading goals and review them daily.
Make sure you have checked the US Economic calendar with your trading strat.
Remind yourself of why you started trading in the first place.
Don’t let a losing streak shake your confidence—adjust, don’t abandon.
Stay flexible but committed to your strategy.
Conclusion: Keep Grinding, Keep Growing
Trading is a game of focus, sheer will, and relentless determination.
It’s not easy, but if you can master these qualities, you’ll find yourself ahead of the pack.
Success in trading doesn’t come from luck or overnight gains.
It comes from grinding it out, day after day, with a sharp mind and an unbreakable spirit.
Remember, the markets will test you.
They’ll try to break your focus, test your will, and challenge your determination.
But if you stay committed, keep your focus razor-sharp, and push through the tough times, you’ll come out stronger, smarter, and more successful.
So, what are you waiting for?
Tighten up your focus, flex that willpower, and get ready to tackle the markets with unstoppable determination.

US30 Bearish Leg from $46,800Hi everyone,
Sharing a 15m US30 chart for you guys.
This morning, price traded above previous days high and then gave a bearish reaction.
On the shared chart I have the Asian Low (AL) marked out, which has not been swept or traded below yet.
So this could potentially be a good interim bearish target.
This current $46,800 price level could potentially act as a pivot point if the correct confluences form on the lower time frame such as the 5m chart.
Confluences @ $46,800:
- 61.8% FIB
- OB area
- 1h FVG area
Kind regards,
Aman

GOLD ON SELL#XAUUSD price will continue bearish on 2 times breakout below 4058, we expect price to multiple break there before more dropping.
Entry 4058 2 times breakout, target 4022, stop loss 4075.
Price can sell from Market price also. The bullish depends on the cpi data release.

EURUSD Short: Delta Imbalance ExecutionShort EURUSD Trade Explanation (Institutional Orderflow Approach)
Entered short as price reached a defined Point of Interest (POI) with Delta Imbalance in the upper consolidation, signaling aggressive seller absorption at liquidity overhead.
Structure validated by a prior imbalance zone, confirming supply.
Risk management executed with targets at 1:2 and 1:3 R:R breakeven zones, aligned with lower liquidity pockets and Delta Imbalance support.
Price action, volume and delta confirmed entry; trade managed as price reacted within institutional range extremes.
My discretionary order flow model system is called the Liquidity Convergence System

High CPI, Higher Markets: America’s Paradox of ConfidenceBy Giorgalexis
The CPI is high, inflation refuses to die — yet Wall Street keeps climbing.
Indices sit at all-time highs, the Fed is signaling possible rate cuts, and investors keep chanting the same mantra:
“We’re Americans. We can handle everything.”
Soft landing? ✅
Unemployment at 4.3%? “Totally fine.”
AI-driven construction and growth? “The new frontier.”
The narrative feels bulletproof — or at least that’s what we want to believe.
The Illusion of Strength
In global negotiations, a falling market equals weakness.
No U.S. president wants to appear vulnerable, especially with geopolitical rivals watching.
When the S&P 500 is breaking records, America looks unstoppable — confident, dominant, secure.
So everything must happen before the cracks start to show.
But illusions don’t last forever.
The Secret Recession
Beneath the headlines, the economy tells a different story.
Corporate margins are thinning, credit card delinquencies are creeping higher, and consumer sentiment is quietly deteriorating.
Liquidity is evaporating for small businesses, even as megacaps report “record profits.”
Everyone feels the slowdown — yet few are willing to admit it.
This is the Secret Recession: a quiet contraction hiding behind the noise of a bullish market.
The Gold Paradox
Even gold has joined the party — trading at all-time highs while stocks do the same.
That’s not normal.
Gold usually shines when fear dominates, not when markets are euphoric.
When both gold and equities rise together, it signals a market that’s swimming in liquidity but drowning in doubt.
Investors are hedging against something — maybe inflation that never really went away, maybe a Fed policy mistake, or maybe the silent recognition that global stability is more fragile than it looks.
Central banks keep buying gold, the dollar stays firm, and everyone pretends it’s business as usual.
But every ounce of gold at record highs is a vote of no-confidence — not in America’s power, but in its sustainability.
The Paradox of Confidence
The Fed faces a dangerous equation:
Cut rates too soon, and inflation re-ignites.
Hold them too high, and growth breaks.
Yet markets have priced in both — strong growth and imminent easing.
It’s a fantasy of eternal expansion.
AI will save productivity, rates will drop, earnings will rise, and geopolitics will magically calm down.
Until data proves otherwise.
Because once the market starts doubting the narrative, once data becomes stronger than politics, the illusion fades — fast.
How Long Can It Last?
For now, momentum is on America’s side.
Global capital still wants to flow into the U.S.
China and Russia may challenge the order, but Wall Street remains the global benchmark for optimism.
Still, confidence is not infinite.
Markets rise on belief — and collapse on doubt.
Gold already senses what equities refuse to see.
Final Thought
As traders, we live for momentum.
But even the strongest trend hides a reversal point.
When optimism turns into policy, and markets become diplomacy, it’s only a matter of time before reality reclaims the chart.


Flash Crash...Yea going over counts I've come to consider this a likely scenario - last move don't really make sense so it could be a B wave overshoot which would form an expanded flat type correction - C should land around 60-69k~ if this is correct.

EURCAD EUR/CAD 4H chart shows a bullish setup after a strong corrective move into a key demand zone. Price is currently rebounding from support around 1.6220–1.6250, suggesting potential for an upside continuation. A clean break and retest of the mid-zone could trigger momentum toward the 1.6400 resistance area — the marked target level. Buyers are expected to step in from the current demand zone, maintaining the bullish structure for a potential rally continuation.
"Thank you for your support! If you found this idea valuable or learned something new, please consider liking and leaving a comment. I’d really appreciate hearing your feedback and thoughts.

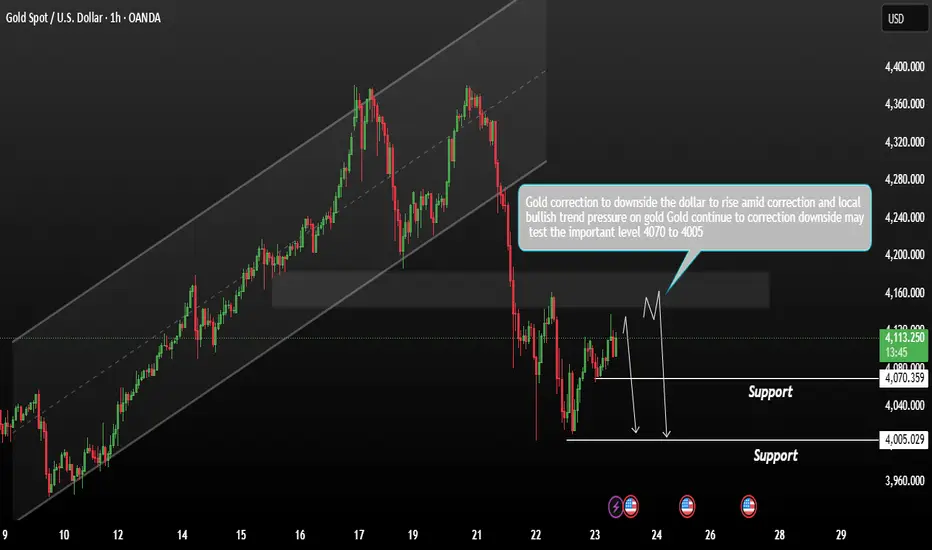
Gold forming a consolidation range What should Next?Gold prices continue to correct to the downside, forming a consolidation range near current levels. The market remains supported, but momentum is weakening as the US Dollar strengthens amid a local bullish trend.
As long as the dollar maintains its upward correction, downside pressure on gold is likely to persist. a break below the trading range support could trigger further declines toward the 4,070 4,005 zone (support area). This level may act as a potential retest zone for buyers. For now, it’s best to wait for price action to slow down near the lower boundary of the range before considering new trades — patience and confirmation are key to avoid false breaks.
You may find more datils in the chart,
Trade wisely best of Luck Buddies.
Ps; Support with like and comments for better analysis Thanks for Supporitng.
EURCAD Looking Bullish Trend to wardsThe EUR/CAD pair is currently in a bullish trend, consolidating after a recent pullback toward a key support zone. The euro has established a strong support area, indicating that buyers may soon regain control.
Although price is currently showing signs of a temporary decline, the broader trend remains upward. A bullish reaction from the current support area could trigger a rebound. However, traders should watch for a possible false breakout below the support before the next upward move If the price successfully reacts from the current level, the next resistance zone is expected between 1.6350 and 1.6500.
You may find more details in the chart.
Trade wisely best of Luck.
Ps; Support with like and comments for better analysis thanks for Supporting
