The Elephant Jungle 2/4/26 part 4Right now, the move is simple.
We trade the range and stay patient until the market gives us a clean breakout. No rushing. No forcing trades that aren’t there.
Like always, stay safe, use proper risk management, and wait for your levels and confirmations to show themselves. The jungle rewards discipline, not impatience.
Let price do the talking.
Beyond Technical Analysis

The Elephant Jungle 2/4/26 part 4So here’s the real question on the table, Are we in another PO3, but this time pushing back up toward at least 100k? It’s definitely starting to cook like we might be. We’ve already seen a sweep that fits the manipulation phase. Now the uncertainty kicks in. Do we get another sweep? Do we consolidate longer inside the manipulation box? Or does price finally start pressing higher and transition into the expansion phase?
That’s the part no one can force. All we can do now is wait, observe, and let price confirm. The jungle doesn’t rush, and neither should we.

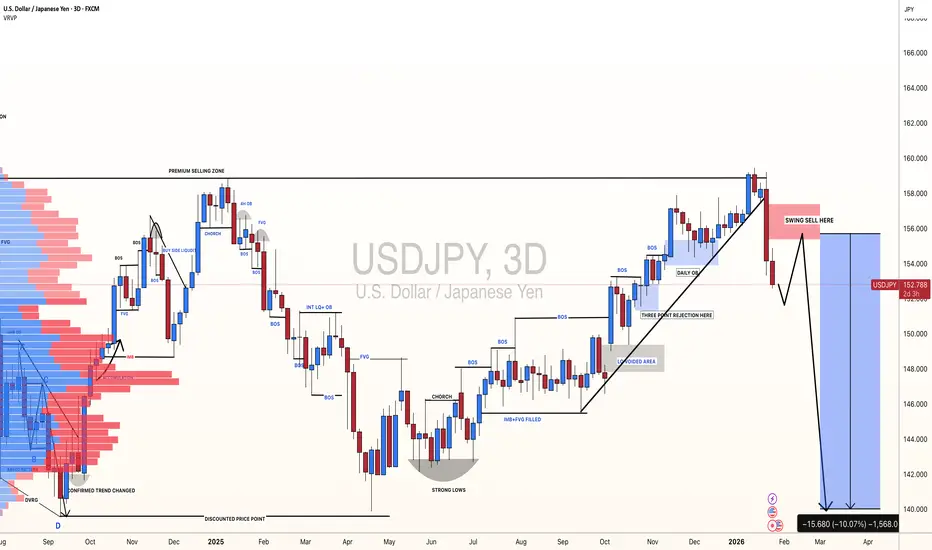
USDJPY: +1500 Pips Possible Swing Sell In Making?Dear Traders,
I hope you’re doing well. We have a fantastic selling opportunity that we believe could drop as much as 1500 pips. In our view, the US dollar is likely to continue plummeting while the Japanese yen might finally turn bullish after nearly a year of selling. This follows the US invasion of Venezuela and potential strict tariff changes in the coming days, all of which will significantly impact the USD. Furthermore, we have some important news this week that will likely shape our chart analysis.
If you enjoy our work, please like and comment. Follow us to receive notifications when we post analysis.
Team Setupsfx_
The Elephant Jungle 2/4/26 part 3If you go back and read the articles from months ago, you’ll notice we kept talking about a PO3 playing out. Well, It wasn’t fast. It wasn’t pretty. But it was patient. That PO3 took over 120 days to fully play out. We reached the objective, pushed through every obstacle along the way, and made it all the way through the expansion phase. This is exactly why context matters in the jungle. Price doesn’t move on our timeline. It moves when the work is finished. And when you zoom out, you can see that the structure we were waiting on didn’t fail, it delivered. Now the question isn’t what happened. The question is what phase comes next.

The Elephant Jungle 2/4/26 part 2Right now, it looks like the Bulls are going to have a tough time pushing straight back to ATH from here. With 2 fresh 1W Supply Ranges above us, the Bulls are going to have to duke it out with the Bears if they want to reclaim the top.
That said, if the Bears can get this month’s candle to close below the Macro Range, there’s a very real chance we see a bearish breakout from the Macro Range. But I wouldn’t count the Bulls out too quickly. If we start seeing the Bears apply more downside pressure, I expect the Bulls to show up with a second line of defense sitting at the Internal 1W Demand Range. That level is going to matter, and how price reacts there will likely decide whether this move turns into continuation, or just another shakeout in the jungle.

The Bitcoin Breakdown: Critical Levels to WatchBITMEX:BTCUSDT.P has suffered a 15% contraction week-over-week. We have pierced critical levels, including Michael Saylor’s MSTR Bitcoin cost basis.
While headlines focus on the immediate triggers such as Kevin Warsh’s nomination as Federal Reserve Chair, the structural rot that caused this crash began months ago.
If you are looking at the charts wondering why the floor fell out or where the new supports are, here is the breakdown of the hidden ‘10 Oct Pivot’ and the three specific price levels that now define the market structure.
The Fundamental Drivers Behind the Bitcoin Drop:
The sell-off wasn't just a reaction to news, but rather a collapse of a market structure that has been fragile for months.
1. The 10 Oct Pivot’: Liquidation Cascade & Market Maker Wipeout
To understand why Bitcoin capitulated to $74,500 this weekend, you must look back to 10 October 2025. This date marks the moment the correlation between risk assets broke. Gold went parabolic while Bitcoin began a slow, confused bleed. Crucially, this period triggered a massive liquidation cascade that bankrupted many key market makers. As these liquidity providers were wiped out, order book depth evaporated. This left Bitcoin structurally weak, hollow, and propped up only by fragile ETF inflows and leverage. When the macro environment shifted this week, the buffer usually provided by market makers did not exist to absorb the selling.
2. The Kevin Warsh Nomination
On 30 January, President Trump nominated Kevin Warsh as Federal Reserve Chair. Warsh represents a hawkish regime shift focused on balance sheet reduction. This signaled to the market that the Federal Reserve would no longer support the ‘debasement trade’ that had propelled asset prices higher, causing an immediate repricing of risk.
3. The Liquidity Fear From Government Shutdown
The final blow was the US government shutdown. With government operations halted, the market was gripped by a fear that the flow of new liquidity into the economy would completely stop.
Combined with Warsh’s nomination, the government shutdown created a worst-case scenario: a government that cannot spend and a central bank that refuses to print. This ‘fear of no new liquidity’ caused capital to freeze. Investors fled to cash. Without new money entering the system to support prices, the hollowed-out crypto market collapsed.
The 3 Critical Levels for BTC
Now that the leverage has been flushed (with over $2.5 billion in liquidations in a single weekend), we are left with a scarred chart. If you look at the price action specifically, the market is currently trapped between three distinct psychological zones.
The Saylor Line (Current Support: ~$76,000) The first and most immediate battleground is roughly $76,031. This is the estimated average cost basis of MicroStrategy’s massive Bitcoin treasury.For the first time in this cycle, Michael Saylor’s position is teetering on the edge of being underwater. The market knows this. The weekend wick down to $74,500 was a ‘stop hunt’—predatory traders trying to push the price low enough to trigger panic. But the line held.
As long as Bitcoin trades above this level, the corporate balance sheet narrative remains intact. If we lose this level for a sustained period, the psychological damage to retail investors—who view Saylor as the invincible bull—could be severe.
The Spot ETF Wall (Resistance: ~$84,000) If the Saylor Line is the floor, the ‘ETF Wall’ is the ceiling. The $84,000 to $85,000 range represents the cost basis for the billions of dollars that flowed into the US Spot ETFs over the last quarter.
These investors are not crypto natives. They are asset allocators and retirees. Right now, they are sitting on a loss. Human psychology dictates that when the price rallies back to their entry price, they will sell to ‘get out at breakeven’. This creates a massive wall of supply overhead. Until Bitcoin can decisively reclaim $84,000 and turn those holders back into profit, any rally is likely to be sold into.
2021 All-Time High at $69,000 If the contagion from the metals market continues and the Saylor Line breaks, there is only one level that matters: $69,000. This is the 2021 All-Time High. It is the structural ‘line in the sand’ for the entire multi-year bull market. A retest of this level would be painful. However, historically, retesting a previous cycle high is a generational buying opportunity.
What to Look Out For Next
As of today, the government shutdown has been resolved. However, Bitcoin remains in a precarious position. While traditional ‘safe havens’ are bouncing, crypto is lagging. Here’s what you need to watch:
The ‘Lag’ Signal (Gold vs. Bitcoin) : While Gold and Silver have rallied back strongly following the shutdown resolution, Bitcoin is still stuck in the mud, hovering near $78,000. This divergence is the most critical signal to watch. If metals continue to soar while Bitcoin stagnates, it confirms that the ‘liquidity vacuum’ in crypto is specific to the asset class (market maker failure) rather than just general macro fear. Bitcoin must catch up to the metals rally within the next 48 hours to confirm a bottom.
ETF Outflows vs. Stabilisation With the shutdown fear resolved , do ETF investors buy the dip or sell into the relief? Watch the daily flow data. If we see sustained outflows despite the government reopening, it suggests institutional confidence has been shaken by the Warsh nomination regardless of fiscal spending.
The $76k ‘Double Tap’ The market often tests a low twice . Expect a potential retest of the MicroStrategy cost basis ($76,052). If this level holds on a second test while Gold remains strong, it is a high-conviction buy signal. If it fails, the path to $69,000 opens up immediately.

The Elephant Jungle 2/4/26Yesterday, we left off inside the Inside Range, looking for some form of Wyckoff to play out. Our primary bias leaned toward accumulation, mainly because we already had two taps on the low of the range and one tap on the high. At the same time, we had a backup plan. If the Bulls decided to sweep the high of the range for a second tap before giving us that third tap on the lows, we’d be stepping into a 50/50 scenario, opening the door for a potential distribution instead.
Here’s where things got interesting. On Bybit USDT, we did not get that second tap into the high of the range. On Bybit USD, however, we did see a second tap into the high. Now, since Bybit USD is basically fake news like Fox Network we ain't going to count it (lmao just kidding)
But seriously, whether we count that second tap or not, price still delivered a Wyckoff Model 1 Accumulation. The Bulls clearly set up a line of defense off that fresh 1M Demand Range, and from there we saw price push back into the Macro Range and reclaim the Inside Range. So now the real question for today is simple, Will the Bears accept this move? Or will they try to put the Bulls back in their place, forcing price into a deeper mitigation within that 1M Demand Range Keep in mind, there’s still an internal 1W Demand Range sitting around 65k. Are the Bears willing to test the Bulls’ patience and drive price back down to that 65k level? Or is this the moment where the jungle shifts, and it’s up from here?

US30 | Below ATH Keeps Bearish Pressure ActiveUS30 | Below ATH Keeps Bearish Pressure Active
The Dow Jones is trading below its all-time high at 49590, keeping short-term pressure tilted to the downside unless buyers regain control on a higher timeframe.
Technical Outlook
As long as price remains below 49590, the index is expected to trade in a bearish mode toward 49240.
A break below 49240 would confirm bearish continuation, opening the way toward 48840.
On the upside, only a 4H candle close above 49590 would invalidate the bearish bias and support a bullish continuation toward 49985, followed by 50100.
Key Levels
• Pivot: 49590
• Support: 49240 – 48840
• Resistance: 49985 – 50100

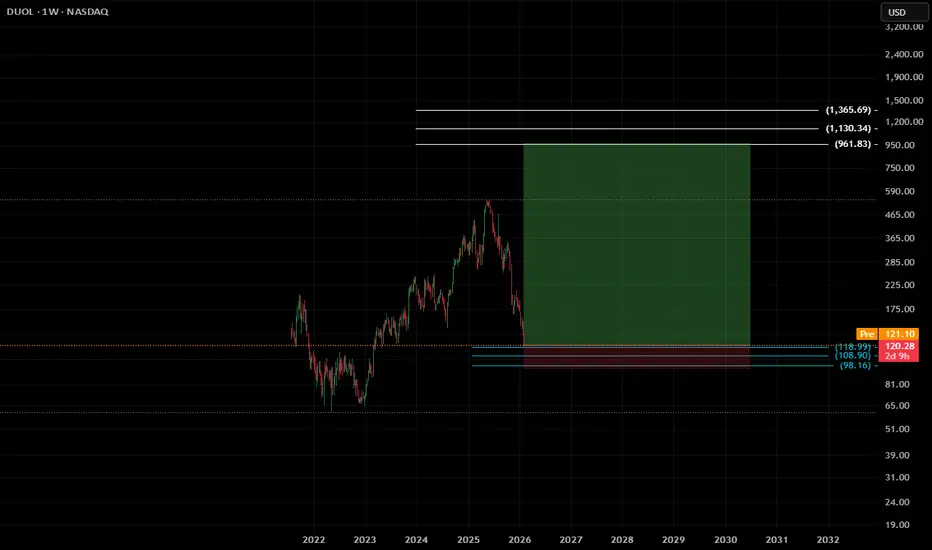
$DUOL , Setup Waiting for this setup for a few months now!!!
ENTRY : CMP
TP : on the chart
SL : If you wish
My SL is never a SELL, just an alarm to stop adding money and wait for better dca
Follow, Boost, Thank You !!
⚠️ Financial Disclaimer:
This post is not financial advice. I am not your financial advisor, your life coach, or your legally responsible adult.
Always do your own research and never trade based solely on internet comedy.
Wait for HL to print!SILVER Analysis
Closed at 85.169 (30-06-2026)
74 - 76 is an important Support zone.
if this level is sustained, we may witness Higher Low
printed around this level & the uptrend may continue.
Crossing 121 - 122 may expose new Highs.
However, Breaking 70 may bring the price towards 62 - 63 which
is the next Important Support level.

$AAOI , Huge Risk Great RewardENTRY : CMP
TP1 : 58,09
TP2 : 108,69
TP3 : 147,09
TP4 : Let It Roll!!!!!!
SL : If you wish
My SL is never a SELL, just an alarm to stop adding money and wait for better dca
Follow, Boost, Thank You !!
⚠️ Financial Disclaimer:
This post is not financial advice. I am not your financial advisor, your life coach, or your legally responsible adult.
Always do your own research and never trade based solely on internet comedy.

$CDND , setupENTRY : CMP
TP1 : 431,77
TP2 : 446,66
TP3 : 779,65
TP4 : 974,13
SL : If you wish
My SL is never a SELL, just an alarm to stop adding money and wait for better dca
Follow, Boost, Thank You !!
⚠️ Financial Disclaimer:
This post is not financial advice. I am not your financial advisor, your life coach, or your legally responsible adult.
Always do your own research and never trade based solely on internet comedy.

Are we Selling During NYC Session?Gold, oh Gold…
We love it most when it’s unpredictable, when it moves with no mercy and tests every ounce of our patience.
But is this pair truly heartless… or are we simply too quick to demand clarity before it’s ready to reveal direction?
During the London session, Gold has been consolidating and after some time it took a bounce don. Now, we wait.
Will it sell off…
or continue its original bullish path?
The next move is simple:
wait for the break, then the confirmation.
Only then will we know where Gold is heading.

$ADI , SetupENTRY : CMP
TP1 : 366,66
TP2 : 377,27
TP3 : 390,09
TP4 : Let it Roll
SL : If you wish
My SL is never a SELL, just an alarm to stop adding money and wait for better dca
Follow, Boost, Thank You !!
⚠️ Financial Disclaimer:
This post is not financial advice. I am not your financial advisor, your life coach, or your legally responsible adult.
Always do your own research and never trade based solely on internet comedy.

USDT Dominance Liquidity ReachAs I predicted months ago ( October 2025), the market needed to absorb a significant amount of liquidity before a sustainable move to the upside.
At this point, most of the required liquidity has been absorbed. With proper risk management, I believe this is a good area to enter a long position with at least 70% of the intended size. With higher risk tolerance, I will personally enter the final tranche, targeting a minimum 6-month outcome.

Hyperliquid: bull flag in play? key levels to watch aheadHyperliquid. Who’s riding this new perp beast or just watching from the sidelines? According to market chatter, the recent token launch plus growing derivatives volume keeps Hyperliquid in the spotlight, and today’s headlines about rising on-chain activity only added fuel to the narrative.
On the 4H chart we’ve got a classic post-pump chill phase: sharp vertical move, then a sideways pullback between roughly 31 and 35 that looks like a bull flag. Volume on the run-up was heavy and is now fading while RSI cooled from overbought back to the 50–60 zone - a healthy reset instead of a trend break. I’m leaning long, expecting liquidity grabs toward 32-31 and then a push through 34 with eyes on 36-38.
My plan: ✅ base case is that 31 holds as key support and price grinds higher toward 36 first, 38 if momentum returns. ⚠️ If we start closing 4H candles below 31 and especially under 29.7, I’ll treat it as a local top and look for deeper buys down in the lower green zones. I might be wrong, but I’d rather wait for the dip than FOMO into the last green candle at the highs.

Gold - Live Trade (Long) In the trade right now.
Gold came back into its uptrend. Waited for pullback to complete and structure to align. Entry conditions met
Stop below recent structure. Target at next key level.More than RR is 1:3.5.
Now it's just about letting it play out. Can't control what happens next, already made my decision at entry.
Trend will give multiple opportunities. My job is to wait for my conditions to align - not jump in because I'm scared of missing out.
Yes opportunities appear throughout the day. But if they don't show up during my trading hours, they're useless. We're humans we eat, sleep, have other stuff to manage. Can't watch charts 24/7.

Very strong bull run if price breaks 157.00Low volume node detected at around 157.00 until 157.75,
showing very strong bullish volume after IB of the London session,
stay alert for a retest at the IBH London session.
Good luck with your positions !

Gold Shows Short-Term Recovery Signs After a Sharp Decline📊 Market Overview:
Gold prices are surging today as safe-haven demand increases amid rising geopolitical tensions between the U.S. and Iran. Ongoing conflict concerns continue to boost demand for safe assets, pushing gold prices up more than 2% during the session and lifting spot gold above ~5,070 USD/oz. Fundamental forecasts also support a bullish outlook if rate-cut expectations persist and economic data comes in weaker than expected.
________________________________________
📉 Technical Analysis:
• Key Resistance Levels:
1. ~ 5,100–5,120 USD/oz – strong psychological resistance and current session high zone.
2. ~ 5,250–5,300 USD/oz – extended target area if price breaks above current highs.
• Nearest Support Levels:
1. ~ 4,900–4,950 USD/oz – short-term support in case of a pullback.
2. ~ 4,800–4,850 USD/oz – momentum support if a deeper correction occurs.
• EMA / Trend:
EMA 09: If price remains above EMA 09, it confirms a short-term bullish trend.
• Candlestick / Volume / Momentum:
Strong bullish candles with wide ranges reflect aggressive buying driven by geopolitical risk. Short-term momentum shows buying pressure dominating selling, with volume supporting the breakout above key psychological levels.
________________________________________
📌 Outlook:
Gold may continue to rise in the short term if:
• Geopolitical tensions persist
• The U.S. dollar weakens further
• Markets continue to price in additional Fed rate cuts
However, unexpectedly strong economic data or a more hawkish Fed stance could trigger a short-term correction before the main trend resumes.
________________________________________
💡 Trading Strategy:
🔻 SELL XAU/USD: 5,117 – 5,120
🎯 TP: 40 / 80 / 200 pips
❌ SL: ~ 5,127
🔺 BUY XAU/USD: 4,950 – 4,947
🎯 TP: 40 / 80 / 200 pips
❌ SL: ~ 4,940

Trends&Patterns, S/D and Logical fallacies.Logic: "that's a strong trend, price action is strong, therefor it will fly. There's also probability aspect to it, there's a high probability, though volatility ahead".
Fallacy: People forget that Price=Supply:Demand. You see a trend, learn to recognize patterns. But PRICE or the driver is the daily S/D function.
In strong trends, you have a combo of 1) people not selling. 2) strong demand. Price rallies.
//bottom line: A) you should probably learn these high probability patterns, setups. but still B) trade based on S/D function.
S/D is cyclical. hence somewhat predictable... ?

BITCOIN PREDICTION – GAME PLAN📊 Market Sentiment
Market sentiment is currently extremely bearish. We continue to see consistent outflows from Bitcoin ETFs. In addition, the Fear & Greed Index is sitting at 22 (Fear zone) and has remained there for some time.
Bitcoin has largely decoupled from the S&P 500 (US markets), and capital does not appear to be flowing into crypto at the moment. Unless a new and strong narrative emerges, I do not expect the market direction to change.
Today’s CPI data came in at 2.7% versus a 3.1% expectation, which could act as a positive catalyst for risk assets. We saw this effect clearly in U.S. equities; however, Bitcoin and the broader crypto market remained unresponsive. This further confirms my view that sentiment remains aggressively bearish.
📈 Technical Analysis
Price has been in a clear downtrend for some time. Over the past month, Bitcoin has been consolidating within a tight range.
In my opinion, this consolidation is more likely to resolve to the downside. While risk assets such as US100 continue to push higher, Bitcoin’s inability to follow reflects clear relative weakness.
📌 Game Plan – Prediction
I am monitoring two main scenarios:
Scenario 1 (Red Line – More Likely)
I expect price to decline toward $80,500, where we may see a short term bounce. However, I believe this bounce will fade, with the primary downside target at $74,500.
After price runs $74,500, I will be looking for potential long/buy opportunities.
Scenario 2 (Black Line)
Price first moves up toward $96,000, gets rejected from that level, and then closes back below it. From there, I expect continuation to the downside toward $80,500 and potentially $74,500.
💬 For deeper sentiment and strategy insights, subscribe to my Substack free access available.
This analysis is for educational purposes only and does not constitute financial advice. Always conduct your own research before trading or investing.

Daily structure marked for weekly bearish trend trackingWe see a manipulation structure marked just like last week; in fact, it is doing the same thing where we took the same entry. We could likely have a reversal for tomorrow in buys, but today the price dictates that it wants to continue with the bearish trend, where we have a clear daily structure where New York must exceed the last London high to look for the sell.

EUR/USD: European Inflation and U.S. Employment Set the ToneBy Ion Jauregui – Analyst at ActivTrades
EUR/USD opens the session under the influence of two key macroeconomic references: the Eurozone CPI and the U.S. ADP employment report. Both indicators directly affect market expectations for ECB and Federal Reserve policy, which remain the main driver of the pair. Eurozone inflation is expected at 1.7%, down from 1.9% previously, reinforcing the scenario of price moderation and increasing pressure on the ECB to continue its rate-cut cycle. A figure in line with or below consensus would keep the euro under pressure, limiting any sustained EUR/USD recovery. Only an upside surprise could provide temporary support to the single currency without changing the underlying bias.
In the U.S., the ADP report serves as a leading indicator of the labor market. Following the previous reading of 41,000 jobs, the consensus expects 46,000. A solid number would support the Fed’s cautious stance and keep the dollar relatively strong. In this context, the room for EUR/USD recovery would remain limited. Conversely, a clearly weaker reading could trigger short-term upward corrections.
The market continues to focus on the interest rate differential between the two economies. While slowing inflation in Europe reinforces a clearly dovish bias, U.S. employment resilience allows the Fed to delay the start of rate cuts. This imbalance continues to favor the dollar structurally against the euro.
Technical Analysis – TICKER AT: EURUSD
The Asian session started with a price recovery that extended into the European session, ahead of the Eurozone inflation release expected mid-morning, which could come in weaker than last month. Currently, the pair is trading in a range-high area; a break above 1.18853 could trigger another run to the highs. If the data disappoints, the natural evolution could be a retracement toward the Point of Control (POC) around 1.16500.
From a technical perspective, the short-term trend is bullish, with the price above the 50-period moving average. The RSI sits in neutral territory but could move toward overbought. The MACD shows a corrective bias, with its signal line above the histogram entering bearish territory. This suggests the current range top could act as a strong resistance this week.
In the short term, EUR/USD behavior will depend on whether the data confirms the market’s current expectations. Volatility may increase after the releases, but unless there is a clear shift in monetary policy expectations, the pair’s bias will remain conditioned by the relative strength of the dollar.
*******************************************************************************************
The information provided does not constitute investment research. The material has not been prepared in accordance with the legal requirements designed to promote the independence of investment research and such should be considered a marketing communication.
All information has been prepared by ActivTrades ("AT"). The information does not contain a record of AT's prices, or an offer of or solicitation for a transaction in any financial instrument. No representation or warranty is given as to the accuracy or completeness of this information.
Any material provided does not have regard to the specific investment objective and financial situation of any person who may receive it. Past performance and forecasting are not a synonym of a reliable indicator of future performance. AT provides an execution-only service. Consequently, any person acting on the information provided does so at their own risk. Political risk is unpredictable. Central bank actions can vary. Platform tools do not guarantee success.
