YatasYatas seems like completed wave B of the flat which is also a Flat itself...
Now i expect a sharp 5 waves to the downside,after that we can expect it to climb upwards.
Bist100

Bist 100 in a Flat correctionMinor degree wave 4 seems like it's forming a Flat which we seem like to be in Wave B of the flat.When it's completed than wave C of the flat will crash heavily.

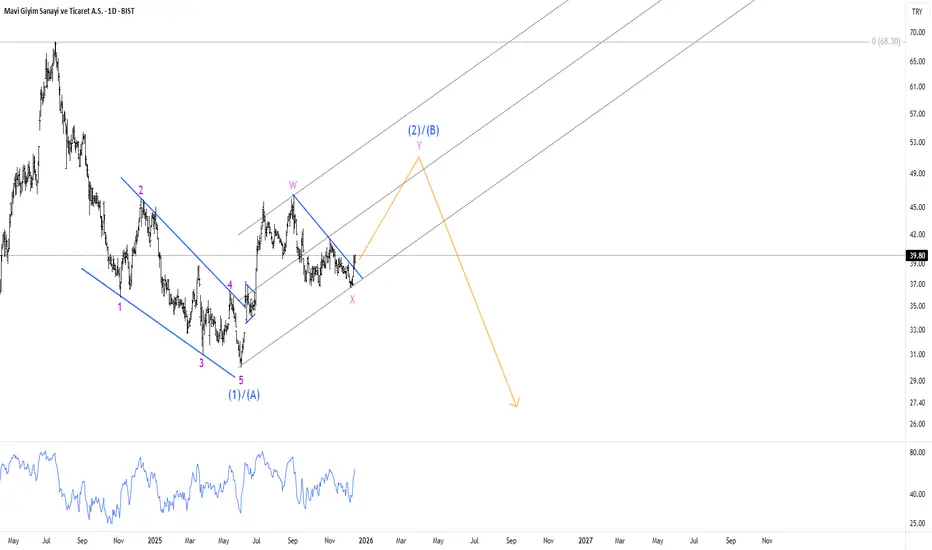
Mavi in a correctionmavi seems completed a diagnoal which may be Wave A or Wave 1 after the correction ends it should make new lows.
GUBRF Turkish stock In my opinion,Gubrf even if it makes new highs it seems like an under correction...Which in this case it seems like a big Flat correction,in this particular case wave A of the Flat also a flat itself...If that scneraio proven itself correct than it's a huge think...Many people belive small traders get caught up in the downside corrections by manipulations but i don't see it that way..
There are multiple patterns in EWP which repeats itself over and over again...We will see if my analysis is correct or not,i expect a 5 wave move down stongly after it completes wave B of the flat...
The other scneraio is that is not a flat but WXY correction means again move to the downside but the difference is it will not go down in 5 waves but 3...
Any case people should pay attention those scneraios.

Pgsus is about the end WXY correctionPegasus Airlines about the finish WXY correction as c of abc correction as an ending diagonal which is strict rules that wave 5 must be shorter than wave 3 so we have a clear stop loss point which is 190,5.

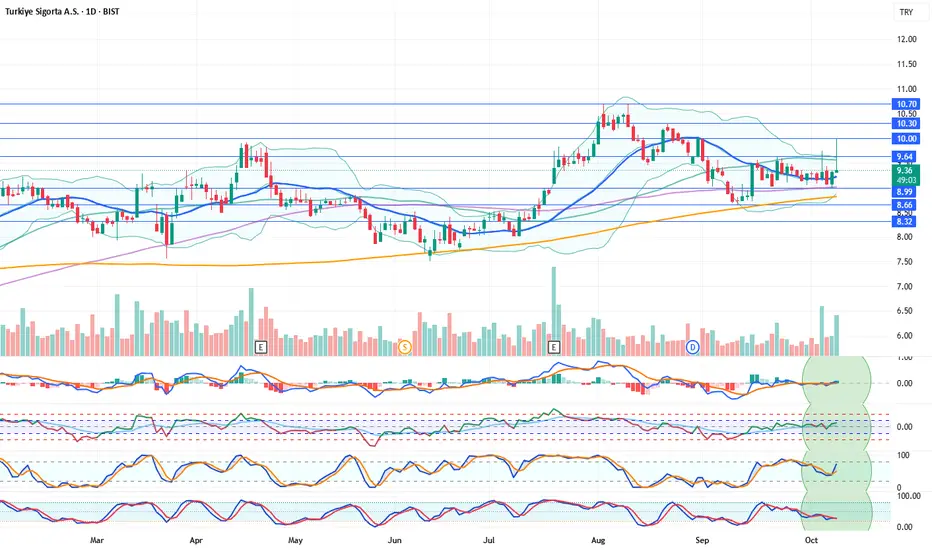
TURSG Stock Analysis CommentaryTURSG Stock Analysis Commentary
Daily technical indicators are positive. The stock has risen above its 21-day moving average (9.22). During the day, it climbed as high as 10.00 TL but failed to hold that level, pulling back below the 9.64 resistance point. With today’s positive movement, the stock has also turned its indicators to the positive side, giving a favorable impression for the coming days. If support continues, it may have another chance to test the 10.00 resistance level. In the medium term, the 10.70 resistance will be monitored.
Resistances: 9.64 – 10.00 – 10.30 – 10.70
Supports: 8.99 – 8.66 – 8.32
We’d appreciate it if you boost our posts and don’t forget to share them on your social media accounts!
Legal Disclaimer:
The information, comments, and recommendations provided here do not constitute investment advice. Investment advisory services are offered only within the framework of an investment advisory agreement to be signed between the investor and authorized institutions such as brokerage firms, portfolio management companies, and non-deposit banks. The opinions expressed on this page reflect personal views only. These views may not be suitable for your financial situation, risk profile, or return preferences. Therefore, investment decisions should not be made based solely on the information and commentary provided here.
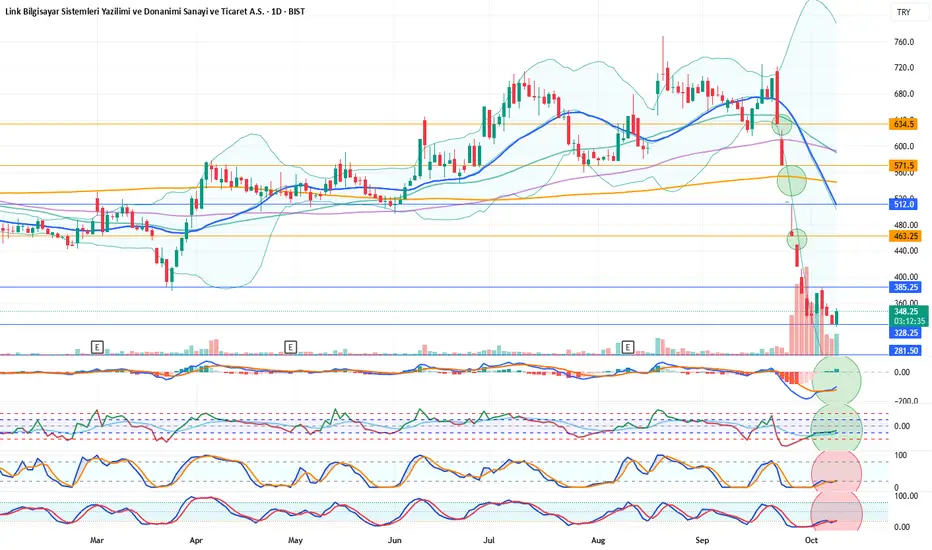
LINK Stock Analysis CommentaryLINK Stock Analysis Commentary
Daily technical indicators are positive.
After a long period of sharp declines, the stock is moving sideways above the 328.25 support level.
We believe that the possibility of a rebound (buying reaction) is high.
If an upward movement occurs and the price breaks above the 385.25 resistance, it may have a chance to fill the price gap around 463.25.
In case of a negative scenario where the stock breaks below its support, the 328.25 level should be closely monitored.
Resistance Levels: 385.25 - (463.25) - 512.0
Support Levels: 328.25 - 281.50 - 253.25
We would appreciate it if you could boost (rocket) our posts and share them on your social media accounts as well. 🚀
Legal Disclaimer:
The information, comments, and recommendations contained herein do not constitute investment advice.
Investment advisory services are provided within the framework of an investment advisory agreement to be signed between investors and authorized institutions such as brokerage firms, portfolio management companies, and non-deposit banks.
The opinions expressed on this page are solely personal views and may not be suitable for your financial situation or risk/return preferences.
Therefore, no investment decisions should be made based solely on the information or commentary provided here.
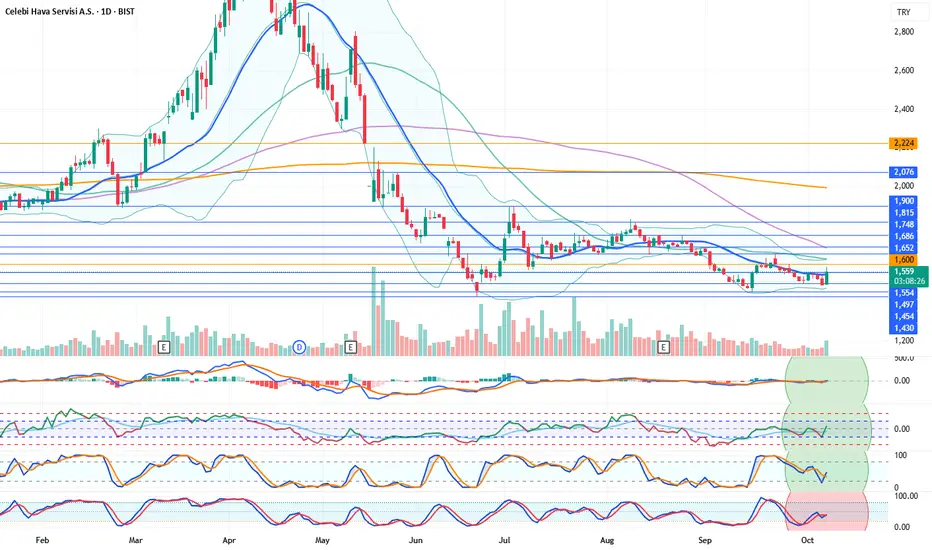
CLEBI Stock Analysis CommentaryCLEBI Stock Analysis Commentary
Daily technical indicators are positive. The stock is trying to stay above its 21-day moving average (1546). As of this post, we observe positive price movements above the 1554 support level. Volatility has also increased compared to the previous week. Closing the small price gap around the 1600 level could occur in the short term. If the stock manages to remain above the 21-day moving average, resistances at 1652 and higher levels will be the next to watch. With indicators remaining positive, the probability of seeing further upward movement in the stock has increased.
Resistance Levels: 1554 – (1600) – 1652 – 1686 – 1748
Support Levels: 1497 – 1454 – 1430
If you enjoy our analysis, we’d appreciate your support — don’t forget to share it on your social media!
Legal Disclaimer:
The information, comments, and opinions provided here do not constitute investment advice. Investment advisory services are offered under a formal investment advisory agreement between the investor and authorized institutions such as brokerage firms, portfolio management companies, or non-deposit banks. The views expressed here are personal opinions and may not be suitable for your financial situation, risk tolerance, or return preferences. Therefore, no investment decisions should be made based solely on the information provided on this page.

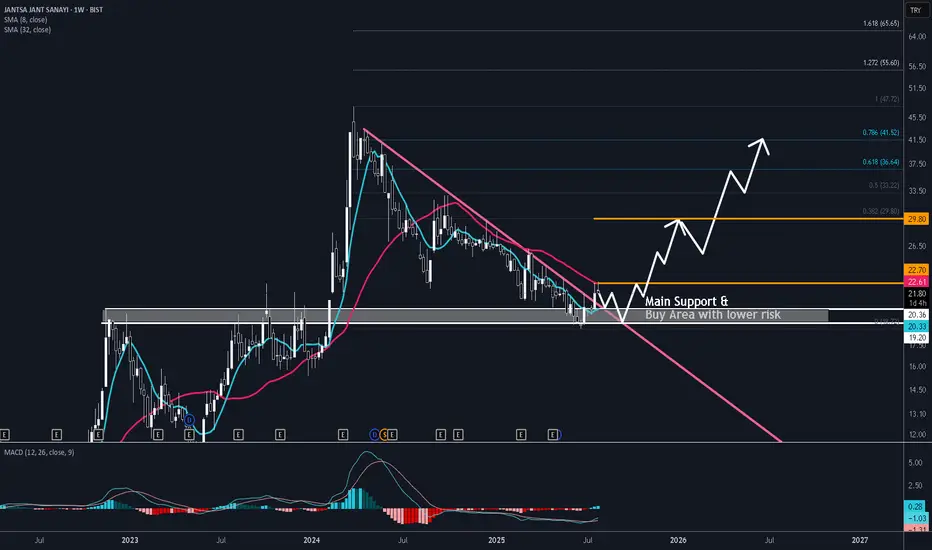
MID-TERM LONG OPPORTUNITY FOR JANTSAs the descending trend was broken out after 16 months, new bullish move is possible for JANTS. There may be ranging price for a while but 19 TL will be a strong support and the stop loss should be set to below 19 TL weekly closure. I believe every downward move to 19-20 TL will be a buy opportunity with lower risk. As this is mid term perspective, 10% loss in possible if the stop loss is triggered. Past performance and win ratio of weekly MACD in JANTS look supportive in this long trade.
High Risk/reward Ratio for ODAS Long TradeI believe ODAS has not much time for breakout. Stop level should be weekly closure below 4.5 TL which is the testing area of double bottom. Take Profit should be set to fibonacci level 8TL.

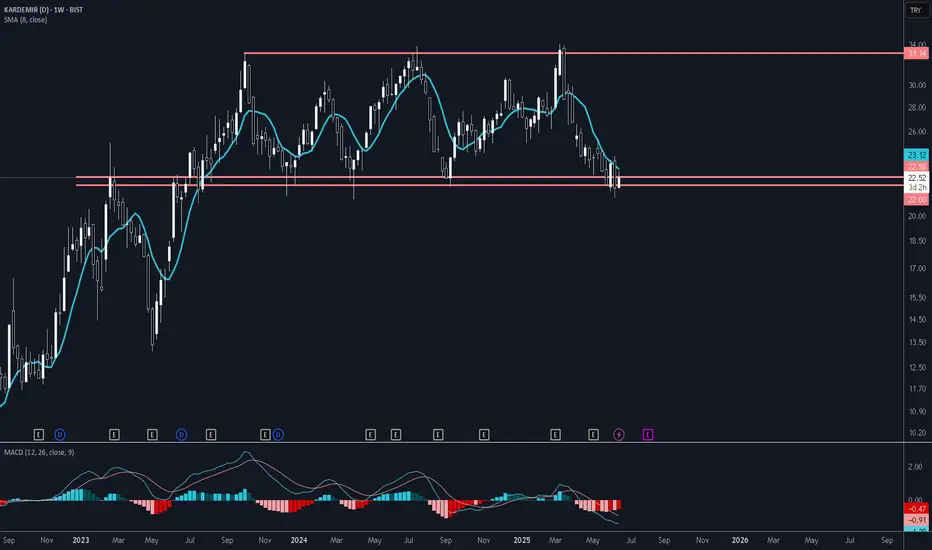
Low Risk for KRDMD Long TradeAs we are close to the bottom line of the horizontal band, long trade is my suggestion in KRDMD. As the stop level would be weekly closure below 22 TL, there is very high risk/reward ratio. I see 25-30% profit is possible if we set the TP as fibonacci 0.618.
Will BIST100 beat inflation?BIST100, which has been trending horizontally and falling for a long time, I think it can rise from here and the final rise phase will come. It is too early to say this before the new ATH comes, but I think the 10.9k region is the decision point. When it stays above it, after a move to the 11.8 region, the price should be watched carefully and be cautious. It will look like second BTC 69k ath. So in these times, I think it would be more logical to proceed with a shorter hit and run.

OBASE is BULLISH BIST:OBASE
Strong breakout to the upside from a key level on HTF (1D),
bullish flag on LTF (1–4h),
EMA 20–50 bullish crossover + SMA 200 breakout to the upside.
I'm seeing a 1:7 RRR.
2D ATR stop loss: 29.60 TL
Take profit: 55.30 TL

What to expect from bis on a downward breakIn USDTRY weakly graphic of BIST100 index as it is shown, if the index break down the recent head and shoulders resistance level it may easily go to 150 in USDTRY basis.

Technical Analysis of BIST100 Index: Examining Trends and PriceIn this technical analysis, we have examined the Istanbul Stock Exchange Index (BIST100) with a special focus on trend lines and price channels. By precisely drawing trend lines, price channels, and linear patterns, key support and resistance levels have been identified. This analysis, using a simple approach without complex tools, provides investors with a clear perspective on the potential future movement of the BIST100 index in the near future.

xu100XU100 is in contact with the upper resistance of the wedge it entered in December 10. I think it will decline to the lower support, but the target is to return to the 11,000 level with the wedge break.

Narrowing deviations ---> increasing expectancy (close @10.000)
Navigating around white lines: bad idea to think about bearish market
Slowing pace of weekly gains: good idea to support bullish outlook
Approaching bullish market: expected before Q4
Strengthening alpha coefficient: 15.000 in ramge

Short, target 51Following weekly chart.
I got a short signal from my power indicator.
Also as I can see on the chart, it couldn't reach to new highs
TP1 62.55
TP2 56.90
TP3 51
Stop above 67.65 weekly candle close.

Short time, target 9000Bist, following weekly chart.
I got a short signal from my power indicator and my targets will be finonacci levels.
TP1 9400
TP2 9000
SL 9870 above, you can stop, but I still prefer t o stop above 10200

Not enough lows amid friction dense marketsRate of return is still bullish but rate of friction is bearish. This lead to stronger bearish market to normalize returns.

Probable correction of bist100 ( Xu100 )#bist100 index has formed an " evening star " candle pattern and this is the probable signal of downtrend. I drew probable bounce zones on #xu100 ( #borsaistanbul ) chart. Blue way, the W bounce seems more probable for now. Not financial advice.

