Dash VS Bitcoin CyclesSince April 2017, Dash has been ranging between btc 0.04 and 0.08 areas. The consolidation continues to this day without any clarity on further direction.
According to cycles, the price should have produced a wave down since February, but it has stuck near the btc 0.06. DASH/BTC has attempted to break below the 200 Moving Average but yet, it only producing spikes lower. The btc 0.055 area remains the support and the next wave according to the cycles could be up.
If the support will not be broken, Dash should be moving upwards towards btc 0.08-0.1 area, and only btc 0.1 breakouts could confirm the long-term uptrend.
Bitcion

Bitcoin Looking for Pullback Soon and Another Wave HigherAs you know from previous posts, I went long at $6500 after accumulation and took some partial profits. I'm taking full profits right here. I have a small short opened at $8900.
I'm looking for a pullback from $7900-$8300 area. My stop is at $9250. Breaking that resistance I would re-evaluate but likely just look for another point to short at a higher price. There's a lot of resistance in this area, so probability says we pullback here, but I'm getting out of the way if $9250 breaks.
When you get a reversal like this from $6500, you look for 2 things. First you look for a 3-5 day run that turns down. That would have been similar to March 17th to 20th. That didn't happen. Which tells me this bull move is going to take some time to complete, which makes more sense as we had too much bearish sentiment at $6500.
Also, we got a clue looking at altcoins that they were WAY oversold and due for a big move. Altcoins went up massively the last week and now short term overbought. I do not think they are done. Smart money didn't buy up cheap altcoins to move them up for a week then stop. They pull back a bit then they go much higher. Too many of them have resistance levels above these prices.
My guess at what happens next.
As I suggested in previous ideas, too many people were talking about going short at $8500 and got stepped on. I think the same thing is going to happen on higher prices. So how does smart money kill everyone? Take price above the log scale trendline. Take price over the .618 retrace. Take price over $10k psychological barrier. Get everyone to proclaim the new bull market is here and then take prices lower. That should set up the final dagger where they can get retail traders to full capitulate. Bitcoin will trade in a tight range below $6k until its ready to breakout for the next bull market, which I think will begin in July or August.
But... I still look for signs that I'm wrong. A really strong bull run that lasts 12 or more days after the pullback and took us over $11700 would get me bullish. Thats the real prove it area for me.


Monaco VS Bitcoin BreakoutMonaco coin has found the support at 57k satoshis and went sharply up towards 165k. The uptrend failed to continue and the price went all the way down to 57k satoshis area. The consolidation continued, but today Monaco finally broke above the downtrend trendline suggesting the beginning of an uptrend.
Fibonacci applied to the corrective waved down after both downtrend trendline breakouts suggest the potential upside target at 20k satoshis area, that is almost 100% growth from the current price.
On a downside, break and close below the 57k satoshis should invalidate bullish outlook and extend the consolidation.


What happens after a parabolic bull run? Lets take a look (2014)Look carefully how the fibonacci levels are respected. Nice bounces at each of them.
And how a huge pump comes after reaching the 0.236 fib level.
(Look here for possible outcomes: )

Tuesday report a price of Bitcoin. Good afternoon, let's start with the fact that Monday closed negatively for the price, the level of volatility has risen in the last 8 hours, there are also purchases, but the nature of these purchases and the spread is more about a one-time buyer than about stopping dawn trend. We are potentially waiting for test 7500 (an important zone is the middle of the down-channel, earlier purchases were made from this zone). Recovery from this zone will open the way to 9000, the breakthrough will open the way to 6000. But do not forget about the foundation because in this interval of volatility the greater part is played by the fundamental part and not by the technical analysis of the price.
btc.com

BITCOIN resistance & support LineBITCOIN is like a short-term stay within $ 200.
If BITCOIN drill a strong resistance line of $ 8940, BITCOIN can reach the resistance line up to $ 9470.
If BITCOIN break through the previous support line of $ 8470, BITCOIN can go below the 8194 support line.
The direction seems to be largely divided by the violet vertical line.

Synereo AMP vs Bitcoin - The BottomSynereo AMP has been trending downwards since the beginning of the year and has lost 67% to Bitcoin while moving from 7800 satoshi down to 2500 satoshi area. Fibonacci applied to the uptrend trendline breakout point shows that price has reached the downside target, hitting 100% retracement level.
Simultaneously, AMP/BTC reached the bottom of the descending channel which suggested the potential bottom for this corrective wave down and could result in the trend reversal. At the same time price could consolidate for the short time between 2200 and 2500 satoshi, but buying opportunity stays very attractive already.
On the downside, only break and close below the 2k satoshi could invalidate bullish outlook.

Syscoin VS Bitcoin Confirming The UptrendSyscoin has been one of the strongest coins during the last few months correctional phase. While most coins have been losing to the Bitcoin, Syscon held its' value while the price was ranging between 5k and 7k satoshi.
SYS/BTC continues trading above the 200 Moving Average and managed to break above the downtrend trendline. During the past few days, it has been rejecting the 38.2% Fibonacci support, where the downtrend trendline acted as the support and has been rejected as well.
This could be the confirmation of the continuation of the uptrend sending Syscoin much higher from the current price. Although there are few strong resistance levels to overcome. First two are 8.2k and 10.2k satoshi levels where previously resistance was established. If they are broken next target would be 127.2% Fibonacci retracement level at 12.6k satoshi. Break above the final resistance will prove the long-term strength of Syscoin, which is a very likely scenario.

Icon VS Bitcoin Hit The Bottom?Icon has already lost 60% to Bitcoin since it reached the all-time high at 9200 satoshis. The downtrend has been stopped at 161.8% Fibonacci retracement applied to the corrective wave down after the ascending channel breakout. Simultaneously the 327.2% Fibonacci channel trendline has also been rejected at the very same price - 3550 satoshis.
This price level could now be the bottom of the correction down. Nevertheless, spikes lower are also possible while the price could reach 3k satoshis for the short time. But, if ICX/BTC will break above the 4.4k satoshis resistance it could be the confirmation that Icon has bottomed out and the price is ready to reverse to the upside.

Ripple VS Bitcoin Uptrend After ConsolidationRipple has produced a double top near 22k satoshi and corrected down, to 10k satoshis area where it found the support. The support is at 61.8% Fibonacci retracement level, where price spiked below but failed to break it with confidence.
Currently, XRP/BTC is forming a triangle pattern, which could lean in the uptrend continuation. Although the consolidation could be extended, while price will remain within the triangle.
Break and close above the downtrend trendline should confirm bullish intentions of the Ripple, sending the price up to 30k satoshis area, at 127.2% Fibonacci retracement level.
On a downside, break and close below the uptrend trendline might result in a wave down towards 76.4% Fibs, at 6.3k satoshis, where buying opportunity could be even more attractive.

Zencash VS Bitcoin Approaching Key ResistanceFollowing the previous idea on ZenCash cryptopost.com , the price has started to grow as expected after rejecting the btc 0.0033 support. The upside potential remains very large, however, to realize it, there is a major resistance that has to be broken first.
The resistance is at btc 0.00567, that is confirmed by two Fibonacci retracement levels. If ZenCash will manage to break above, the price could go as high as btc 0.01.
On a downside note, break and close below btc 0.0033 could send price lower, back to the next support at btc 0.0025, but it still should not invalidate bullish outlook.

BTC to Test Key Support LevelsWe have been due for a pause for a few days now. On the plus side, we've established a few good support levels. The next 12 hours will show which direction we go in as the Asian market begins to trade. If we do see a little more selling off I fully expect for BTC to test the support levels mentioned. Overall, I'm still bullish on BTC.


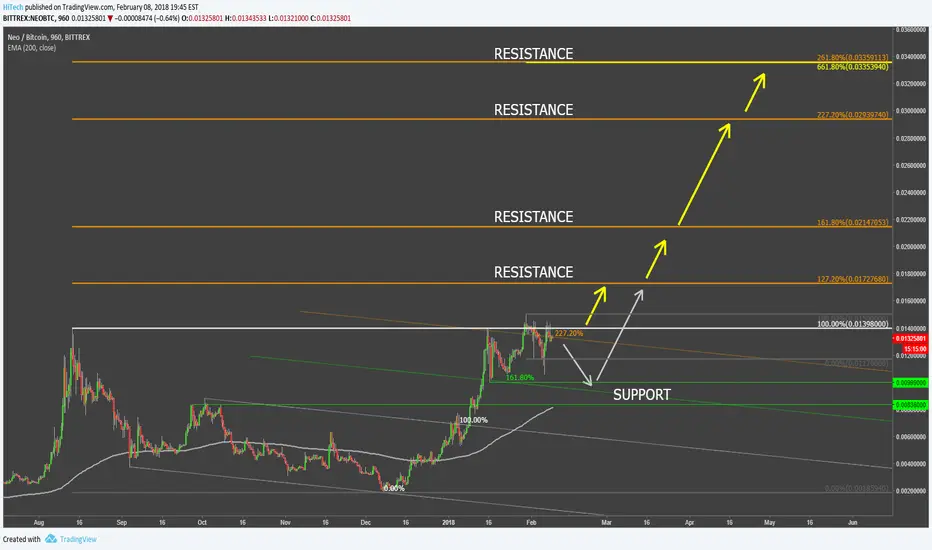
Neo Value Could be 1/3 of a BitcoinOne of the strongest coins in the past 2 months has been the chosen one, the Neo. It has a very strong fundamentals, great team working behind it and a huge growth potential in the coming years. While most coins have been struggling during the recent correction, Neo felt strong and even gained against the Bitcoin.
The most recent price action shows that Neo broke above the previous high at btc 0.014 resistance and at the same time broke above the 227.2% Fibonacci retracement trendline. This shows bullish intentions of the Neo that could bring the price as high as btc 0.0033, yes, 1/3 of the Bitcoin.
On the downside, the price could continue to consolidate and even go back to one of the previous support levels and/or the 200 Moving Average. But the overall long-term trend should remain bullish.

Bitcoin analytics for noobs - serious moment :)Hello, its an analytics for noobs, everyone can understand it, please take your own decision based on what you think it will happen.
Falling of bitcoins 0.44% the last weeks, make the days, hours, minutes walk slowly for the most of the investors, if not all.
The famous question now is: will bitcoin 0.44% Die, will we see the end of a bubble, soon?
Noting yet is sure... even the experts can tell you what will happen, but keep an eye on the news
So we can see that Bitcoin 0.44% Use again the Down trend channel SUPPORT with 4 touch, but the EMA 50 (Orange line) may push the price down again...
4 scenario are possible:
1- Price will goes up, and broke the EMA 50, and keep going up (up trend)
2- Price will make a new nasty BULL FLAG (down trend continues)
3- Price may goes up, then Down after touching the EMA 50, so a retest of $5600 level will be assured
4- We can see a reversals trend from that low level $5600, or a break bellow that support (i think that this wont happen without the Bull flag or a kind of triangle that assure the continues down trend)

OkCash VS Bitcoin Strong Uptrend ExpectedOkCash has been consolidating since October 2017, while rejecting 2.5k satoshi support area multiple times. But only now it shows first signs of an uptrend against the Bitcoin by producing higher highs and higher lows. OK/BTC also closed above the downtrend trendline and the 200 Moving average confirming the upcoming trend up.
Currently, the price is at the support level where previously 4/1 Gann Fan trendline has been rejected, that is 3.8k satoshi. From that level, it is quite likely that OkCash will continue rising to test the first strong resistance near 10k satoshi psychological level. This resistance is confirmed by two Fibonacci retracement levels. First is a 50% Fibs applied through the last corrective wave up started in September last year. And second is 427.2% retracement level applied to the corrective wave down after breaking above the 200 MA and the downtrend trendline. Only a break and close below the 2.3k satoshi support could invalidate bullish outlook.

Incent VS Bitcoin BreakoutIncent found the bottom at 1000 satoshi on the 12th of October and since then, the price has been ranging between 1000 and 4000 satoshi for nearly 3 months. But on the 1st of January INCNT/BTC broke above the downtrend trendline and the 200 Moving Average which was the first sign of a potential trend reversal or a corrective move up.
Price reached 7.7k satoshi high and corrected back. What is interesting is that corrective wave was stopped at the 200 Moving Average which is now acting as a support, that has been rejected. Incent also rejected the 4/1 Gann Fan trendline and nearly tested the downtrend trendline. It seems that it is a very strong support that has been respected by the market and from this point onwards Incent could gontinue going higher.
First target is seen at 12.5k satoshi, that corresponds to two Fibonacci retracement elvels. First is 64.8% Fibs applied through the all-time high. Secon is 227.2% Fibs applied to the last corrective wave down where 3.7k satoshi support was rejected. Only daily break and close below the 3.7k sats support could invalidate bullish outlook.


PowerLedger VS Bitcoin New All-Time High?PowerLedge started an uptrend after it tested 2600 satoshi low on the 8th of December. Price consistently went higher producing higher highs and higher lows. POWR/BTC even managed to break above the previous all-time high at 11.8k satoshi reaching a new high at 14.2k satoshi.
On a corrective wave down it rejected the previous resistance at 7600sat, that has been acting as a support. Yesterday PowerLedge once again attempted to break below this resistance but failed as it only managed to produce the spikes that went lower, but no definitive breakout has been recorded. Not to mention, that price rejected the 4/1 Gann Fan trendline.
This could suggest that POWR/BTC might continue going higher where the next upside target is seen at 15.5k sats. Break above that resistance should confirm further strength and should send it much higher, therefore that level should be watched closely. On a downside note, only a break and close below the 6.4k sats could invalidate bullish outlook.

GameCredits VS Bitcoin Might Grow Exponentially?GameCredits found the support at 10k satoshi and slowly but consistently started to move up, producing higher highs and higher lows. Price broke above the 200 Moving Average and then above the descending channel.
Currently, upper trendline of the descending channel is acting as a support and GAME/BTC could start an exponential growth from this point. The first upside target is seen at 50% Fibonacci retracement level, that is BTC 0.0010 psychological round number. It also corresponds to the previous resistance during July-August 2017. Only break and close below 10k satoshi support could invalidate bullish outlook.
