Bitcoin Tests Resistance - Downside Risk Toward $85,700Hello traders! Here’s my technical outlook on BTC/USD based on the current chart structure. After a prolonged bearish move inside a clearly defined descending channel, Bitcoin attempted a recovery and managed to break out of the channel. However, this upside move lacked strong follow-through. Price entered a consolidation range, where multiple reactions and fake breakouts signaled distribution rather than accumulation. This behavior suggested that sellers were still active at higher levels. Following the range, BTC formed a triangle structure, capped by a descending Triangle Resistance Line and supported by a rising Triangle Support Line. Price has been compressing within this structure, but recent attempts to push higher were rejected near the 88,500 Resistance Level (TP1), confirming strong selling pressure at this zone. Currently, BTC is trading near the upper boundary of the triangle, where sellers continue to defend resistance. As long as price remains below the Triangle Resistance Line and fails to reclaim 88,500, the bearish scenario remains in play. My scenario: I expect a rejection from the triangle resistance, followed by a move back toward the 85,700 Support Level, which aligns with both horizontal support and the lower triangle boundary. A clean breakdown below 85,700 would confirm bearish continuation and open the door for a deeper decline. Only a strong breakout and hold above 88,500 would invalidate this short setup. For now, the market favors sellers below resistance, with 88,500 as key resistance and 85,700 as the main downside target. Please share this idea with your friends and click Boost 🚀
Bitcoin-btcusd

Bitcoin Cycle Fractal: Consolidation Before Bear Market 2026History Repeats: 2020–2022 vs 2024–2026
In 2020 , before the strong bull run of 2020–2021, Bitcoin formed a clear bull flag consolidation on the higher timeframe.
After the bull market top in 2021 , price entered a distribution phase , forming a bearish structure, which eventually led to the bear market of 2022.
The current market structure looks very similar.
During 2024–2025, Bitcoin is again consolidating after a strong impulse, forming a rising structure that resembles previous pre-bear-market consolidations.
If this fractal continues to play out, I expect:
Continuation of consolidation in 2025
Transition into a bear market in 2026
My near-term downside target is the 60–65k USD range, which aligns with previous support and structural levels.

Ethereum (ETHUSD) – 4-Hour Timeframe Tradertilki AnalysisMy friends, greetings,
I have prepared an Ethereum-ETHUSD analysis for you.
My friends, if ETHUSD manages to close a candle above the levels of ( 3027.3-2964.1 ) on the 4-hour timeframe, I will open a buy position.
My target will be the 3,450 level.
My friends, I share these analyses thanks to each like I receive from you. Your likes increase my motivation and encourage me to support you in this way.🙏✨
Thank you to all my friends who support me with their likes.❤️

Bitcoin Is Ranging — And Macro Is Keeping It That WayBitcoin on H1 remains locked inside a clearly defined range, with price oscillating between a defended support zone near the lower boundary and a heavy resistance band overhead. The sharp rejection from resistance confirms active sellers at the top, while repeated bounces from support show that buyers are still willing to defend the range. This back and forth price action reflects balance and liquidity building rather than trend continuation, with momentum paused after the prior impulsive move.
Structurally, BTC is showing overlapping candles and failed follow-through in both directions classic range behavior. As long as price remains capped below resistance, upside attempts are corrective, not impulsive. A rotation back toward the mid-to-lower range remains the higher-probability path unless acceptance above resistance is achieved with strength.
From a macro perspective, this consolidation aligns with a broader wait-and-see environment across risk assets. Markets are currently sensitive to U.S. macro data and expectations around Fed policy, with no clear catalyst pushing liquidity decisively risk-on or risk-off. This macro indecision is mirrored directly in Bitcoin’s price action, where volatility compresses and directional conviction fades.
In summary, Bitcoin is not breaking it is balancing. Until macro conditions and liquidity provide a clear push, BTC is likely to continue rotating within the range. The edge lies in patience: wait for a clean range resolution with intent, not anticipation.

BITCOIN (BTCUSD): Bullish Outlook Explained
There is a high probability that Bitcoin will rise more,
following a formation of a bullish imbalance candle and change of character.
I think that the price will reach at least 88000 level soon.
❤️Please, support my work with like, thank you!❤️
I am part of Trade Nation's Influencer program and receive a monthly fee for using their TradingView charts in my analysis.

BITCOIN PREDICTION – GAME PLAN📊 Market Sentiment
Market sentiment is currently extremely bearish. We continue to see consistent outflows from Bitcoin ETFs. In addition, the Fear & Greed Index is sitting at 22 (Fear zone) and has remained there for some time.
Bitcoin has largely decoupled from the S&P 500 (US markets), and capital does not appear to be flowing into crypto at the moment. Unless a new and strong narrative emerges, I do not expect the market direction to change.
Today’s CPI data came in at 2.7% versus a 3.1% expectation, which could act as a positive catalyst for risk assets. We saw this effect clearly in U.S. equities; however, Bitcoin and the broader crypto market remained unresponsive. This further confirms my view that sentiment remains aggressively bearish.
📈 Technical Analysis
Price has been in a clear downtrend for some time. Over the past month, Bitcoin has been consolidating within a tight range.
In my opinion, this consolidation is more likely to resolve to the downside. While risk assets such as US100 continue to push higher, Bitcoin’s inability to follow reflects clear relative weakness.
📌 Game Plan – Prediction
I am monitoring two main scenarios:
Scenario 1 (Red Line – More Likely)
I expect price to decline toward $80,500, where we may see a short term bounce. However, I believe this bounce will fade, with the primary downside target at $74,500.
After price runs $74,500, I will be looking for potential long/buy opportunities.
Scenario 2 (Black Line)
Price first moves up toward $96,000, gets rejected from that level, and then closes back below it. From there, I expect continuation to the downside toward $80,500 and potentially $74,500.
💬 For deeper sentiment and strategy insights, subscribe to my Substack free access available.
This analysis is for educational purposes only and does not constitute financial advice. Always conduct your own research before trading or investing.

BITCOIN Is this the 'last chance' for camp Bulls?Bitcoin (BTCUSD) remains supported on its 1W MA100 (red trend-line) and as we've shown in previous posts, as long as it holds, this could initiate the first counter-trend rally of the Bear Cycle.
This 'last chance for camp Bulls' is further strengthened by the fact that the 3D RSI is displaying a similar pattern as the previous two Higher Low bottoms of the Bull Cycle in March - April 2025 and July - September 2024.
That is a Higher Lows 3D RSI Bullish Divergence against the Lower Lows of the price. This time isn't exactly Lower Lows for the price but the 1W MA100 has taken this part. Still it is almost identical to the previous ones and can kick-start a rally. Whether buyers can translate that into a final Bull Cycle rally to keep the hopes of the Cycle up, it remains to be seen. Extensive multi-angle technical analysis shows that 'hopes' should be very high as the 1D MA200 (orange trend-line) historically assumes the role of the long-term Resistance level during Bear Cycles.
So can BTC rebound here and fuel a 'last chance for camp Bulls'? Feel free to let us know in the comments section below!
---
** Please LIKE 👍, FOLLOW ✅, SHARE 🙌 and COMMENT ✍ if you enjoy this idea! Also share your ideas and charts in the comments section below! This is best way to keep it relevant, support us, keep the content here free and allow the idea to reach as many people as possible. **
---
💸💸💸💸💸💸
👇 👇 👇 👇 👇 👇

BTCUSD Holds Triangle Support - Bounce Toward 88,500 ExpectedHello traders! Here’s my technical outlook on BTC/USD based on the current chart structure. After a prolonged bearish move inside a downward channel, Bitcoin found a base near the lower boundary and reversed sharply, signaling seller exhaustion and a shift in momentum. This reversal was followed by a breakout above the descending resistance, confirming the end of the bearish phase. Price then entered a consolidation range, where accumulation took place before a confirmed breakout pushed BTC higher. Following the range breakout, the market formed a triangle structure, with price respecting the Triangle Support Line while facing pressure from the Triangle Resistance Line. Recently, BTC revisited the Buyer Zone around 86,300–85,500, which aligns with both horizontal support and the lower triangle boundary. Buyers stepped in at this level, defending the structure and keeping the recovery scenario intact. Currently, BTC is attempting a rebound from the Buyer Zone and is aiming toward the 88,500 Resistance Level (TP1). As long as price holds above the support zone, a move toward this resistance remains likely. A clean breakout above 88,500 would confirm further upside continuation, while rejection could lead to another consolidation or retest of support. For now, the structure favors buyers, with 86,300–85,500 as key support and 88,500 as the main upside target. Please share this idea with your friends and click Boost 🚀

THE 3 TRADES THAT KILL FUNDED ACCOUNTSI keep seeing the same 3 trades right before traders blow their funded accounts.
It’s usually not because they don’t know how to trade.
It’s because, in these moments, emotions take over and the plan disappears.
1) FOMO after news: Price moves fast, you feel scared of missing out, and you jump in late. Most of the time, you’re buying near the top and take a big loss.
2) Revenge trade: You take a loss, get angry, and want to “get it back” right away. That next trade usually makes the hole deeper.
3) Oversizing after wins: You have a few good trades, feel unbeatable, and suddenly use way too much size. One normal loser then wipes out days or weeks of progress.
These 3 trades show up in a huge number of blown accounts and resets worked with. They are more about feelings than skill.
If you read this and thought, “That’s me,” you’re not broken. You’re just human.
If FOMO is your main problem, comment “FOMO” and share when it hits you the most.
will DM you one simple thing that has helped other traders handle it better
Trade Smarter Live Better
Kris

BITCOIN Ichimoku red flip taking place. NOT GOOD.Bitcoin (BTCUSD) is in the process of turning its 1W Ichimoku Cloud from bullish (green) to bearish (red). It has been on a consecutive green state since October 23 2023.
This red flipping is a major development as relative to the previous BTC Bear Cycles, it has happened around the exact same stage that we are at right now. This technically confirms that we are already on the new Bear Cycle (something we've been talking about since September) and that the basic stages/ phases of it remain the same.
The high degree of symmetry is further shown by the fact that when this Ichimoku flip takes place, the price has historically been trading around 175 days (25 weeks) away from it (green circle), supported by the 1W MA100 (green trend-line). And that has always been the stage of a counter-trend rebound/ rally that targeted and was rejected on the 1D MA200 (red trend-line).
The second remarkable display of symmetry is that following this Ichimoku red flip, the Bear Cycles bottomed around 105 days (15 weeks) after it (blue circles).
So what do the above data suggest for the market right now? That there is a short-term rally pending towards the 1D MA200 and that we may see the Bear Cycle bottoming around the end of September 2026.
Would you agree with this thesis? Feel free to let us know in the comments section below!
---
** Please LIKE 👍, FOLLOW ✅, SHARE 🙌 and COMMENT ✍ if you enjoy this idea! Also share your ideas and charts in the comments section below! This is best way to keep it relevant, support us, keep the content here free and allow the idea to reach as many people as possible. **
---
💸💸💸💸💸💸
👇 👇 👇 👇 👇 👇

Bitcoin in a correction - stabilization after a bearish impulseBitcoin is not moving in a clen trend, but rather in a corrective structure. The candles are relatively small, with visible wicks on both sides, which reflects hesitation and an ongoing balance fight between buyers and sellers. The most recent candles after the sharp sell-off suggest stabilization rather than an immediate reversal. There is no strong, impulsive bullish candle closing near the highs, which would normally signal clear directional intent.
Decline produced several candles with long lower wicks. This usually points to localized buying interest and defensive behavior around key levels, but it is not yet a textbook reversal pattern such as a hammer or bullish engulfing. On the way down, bearish candles closed relatively low, confirming that selling pressure was genuine and not just a liquidity sweep. At this stage, the candles speak more about absorption than about a confirmed trend change.
Price has moved into classic reaction zones, including the 0.382–0.5 retracement of the prior upside leg. These areas often act as balance zones where price either consolidates or builds a base. However, there is no perfectly completed harmonic structure like a clean ABCD with strong counter-momentum, which again supports the idea of accumulation rather than an aggressive reversal.
The WWV adds an important layer. Volume expanded mainly during the sell-off, but there was no explosive spike that would suggest panic or capitulation. This looks more like controlled distribution or a methodical move lower to collect liquidity. Recently, volume has started to fade, which often precedes range-bound behavior or a short-term technical bounce.
Bitcoin has completed a strong bearish impulse and is now sitting in a potential stabilization zone. Candles suggest caution, volume suggests waiting, momentum shows exhaustion but not reversal, and the table confirms a neutral-to-defensive market state. The market is asking for patience. The next meaningful move will be defined by how price reacts to nearby levels and whether momentum and volume start to align in one clear direction.

Daily Analysis Bitcoin: 16/12/25Bitcoin may find support now, along with backup from the fundamental developments.
Prices for support, and resistance, are all mentioned in the video, along with invalidation of bullish bias.

Bitcoin Price History RhymesAs I look at the chart for CRYPTO:BTCUSD on the Weekly timeframe with Ichimoku overlayed the similarities to the 2021-2022 cycle top are eerie. Let's break down what I mean:
The key indicator of Ichimoku is price relative to the Kumo Cloud. A trend on the respective timeframe begins when price is above the cloud. I also use Chickou as momentum for confirmation. This means that the current Bull trend of Bitcoin began officially on the Weekly in November 2023.
The inverse to this rule is when price and momentum are on the opposite side of the cloud. The last Bear trend of Bitcoin began officially on the Weekly in May 2022.
So we can see how close Bitcoin is to true Bearish territory; getting below 80k and staying there for a prolonged time.
The other eerie similarity is the double false breakouts or "Spikes." If you learn ONE price action indicator remember the false breakout! There is no more reliable signal of reversal than when price makes a new high/low and then CLOSES back inside the prior range.
Once again this year as in 2021 there were two such signals weeks apart. It means that the market stopped buying at critical moments where breakouts should have occurred if price were to continue. These false breakouts are past being tradeable now but everyone should take note of just how frequent and reliable these instances are.

BTC Buy/Long Signal (2H)First of all, manage your risk and don’t trade as if this is the only opportunity in the market. It’s the end of the year, liquidity is low, and volatility can occur without clear reasons
Since price has reached an important demand zone on the 1-hour timeframe, we can consider taking a buy/long position with controlled risk.
Two entry points and two targets are marked on the chart.
Enter using a DCA approach at the entry points. At the first target, take partial profits and move the stop loss to break-even. Risk-averse traders can fully close the position at the first target
Do not enter the position without capital management and stop setting
Comment if you have any questions
thank you

BTCUSD | Waiting for breakoutBTCUSD has been ranging for quit a while now.
Bitcoin failed to close above the upper purple line, and price dropped further down throughout the week and dropped even more in the weekend.
Bitcoin held to previous Sunday swing low and already showed a bounce today.
Waiting for Bitcoin the break either purple line. I am fine with either one :').
What are your thought on bitcoin?
Let me know in the comments!
Stay safe out there and do your own due diligence, this is not investment advise!

BITCOIN following the same blueprint as all previous Bear CyclesBitcoin (BTCUSD) has been falling non-stop since its October All Time High and all the signs continue to be there that we have already entered the new Bear Cycle.
We've been sharing extensive analyses with you since September on the markers of the Bear Cycle and the latest indicator that adds to the data set is the STOCH on the 3W time-frame.
As you can see, it has entered a level where all previous three Bear Cycles completed roughly their 1st Phase and rebounded on a dead-cat-bounce. On average it i roughly after every three 3W candles that this happens, this time it was after two, the previous two Bear Cycles after three and the one before (longest) after six.
Also this is the fastest it's reached the 1W MA100 (red trend-line) on a Bear Cycle correction and most likely it will be the same for its 3W MA50 (blue trend-line) and 3W MA100 (green trend-line).
This is another sign that shows how every Cycle gets less and less aggressive. The first Bear Cycle dropped by roughly -94%, the second by -87%, the third by -84% and the fourth (last) by 77%. This decelerating rate reveals BTC's asymptotic behavior as more and more mass adoption kicks in with every passing Cycle. As the market stabilizes, becomes larger and more widespread, the volatility becomes lower and lower. This is a sign of maturity.
So what does this potentially mean for us and this Bear Cycle? Well that the drop will most likely be contained at -70% maximum (-7% less than the previous Cycle), a rate that may be as low as -60% (just after contacting the 3W MA100) if ETF buying interest returns or other fundamental catalysts (bitcoin treasuries etc?) accelerate adoption. So this potential range translates into a possible buy zone of $50000 - $38000 towards the end of 2026 but that's a topic we've analyzed extensively on other studies.
So do you think the 3W STOCH puts another nail on Bitcoin's coffin or there are still hopes that the Bull Cycle will be resumed? Feel free to let us know in the comments section below!
---
** Please LIKE 👍, FOLLOW ✅, SHARE 🙌 and COMMENT ✍ if you enjoy this idea! Also share your ideas and charts in the comments section below! This is best way to keep it relevant, support us, keep the content here free and allow the idea to reach as many people as possible. **
---
💸💸💸💸💸💸
👇 👇 👇 👇 👇 👇

BTCUSD Holds Buyer Zone - Push Toward 96,700 LikelyHello traders! Here’s my technical outlook on BTC/USD based on the current market structure. After a prolonged decline, Bitcoin reversed from the Support Level and broke out of the downward channel, shifting momentum in favor of buyers. The price then moved into a consolidation Range, where accumulation formed before a confirmed Breakout pushed BTC higher. Since then, Bitcoin has been respecting the rising Triangle Support Line, forming higher highs and higher lows. Buyers consistently defend this structure, keeping the bullish trend intact despite local corrections. Currently, BTC is holding above the 90,500–88,800 Buyer Zone, which serves as the key demand area maintaining bullish pressure. As long as the price stays above this zone, the upward scenario remains valid. The market is now heading toward the major 96,700 Resistance Level, located inside the broader Seller Zone. A breakout above this level may open the door for further continuation, while rejection could trigger a pullback toward the Triangle Support Line. For now, the structure favors buyers, with 96,700 as the main upside target. Please share this idea with your friends and click Boost 🚀

Bitcoin: Weakness Is Where Opportunity Lurks.Bitcoin is coming off a double top lower high within what appears to be a bearish triangle formation. While this pattern is going to elicit bearish reactions from the herd (experts), it is important to ANTICIPATE potential turning points that can catch everyone off guard. While Bitcoin can break lower and potentially test the low 70Ks, it can ALSO hold the 80K area, form a double bottom/failed low and reverse. Such a formation would confirm a HIGHER LOW on the larger time frames like weekly. How you navigate this situation will totally depend on the time horizon component of your strategy.
The illustration on this chart emphasizes the double bottom scenario. The arrow points to minor support areas to watch price behavior for reversals. The time frame you use to observe will depend on what type of trader you are: day, swing or position. The reason I anticipate price will find support is because the broader fundamentals are still generally bullish, particularly when it comes to future actions by the Fed. It is important to realize, they just cut again and while no futures cuts were announced for the near term, it takes TIME for these recent cuts to be felt, like at least half a year. Sine Bitcoin is anti inflationary, it is likely to benefit.
Another important point is : OPPORTUNITY often lurks in UGLY markets, NOT when Bitcoin is pushing 126K. Why were NONE of the experts calling for Bitcoin to have a healthy correction when it was pushing the highs? They were too busy telling everyone "its going to 200K from here". The herd mentality is REAL and a significant component of human nature. While I also had no idea that this correction was going to unfold, I at LEAST warned people that the RISK was extremely high at those levels. This point further illustrates that NOW is the time be to interested, NOT fearful. It's like going to the supermarket and your favorite food is on sale. What do you do? Stock up on it because normally it costs more, so you perceive value. The concept is the same in the financial markets, its just not as simple because substantial amounts of capital and leverage are also part of the equation.
The optimal mindset for Bitcoin in the coming weeks is: Maintain an OPEN mind because ANYTHING can happen. Be PREPARED for the possibility of price reversing at the major support levels because the broader price structure supports such a scenario. It's ALL about IF the market confirms or NOT. With this in mind, IF it breaks instead, you should at least know how to adjust by stepping aside if you are on smaller time frames, and being enthusiastic to accumulate relative to your risk tolerance as a position trader or investor.
Also note: 88K is the Wave 1, Wave 4 overlap that I have talked about many times. So far price has not spent a significant amount of time below this level. IF it breaks with conviction and stays below for days or weeks, that can be interpreted as we are in the broader Wave 2 which can increase the chances of more of an extreme corrective move within a structure that is still considered bullish.
Thank you for considering my analysis and perspective.

BTC 1H diagonal compression into Monday: brace for volatatilityI’m tracking a validated descending channel (2 magenta lines) from the Oct highs and two rising supports (2 green lines) from the Nov/Dec base. Price is now pinned near the convergence around 90.6k.
Why the “double lines” matter
The outer lines define the macro boundaries (where reactions repeatedly happened).
The inner lines act like a “decision lane” (where price keeps getting rejected/held).
Together this often produces compression to expansion (volatility tends to increase once the market chooses a side).
What I’m watching (behavior > prediction):
Bullish resolution: 1H close above the upper magenta + next candles hold above (no instant reclaim back under).
Then I treat magenta as support on retest. Upside targets become the next horizontal supply zones (92–94k).
Bearish resolution: 1H close below the lower green + retest fails (closes stay below).
Then I treat green as resistance; downside opens toward 89k first, then deeper supports (mid/low 80s).
Chop warning: wicks through lines with no follow-through = liquidity runs, not confirmation. I don’t trade the wick. I trade the close + hold.
Here's how the lines helped me succesfully time a short recently:
Planned two days earlier, during previous chop at this level, and patiently waited for a retest:
Rule for the weekend / Monday open
I’m not betting on the timestamp of line intersections. I’m bracing for range expansion and waiting for acceptance/rejection on 1H closes.
Not financial advice. This is a volatility warning + structure map, not a signal.

BITCOIN SIGNAL: ARE BEARS PREPARING TO CRASH BTC??????!!!Yello Paradisers! Enjoy the video!
And Paradisers! Keep in mind to trade only with a proper professional trading strategy. Wait for confirmations. Play with tactics. This is the only way you can be long-term profitable.
Remember, don’t trade without confirmations. Wait for them before creating a trade. Be disciplined, patient, and emotionally controlled. Only trade the highest probability setups with the greatest risk to reward ratio. This will ensure that you become a long-term profitable professional trader.
Don't be a gambler. Don't try to get rich quick. Make sure that your trading is professionally based on proper strategies and trade tactics.

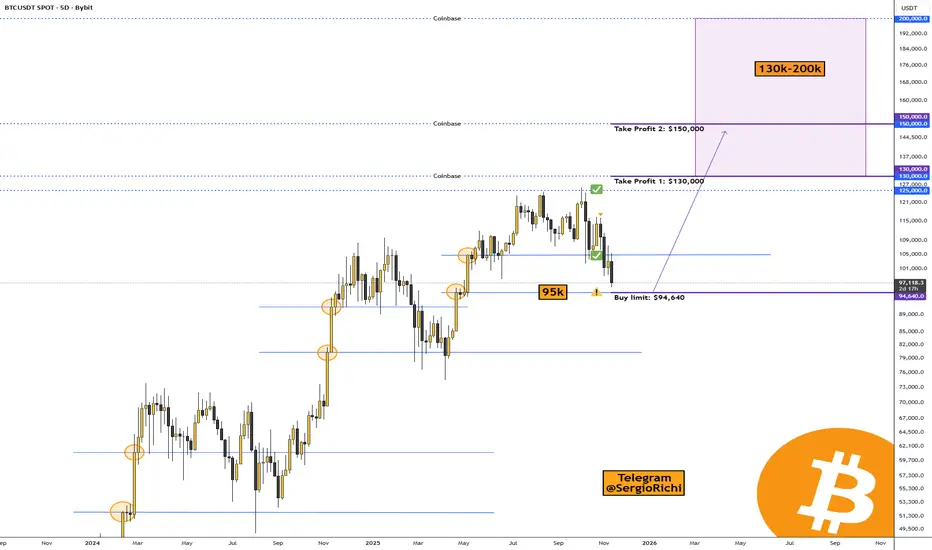
Bitcoin is approaching a key level at $94,640CRYPTOCAP:BTC #Bitcoin — Bitcoin is approaching a key level at $94,640.
The correction in the crypto market continues, and it's now starting in the US stock market.
Bitcoin is nearing an important level on the 5-day timeframe—specifically $94,640.
That's where market makers and big players have placed limit buy orders, and I think we'll see some major trader liquidations there too. For those who trade Bitcoin exclusively, I've marked a buy level.
• Buy limit: $94,640.
• Take Profit 1: $130,000
• Take Profit 2: $150,000
The range for wrapping up Bitcoin's cycle is pretty wide, since there are large orders set up there for taking profits. It's tough to pinpoint exactly where the price peak will be—we can only go by the data we can see.
• Coinbase: $130,000, $150,000, and possibly $200,000.
• Binance: $130,000, $150,000, and likewise, it's unlikely but possible to climb to $200,000.
Based on Elliott waves, we're finishing the 5th upward wave, and I figure the peak will hit in 2026, followed by a straight drop.
Indicator for Bitcoin miners:
The cycle indicator on Bitcoin shows the peak hasn't been reached yet:
Samuel Benner's Cycle and the 2026 Peak
The "200-year farmer chart," often referred to as Samuel Benner's Cycle Chart, is a historical economic forecasting tool created in 1875 by Ohio farmer and self-taught economist Samuel Benner.
It's credited with a "90% success rate" in broad sentiment prediction, and modern applications extend to stocks, crypto, and even solar cycles correlating with recessions.
It's best used as a sentiment gauge, not a precise timer.
Implications for 2026
The chart marks 2026 as a "B" year—a cycle peak in "Good Times," signaling high prices and a time to sell before transitioning to panic and hard times from 2026-2032.
This suggests a potential bull run peak, followed by downturn risks amid global debt, inflation, and geopolitics. As of late 2025, we're in a growth phase approaching this apex, per the model's extensions.
Dear friends, it looks like 2026 will mark the end of the growth cycle for Bitcoin and altcoins, so we'll need to find exit points, bail out of the crypto market, stock up on supplies for 3-5 years, and get busy building bunkers 😀🔥.
BITCOIN This is the 4H Golden Cross that Bulls need at all costsBitcoin (BTCUSD) has been on a slow rebound following the 1W MA100 (red trend-line) test and is close to forming a 4H Golden Cross for the first time in more than 2 months.
However a similar rebound attempt in December 2021, at the start of the BTC's previous Bear Cycle, after also dropping by -39.50% from the top (against today's -36.20%), failed to form a 4H Golden Cross the 'last minute' and the market resumed the bearish trend towards a new Low, completing a -50.34% total decline.
So far the 1D RSI is similar to December 2021 but there is one key difference. Now Bitcoin has already tested its 1W MA100 (and rebounding) while on the previous Bear Cycle it only came close to it in February 2022. So will that favor and support the market for a little while and make that 4H Golden Cross or the 1D RSI and -36.20% identical drop fractal will push it lower? In the first case, the market will look for a 1D MA200 (black trend-line) test around $105k, which is what happened in March 2022, while in the second for a -47.30% total drop around $67000.
One thing is for sure, if Bulls want to see some relief for some time, they have to defend that 4H Golden Cross.
Which scenario do you think will prevail? Feel free to let us know in the comments section below!
---
** Please LIKE 👍, FOLLOW ✅, SHARE 🙌 and COMMENT ✍ if you enjoy this idea! Also share your ideas and charts in the comments section below! This is best way to keep it relevant, support us, keep the content here free and allow the idea to reach as many people as possible. **
---
💸💸💸💸💸💸
👇 👇 👇 👇 👇 👇

BTCUSD Buyers Defend Support — Market Targets $91,5K — $93K ZoneHello traders! Here’s my technical outlook on BTC/USD based on the current market structure. After a strong bullish recovery from the lower demand area near $83,500–$85,000, the price formed a steady impulsive move upward and entered a consolidation phase inside the marked range below the key $93,000 resistance level. Multiple breakout attempts from the range were followed by corrective pullbacks, showing active participation from both buyers and sellers. Once BTC broke above the range, the price initiated another bullish leg but quickly transitioned into a symmetrical triangle structure, defined by the descending Triangle Resistance Line and the rising Triangle Support Line. Currently, BTC is compressing inside this triangle while holding above the critical $89,500 Support Level, which is acting as the main short-term demand zone. Buyers continue to defend this area, keeping the bullish bias technically valid. The price is now approaching the upper triangle resistance again, hinting at a possible volatility expansion. As long as BTC remains above $89,500, the bullish scenario stays in play. I expect a breakout from the triangle toward TP1 at $91,500, followed by a potential continuation toward TP2 at $93,000, which is the major resistance zone. However, a breakdown below the triangle support would invalidate the setup and may trigger a deeper corrective move. For now, the market remains in a compression phase, preparing for its next directional impulse. Please share this idea with your friends and click Boost 🚀
