BTC Daily Scene — Still Not GreenAs you know from my previous publication, I’m still expecting Bitcoin to reach 100,000 and below.
The invalidation zone of my previous bearish scenario was 105,465 .
At the moment, Bitcoin tried to approach that zone but failed to even touch it , which only confirms its intention to keep heading down toward my target area — 100,000 and lower .
My global downside target is 83,000 , but for now, I only expect 100,000, since I don’t believe Bitcoin will drop straight to 83K in one go.
⸻
⚠️ Disclaimer:
This is not a trading signal, just my personal analysis.
Always trade according to your own system and use stop losses.
⸻
💬 Follow me so you don’t miss my daily Bitcoin analysis — the story continues!
Bitcoin-btcusd

In 2026 Bitcoin should trade to the $60k-$80k RegionOn October 23rd, I published an update on Bitcoin titled “Is Bitcoin About to Shed Its 6-Figure Price Tag?” … and that post certainly struck a nerve.
A number of Bitcoin defenders were quick to tell me I was wrong. As it turned out, those same voices had to face the public reality that their conviction was misplaced, and my analysis proved correct in the short term.
To be clear, I remain agnostic when it comes to Bitcoin’s investment merits. My focus is purely on the wave structure, counting 5’s and 3’s nothing more. I cover most tier-1 cryptocurrencies, and while I remain bullish on Bitcoin over the long term, I continue to expect further downside in the intermediate term once a minor B-wave retracement higher completes.
Ultimately, my analysis continues to suggest a bottoming region between $60,000 and $80,000 sometime in 2026, from which Bitcoin can begin a primary-degree rally. Until that region is reached, Bitcoin may be best viewed as a vehicle for shorter-term trades of minor degree, rather than a sustained long-term hold.

BTCUSD Bulls Aim Higher: Buyers Eye Breakout Toward $107,500Hello traders! Let’s take a look at the current BTCUSD structure. After an extended corrective phase within a descending movement, the market found solid support near the $100,000–$100,200 Buyer Zone, which aligns with both the horizontal Support Level and the lower boundary of the broader structure. This zone has repeatedly triggered strong buying reactions in the past, confirming it as a key demand area. Recently, Bitcoin began forming a bullish correction channel, where price has been developing higher highs and higher lows, suggesting early signs of trend recovery. Within this structure, buyers successfully defended the Buyer Zone, followed by a steady rise toward the $107,000–$107,500 Resistance Level — a zone that previously acted as a Seller Zone during prior rejections. At the moment, BTCUSD is consolidating inside this ascending channel, trading slightly below resistance. The market may attempt another push toward TP1 at $107,500, which aligns with the upper resistance line and marks a potential short-term target. If price manages a confirmed breakout above this level, we could see further continuation toward the next resistance around $111,000. However, if the price faces rejection at the current resistance, a temporary pullback toward the Support Line or Buyer Zone ($100,200–$101,000) could occur before the next wave of growth. The structure remains bullish as long as Bitcoin stays above the ascending Support Line. Please share this idea with your friends and click Boost 🚀

BTC is losing momentum
Price closed at $101,827, below both the 9 EMA ($104,098) and 9 SMA ($103,096).
The setup points to continued weakness:
Momentum Shift: BTC failed to hold above $104K, triggering sell pressure.
Fear in the Market: The Fear & Greed Index is at 26, signaling risk-off sentiment.
Liquidity Drop: Total crypto market cap fell to $3.41T, down over 2% in 24h.
Altcoin Season Score (29): Capital rotation is limited. Dominance is fading without new inflows.
Volume Divergence: Buying volume is declining while volatility remains high.
BTC remains in a broader uptrend, but short-term structure shows lower highs and weaker bounces.
If support at $100K breaks, the next demand zone sits around $96K–$98K.
Patience and capital preservation matter more here than chasing small bounces.

BTCUSD Long: Breakout From Descending Channel Targets $108KHello traders! Bitcoin is showing a potential continuation of bullish momentum after breaking out of the descending channel, where sellers had previously maintained control over the market structure. During the prolonged downtrend, the price consistently made lower highs and lower lows, until forming a strong Pivot Point near the $100,500–$101,000 Demand Zone — an area that has historically triggered solid bullish reactions.
Currently, after a fake breakout below this demand zone, the price quickly recovered, signaling liquidity sweeps and seller exhaustion. Since then, BTCUSD has rebounded strongly, confirming a structural shift from bearish to bullish control. The pair has now broken above the channel resistance, establishing a short-term bullish bias supported by steady higher lows. At the moment, Bitcoin is approaching the $107,500–$108,000 Supply Zone, which coincides with previous market consolidation and marks a potential reaction area where sellers might temporarily slow down the move. A clean breakout and close above $108,000 would open the door for a further rally toward the $111,000 Supply 2 Zone, reinforcing the medium-term bullish structure.
I expect the $104,500–$105,000 area to act as immediate support and a key retest level, allowing buyers to maintain momentum and target $108,000. Holding above this zone maintains the bullish scenario, while a confirmed break below it could trigger a pullback to the previous demand level before a new rally develops. Manage your risk!

$BTC bounce before further selloffAs you can see from the chart, BTC formed a falling wedge and looks set to breakout to the upside from it.
I've marked off areas of resistance, but I think if we do get a breakout, the areas you'll want to take profit are $117k and $121-122k as the most likely areas for price to reject.
I think at those levels, you'll want to derisk or set stop losses, because I think it's likely that we can fall a lot further.
The trigger to go short would be losing the diagonal trend line that goes all the way back to October 2023 when the start of the bullish move happened. A move below that trend line should indicate the bullish move is finished and I think that we could potentially move down to the $60k-72k support levels.
I've marked off a lower resistance at $30k, just incase we see an extreme move in the worst case scenario.
Let's see how it pans out over the coming months.

Bitcoin in the Channel of Truth — Levels Mapped, Eyes on 106.261Yesterday's exit was clean — rejection + Bitcoin dominance on support. Let’s break it down 🔍
📊 Bitcoin Dominance
Currently bouncing off key support at ~59.76 . Unless this level is lost, altcoins likely stay weak.
Dominance rising = no altseason. When it dumped last time, Ethereum exploded. Today? We're neutral to bullish on BTC.
🪜 Bitcoin Chart Setup
Big picture:
In a descending macro channel
Inside it, a smaller ascending channel = current trade zone
📌 Key Levels for Day Trading:
Support: 105,000
Mid-level: 106,261
Resistance: 107,000
Macro Bull Trigger: 109,898
Macro Bear Trigger: 104,405
If we lose 104,405 — short time.
If we reclaim 106,261 — stay long.
🧠 Momentum + divergences + my FxProfessor MA combo are pointing higher. So yeah — I expect 106.2K to get tapped today.
📍 Alerts are ON. Precision mode.
💬 Today’s a double day — 11.11. Is 111,111 next? You tell me.
Just play your levels. I do.
Mindset Check 🧘
If you’re guessing, you’re gambling.
I don’t guess. I read structure, I react, I act.
Want to survive this market? Play like it’s chess, not roulette. Not sure where it's going? Hedge!
Disclaimer
Hey — I’m a day trader. I play the levels. I don’t know what you’re doing i just share what I do!
One Love,
The FXPROFESSOR 💙

Bitcoin and a Critical Resistance for a Price Breakout | Day 3👋🏻 Hey everyone! Hope you’re doing great! Welcome to the SatoshiFrame channel.
✨ Today we’re diving into the 4-Hour Bitcoin analysis — stay tuned and follow along!
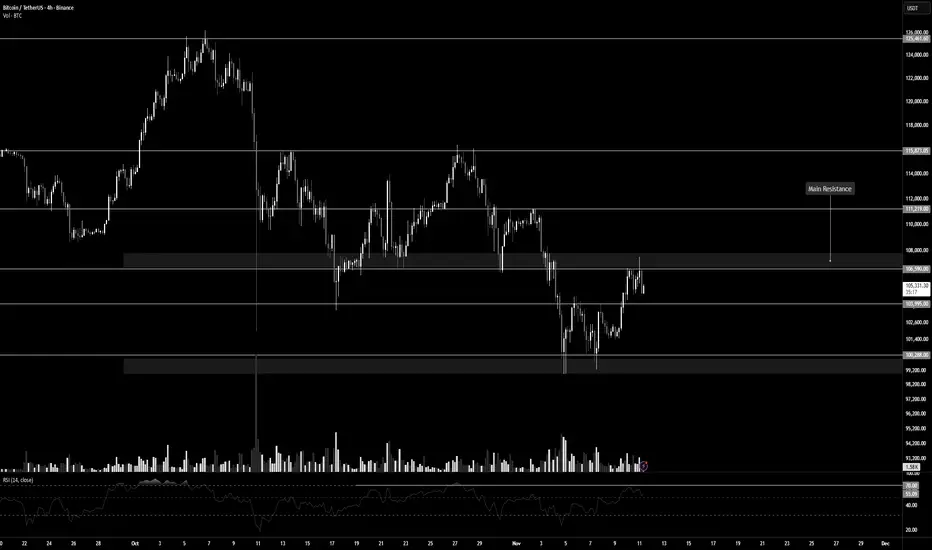
🪙 Bitcoin, in its 4-hour timeframe (as mentioned in previous analyses), is currently sitting below a major resistance level. A breakout above this area could trigger a strong bullish leg, potentially driving price toward forming a new ATH. The key resistance zone is around $106,590, and breaking it could lead to some beautiful market moves.
📊 The buying volume at this resistance is not yet sufficient. If we look closely, since the last touch of the maker-buyer zone at the lower part of the chart, volume has been declining. To break through this resistance, whale candles are needed to absorb all sell orders in the zone — this could lead to a short squeeze.
🧮 The RSI oscillator on the 4-hour timeframe has fluctuated several times below the 70 level, showing two rejections near that area. The 70 RSI level aligns with the $106,590 price resistance, and crossing above it could trigger a strong upward move.
✍️ You can read the possible scenarios for Bitcoin in the rest of the analysis, but since Bitcoin has shown reduced buying volume, it’s best to lower your risk exposure. If the breakout happens, you can reallocate remaining risk toward the next resistance levels.
✅ Long Position Scenario:
A confirmed breakout above $106,590, along with increased buying volume and the RSI surpassing 70, could form a solid long setup on the 4-hour timeframe. Make sure to gather proper confirmations before entering to ensure the best possible trade setup.
❤️ Disclaimer: This analysis is purely based on my personal opinion, and I only take trades when the stated triggers are activated.
Bitcoin : Stay heavy on positionsBitcoin : Stay heavy on positions (3x)
A signal for catching a bounce has emerged.
Within 1–2 weeks after the bounce signal, leverage is reduced from 3x to 2x.
** This analysis is based solely on the quantification of crowd psychology.
It does not incorporate price action, trading volume, or macroeconomic indicators.

BTCUSD – Perfect Mid-Channel Touch. Eyes on 110K📉 BTCUSD – Perfect Mid-Channel Touch. Eyes on 110K
BTCUSD – Perfect Mid-Channel Touch. Eyes on 110K 🔁📈
Price bounced beautifully off Channel Support ~98,986 and is now hovering just above Mid S/R at 104,634 . That’s the make-or-break zone .
A move toward Top Channel Resistance ~110,080 seems likely — but watch that interaction closely.
No “traps,” no fluff — this is a textbook channel play.
🎯 Targets Above:
• Target 1: 120–122K
• Target 2: 138.8K
📉 Supports Below:
• Mid Channel: 104,634
• Channel Support: 98,986
• Technical Support: 97,389 → 96,281
⚠️ If BTC breaks below the mid-line again, bears may try to retest the green base. For now — structure holds.
Trading Wisdom 📜
You don’t chase Bitcoin. You position around it.
Let the structure guide you. The crowd reacts — the Professor prepares.
Disclaimer: I’m just sharing wisdom, not instructions. No licenses, no guarantees — just years of trading scars and precision chartwork. Be smart, protect your capital, and don’t copy blindly.
One Love,
The FXPROFESSOR 💙

10/11/25 Weekly OutlookLast weeks high: $110,732.65
Last weeks low: $98,972.09
Midpoint: $104,852.37
Bitcoins price action of last week tells an interesting story. The first trading hour of the week marked the weekly high, a sharp decline towards HTF support at $99,000 marked the weekly bottom, to finish the week a late surge recovered some of the losses to end the week at the range midpoint.
The double bottom at range low is a good sign for the bulls in a must win contested area around the $100,000 mark, not only is it a big even level but a HTF key S/R level too. Should the bulls lose this weekly low it opens the door to a $92,000 retest.
For the bulls should this rebound persist a flip of $108,000 is key but there is certainly a lack of spark in the markets at the moment.
I don't see the bulls making any significant ground until the US Government shutdown is announced to be coming to an end. This announcement could happen at any time and so this week that's what I am making plans for, how will the market react, volatility on announcement etc...
Good luck this week everybody!

BITCOIN Did the 1W MA50 just save the day again?Bitcoin (BTCUSD) just closed last week above its 1W MA50 (blue trend-line) even though it broke below it during the day.
Since the March 13 2023 break-out above the 1W MA50, this is the 4th time that BTC breaks below it but manages to close the 1W candle above it. All of those times (including the additional one of September 11 2023), marked market bottoms, Higher Lows for the 3-year Channel Up and initiated the Bull Cycle's strong rallies.
However every rally has been weaker and since the first one topped in March 2024, we have a huger Bearish Divergence on the 1W RSI of Lower Highs against BTC's Higher Highs, showcasing loss of strength for the trend. A natural feat however, as the Bull Cycle tends to be stronger on its start as it rebounds violently from the market bottom and less strong towards the end as it matures and big positions already start to take profits.
But is this the end of the Cycle? The 4-year Cycle Theory, the DXY bottoming, the 1W RSI Bearish Divergence among others, all say 'yes'. But the Bear Cycle can only be technically confirmed when the market closes that 1W candle below its 1W MA50 and so far it hasn't. Is that enough to rely your strategy on from this point onwards?
So has the 1W MA50 just saved the day again for Bitcoin? Feel free to let us know in the comments section below!
-------------------------------------------------------------------------------
** Please LIKE 👍, FOLLOW ✅, SHARE 🙌 and COMMENT ✍ if you enjoy this idea! Also share your ideas and charts in the comments section below! This is best way to keep it relevant, support us, keep the content here free and allow the idea to reach as many people as possible. **
-------------------------------------------------------------------------------
💸💸💸💸💸💸
👇 👇 👇 👇 👇 👇

Bitcoin at a Decision Zone – Day 1👋🏻 Hey everyone! Hope you’re doing great! Welcome to SatoshiFrame channel.
✨ Today we’re diving into the 1-Hour BITCOIN analysis. Stay tuned and follow along!
🪙 Bitcoin on its one-hour timeframe is currently within a trading range, and due to the holidays, both volume and volatility have dropped to their lowest levels. According to the analysis, an important resistance has formed around $103,912, and a micro buyer support around $100,288. Once either of these zones is broken, Bitcoin could provide a trading opportunity.
📊 Bitcoin’s volume on the one-hour timeframe has now reached its lowest level, indicating that we are close to a potential move. This suggests possible upcoming volatility. As for the micro buyer floor, this level is crucial for buyers — when price reaches it, buying volume typically increases. To break this zone, it would require significant selling volume and large whale candles to overcome the long-biased traders.
🧮 My favorite oscillator, RSI, is also ranging between 30 and 70, which nicely overlaps with the identified support and resistance levels. A breakout from these RSI limits can confirm our risk level and validate potential trade entries.
✍️ You can read the possible scenarios for this trading range below. If needed, set your alert zones and use them accordingly. Don’t forget proper risk and capital management.
↗️ Long Position Scenario: A breakout above $103,912, accompanied by an increase in buying volume, would validate a potential long setup. This volume increase should also align with the oscillator, meaning RSI should break above 70 on the 1-hour or 15-minute multi-timeframe chart, along with increased market volatility.
📉 Short Position Scenario: A breakdown below the micro buyer floor at $100,288, with selling pressure and RSI falling below 30, could confirm a short position. However, it’s recommended to wait for a pullback after the breakout before entering the trade.
❤️ Disclaimer : This analysis is purely based on my personal opinion and I only trade if the stated triggers are activated .

Bitcoin: 100K NOW Attractive For Investing.Bitcoin looks bearish to most, I can understand why BUT as bearish as this looks, the current price area still presents a potential area for a bullish reversal. The 98K low dates back to the June low which is now acting as the support. IF this level breaks, 95K is the next inflection point to watch for a swing trade long possibility. IF that is cleared, 90K becomes the level. The 88K AREA is the Wave 1 overlap WHICH MEANS: IF price tests this area and does not reject it quickly, that would confirm that Bitcoin is most likely in the BROADER corrective wave that I was talking about earlier in the year.
What I have just laid out here is a number of scenarios that may or may not unfold. The purpose is to be prepared for a market scenario and have a plan in case a confirmation appears. There is NO way to accurately forecast this. I evaluate price structures, and change my outlook based on changes or lack of changes in price structure. From this point I can gauge potential BUT require confirmations to gauge RISK. The illustration on this chart show the bounce scenarios that I am looking for this week which can take price back into the 105K AREA which is now an old support / NEW resistance.
The 100K area is also a MUCH more attractive location for investing, especially compared to the 125K AREA high. Keep in mind, as an INVESTOR, you assume the greatest risk. This means you must be open to the possibility of Bitcoin testing low 80Ks or even the 70Ks in the coming months. While I do believe this is a lower probability at this point, it CAN happen. As an investor you control risk with size that is proportional to your account and minimal or NO use of leverage for this precise reason.
I don't care why Bitcoin is weak now because fundamentally, not much has changed in terms of an inflationary environment. News is for content producers and frauds to monetize your attention. If it had any actionable value, they should have been calling the top at 126K instead of over reacting to it. This is why I rely on wave counts to guide my broader view of how Bitcoin is likely to behave in the near future. And also why I believe the broader bullish structure (Wave 4) is still intact until price overlaps Wave 1 at 88K. IF this level cannot be tested within this bearish attempt, it implies a broader Wave 5 is likely to follow which theoretically can see a test of the 126K high. The Federal Reserve's easing policy aligns with this scenario as well. We are also facing an information gap in the form of missing governments reports which can have a major affect, just something to think about.
Thank you for considering my analysis and perspective.


BTC/USD WEEKENDERBTC remains in a controlled downtrend, trading within a bearish range between 116.432 and 98.952, holding near the key 100.996 level. Thursday’s daily low was liquidated and sharply reclaimed — confirming absorption on both sides of the market. Price structure has now printed a fourth consecutive inside day, showing compression while red daily highs remain exposed. Yesterday’s New York session stretched higher into the close, keeping short-term bias constructive within the broader range.
The current plan into the weekend is to monitor for a measured retracement toward the 105.000 area — a zone aligning with short-term equilibrium inside the larger bearish range. This level provides a clean reference for liquidity behavior and potential continuation signals into next week.
The IMF warned this week of rising global risk complacency, with high debt and inflated assets raising the chance of a sharper correction. Meanwhile, crypto shows quiet structural strength beneath the surface. Whales absorbed around 30,000 BTC and 400,000 ETH this week near the 100.996 volatility low, aligning with steady ETF inflows and falling exchange balances.
Smart money moves first — absorption always precedes expansion.
Discipline defines conviction, not direction.
— Institutional Logic. Modern Technology. Real Freedom.

BITCOIN Free Signal! Sell!
Hello,Traders!
BITCOIN Smart Money shows reaction from a key supply zone where liquidity was engineered above equal highs. Price is likely to deliver downside targeting sell-side liquidity.
---------------------
Stop Loss: 104,822$
Take Profit: 102,778$
Entry Level: 103,763$
Time Frame: 2H
---------------------
Sell!
Comment and subscribe to help us grow!
Check out other forecasts below too!
Disclosure: I am part of Trade Nation's Influencer program and receive a monthly fee for using their TradingView charts in my analysis.

BITCOIN SIGNAL: PUMP INCOMING???? (trap alert) Yello Paradisers! Enjoy the video!
And Paradisers! Keep in mind to trade only with a proper professional trading strategy. Wait for confirmations. Play with tactics. This is the only way you can be long-term profitable.
Remember, don’t trade without confirmations. Wait for them before creating a trade. Be disciplined, patient, and emotionally controlled. Only trade the highest probability setups with the greatest risk to reward ratio. This will ensure that you become a long-term profitable professional trader.
Don't be a gambler. Don't try to get rich quick. Make sure that your trading is professionally based on proper strategies and trade tactics.

true bitcoin bottom - fib and time cyclesthough experience and study of the various factors of history and human behavior.
and importantly how these interface with the bitcoin price.
unless there is significant market intervention from the US Government, or from whales & Billionaires. it is my estimation the true bitcoin bottom will be where I have shown it to be.
will nonetheless be trading scalps, punts on new technologies, & innovations, and farming along the way. and I pray if you see this, you know there is light at the end of the tunnel. and there will be 'up-only' again.
and naturally, as a permabull, I hope I am wrong.
good luck and may the odds be ever in our favor
Break of Support or Multi-Timeframe Trend Reversal ?👋🏻 Hey everyone! Hope you’re doing great! Welcome to SatoshiFrame channel.
✨ Today we’re diving into the 15-Mimutes Bitcoin analysis. Stay tuned and follow along!
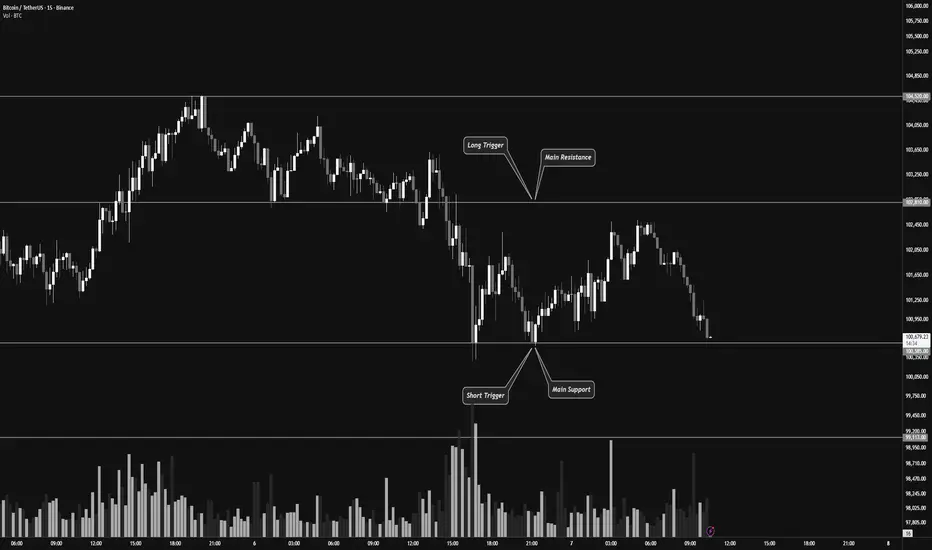
👀 On the 15-minute timeframe for Bitcoin, we can see that after breaking a multi-timeframe support, Bitcoin is currently testing its support zone around $100,585.
If this zone breaks, Bitcoin could continue its downward move and experience further decline.
However, if it moves upward and breaks the resistance zone around $102,810, it could trigger a potential trend reversal.
🕯 Pay attention to Bitcoin’s volume — the volume indicator currently shows an increase in selling pressure, suggesting that we might see a short-term volume consolidation before the price continues downward again.
✍️ The current scenarios for Bitcoin include both long and short setups, which you can use to plan your trades based on how the market reacts.
🟢 Long Position Scenario : A break above the $102,810 resistance zone, accompanied by increasing buy volume and bullish momentum, could signal a good long opportunity toward higher levels.
🟥 Short Position Scenario : A break below the $100,585 support zone, along with increasing sell pressure turning into strong selling momentum, could offer a short opportunity in line with the current trend.
❤️ Disclaimer : This analysis is purely based on my personal opinion and I only trade if the stated triggers are activated .
Bitcoin FUDINDEX:BTCUSD has pulled back to the 50% Retracement of the April 2025 low to the October 2025 high at 100,300. This could be a Support to hold up the recent down move.
Bitcoiners have requested the best FUD to affirm that this could be "the local bottom". Bottoms are made in fear so it seems they are trying to manifest as much as possible on social media to confirm this will be as low as it will go for now.
The obvious narrative FUD would be something about how the bull phase of the Halvening price cycle ended precisesly when it was predicted to (at 36 months from the November 2022 bottom) and the bear cycle has begun. However, here I think are some even more scary FUDs for post-Halloween:
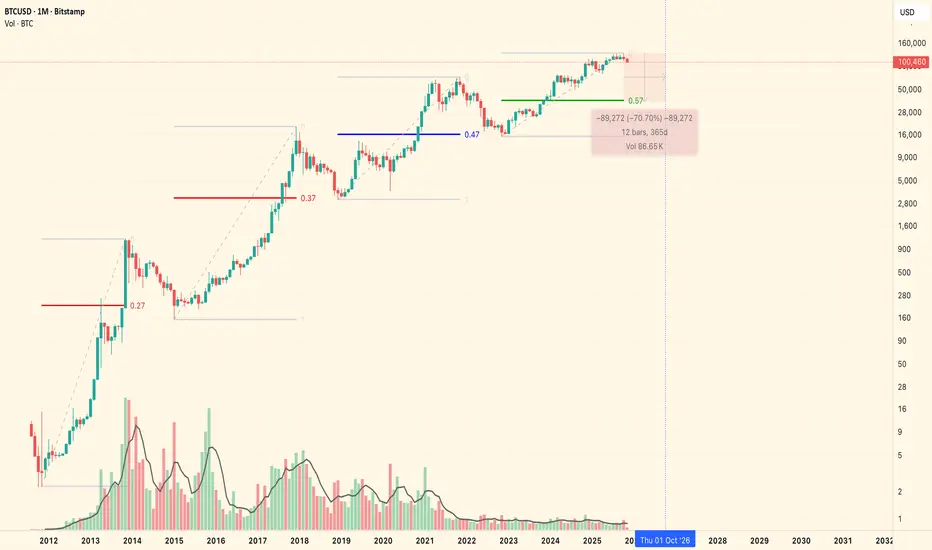
The Compound Annual Growth Rate (CAGR) of Bitcoin for the last decade has been in decline. Bitcoin has been going higher and likely will continue to make higher highs and higher lows into the future BUT at a decreasing rate. Bitcoin's price is following a negative exponential curve. Bitcoin will probably make a higher high at some point in the future, this cycle or the next, but the returns to investors will be far less than have been seen in the past and continue to be even less over time.
A more neutral look at future possibilities is to model historic volatility and project the most probable outcome. The 1 Standard Deviation range from today's price for the next 365 days is between 159,600 and 64,800. That means that there is a 68% probability that Bitcoin will trade within this range over the next year. The FUD is that the lower band matches the Volume Profile node from 2024's consolidation creating support in that zone.
Trade wisely.

Bitcoin Bulls Target $113K**Bitcoin (BTC/USD) Analysis — November 2025**
Bitcoin has been moving within a controlled downtrend channel, facing continuous lower highs since late October. The market recently went through a **liquidity sweep**, followed by a minor **market structure shift (MSS)** on the 3-hour timeframe. This suggests exhaustion in the current bearish leg.
After a period of **sideways consolidation**, price is testing a strong accumulation zone near the **$100K–$97K** region. This zone aligns with prior demand and high-volume nodes, making it a potential base for a bullish reversal.
A clean rebound from this level could drive Bitcoin toward the **$113K–$115K** area, where the next liquidity cluster sits. If buyers regain momentum, this move could accelerate into a **V-shaped recovery**, confirming the start of a fresh mid-term bullish cycle.
Overall sentiment remains **bullish**, supported by renewed buyer activity and potential macro-driven inflows ahead. Traders should watch for volatility spikes as the market transitions from accumulation to breakout mode.
**Key Takeaway:**
BTC is stabilizing near key demand, eyeing a rebound toward $113K+. Momentum confirmation above the short-term consolidation zone could trigger a strong upward continuation.
**#Bitcoin #BTCUSD #CryptoAnalysis #BitcoinForecast #BTCPricePrediction #CryptoTrading #BullishReversal #CryptoMarket #TradingViewAnalysis**

Wider Range or Early Trend Reversal in Multi-Timeframe?👋🏻 Hey everyone! Hope you’re doing great! Welcome to SatoshiFrame channel.
✨ Today we’re diving into the 15-Mimutes Bitcoin analysis. Stay tuned and follow along!
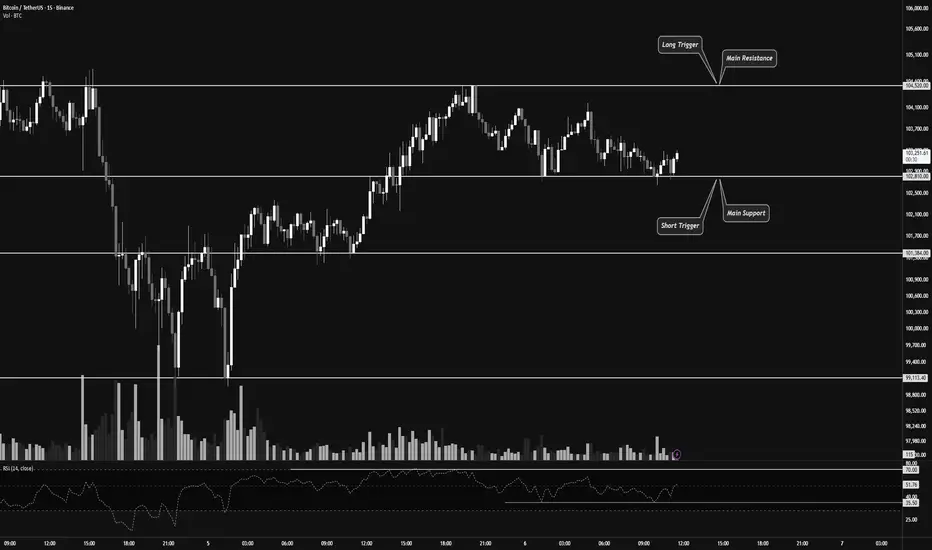
👀 On the 15-minute timeframe of Bitcoin, we can see that after recent declines, BTC has entered a 15-minute trading range. The top and bottom of this range act as our long and short triggers. Keep in mind that Bitcoin’s next move could potentially develop into a long-term directional move.
🧮 Looking at the RSI oscillator, the 70 level serves as confirmation for a long trigger, while the 35.5 level confirms a short trigger. Note that RSI confirmation based on its momentum swings can provide higher-quality trade setups.
🕯 Selling volume has increased slightly as Bitcoin approaches its resistance zone at $104,520, and we’ve seen a similar reaction when price hits resistance from below. This indicates buyer hesitation and stronger seller activity.
Meanwhile, buying volume has risen as price nears the support zone around $102,810. If this buying pressure continues, it could confirm an extended range formation in this area.
✍️ As in previous setups, Bitcoin’s potential scenarios remain straightforward. With proper RSI confirmation, we can look for entry opportunities.
🟢 Long Scenario : A breakout above the $104,520 resistance zone, accompanied by increasing buying volume and RSI exceeding the 70 level on the 15-minute multi-timeframe, could signal a long trade.
🟥 Short Scenario : A breakdown below the $102,810 support zone, with rising selling volume and RSI dropping below the 35.5 level, could trigger a short trade.
❤️ Disclaimer : This analysis is purely based on my personal opinion and I only trade if the stated triggers are activated .