Breakdown or Bounce Incoming? | BTC 4H Analysis D4🥳 Hey everyone! Hope you’re doing great! Welcome to SatoshiFrame channel .
✨ Today we’re diving into the 1-Day BITCOIN analysis. Stay tuned and follow along!
👀 Yesterday I shared Bitcoin’s daily analysis in the channel, and today we’re going to review the 4-hour timeframe, from its recent all-time high up to the present.
🔍 After setting its ATH, Bitcoin entered a descending channel (driven by profit-taking and reactivated whale activity). Each time price reached the top of this channel, it was rejected and moved toward the midline or bottom. The last touch of the channel’s top led to another drop toward the midline, and price failed to break above the channel. The major buy zone (micro buyer area) at the top of the channel was lost and has now turned into a key static resistance, overlapping with the dynamic channel resistance — creating a crucial pivot zone for Bitcoin’s potential trend reversal. The next key support lies below this zone at $105,634; a confirmed break and close below it could extend the downtrend further.
🧮 The RSI oscillator is currently fluctuating between 30 (support) and 50 (resistance). A breakout beyond either side — as highlighted in the chart — could add significant momentum to Bitcoin’s next move. These RSI levels are default static zones, which makes their reliability stronger.
🕯 After the massive flash crash that shook the crypto market, traders have shown a stronger inclination toward selling, keeping Bitcoin within this descending channel. As seen in the volume data, the flash crash was accompanied by extreme selling pressure, and whales broke the micro buyer zone with a large “whale candle.” Continued selling pressure could push Bitcoin toward lower supports, while renewed buying volume and whale re-entry could drive it back toward the channel top to test that resistance once more.
🧠 For those without open positions, here are two key scenarios to consider:
🟢 Long Setup: A breakout above the key static + dynamic resistance zone at $109,222, along with increasing buy volume and RSI crossing above 50, could be a solid long opportunity.
🔴 Short Setup: A confirmed breakdown below the nearest support at $105,634, accompanied by strong selling pressure and RSI falling below 30 into oversold territory, could present a strong short setup.
❤️ Disclaimer : This analysis is purely based on my personal opinion and I only trade if the stated triggers are activated .
Bitcoin-btcusd

BITCOIN From ATH to Breakdown | BTC 1D Analysis D3😎 Hey everyone! Hope you’re doing great! Welcome to SatoshiFrame channel .
👍 Today we’re diving into the 1-Day BITCOIN analysis. Stay tuned and follow along!
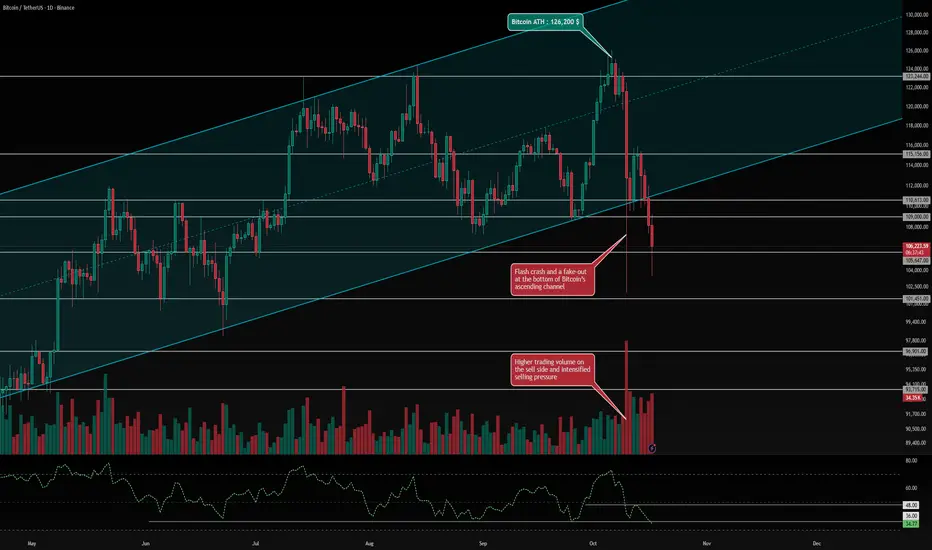
👀 Bitcoin has been trading within a strong ascending channel, recently hitting the upper boundary and setting a new all-time high (ATH) at $126,200. However, this was immediately followed by a flash crash that wiped out roughly $20 billion in futures positions. During the crash, the lower boundary of the ascending channel was also fake-broken, after which buyers temporarily pushed the price back inside the channel. Yet, due to extreme market fear and uncertainty, Bitcoin lost its key support zone at $110,613, continuing the downtrend that began with the flash crash. With yesterday’s daily candle close, Bitcoin officially broke down from its ascending channel, and price action is now heading toward lower support levels. The nearest support lies around $105,647, and if this zone fails to hold, Bitcoin could extend its decline toward the next support at $101,451.
🔍 Bitcoin currently faces two major resistance zones at $109,000 and $110,613. A confirmed breakout above these could signal the start of a reversal, but the main long trigger is located at $115,156. If Bitcoin breaks and holds above this zone with strong buying volume, it could mark the beginning of a powerful bullish leg, potentially leading to a new ATH.
🧮 The RSI oscillator is now sitting near its support region around 36. A daily close below this level would strengthen bearish momentum and could push RSI into oversold territory. The midline resistance sits near 48, and a breakout above this would indicate a possible trend reversal toward renewed bullish momentum.
🕯 Recent candlestick volume shows extremely high selling pressure, marking one of the most intense liquidation waves in recent crypto history. The number of red candles has surged in recent days, suggesting a continuation sell-off pattern, with traders increasingly favoring short positions. The market is currently in extreme fear, and for any bullish reversal to occur, Bitcoin would need massive buy-side volume and strong support to push prices back up. Without that, more long-term holders may start selling as well.
🧠 Current Scenarios (Daily Timeframe) — Patience is key. If you haven’t already entered a short based on previous analyses, consider these setups:
🟢 Long Scenario: Enter on a confirmed breakout and consolidation above $115,156, accompanied by a spike in buying volume and an RSI move above 48.
🔴 Short Scenario: Enter on a confirmed breakdown and close below $105,647, which could trigger a deeper correction toward lower levels. This move would likely coincide with continued selling pressure and RSI dropping below 36 into the oversold zone.
❤️ Disclaimer : This analysis is purely based on my personal opinion and I only trade if the stated triggers are activated .
BTCUSD: Pivot from Support level and Rally to $116KHello everyone, here is my breakdown of the current Bitcoin setup.
Market Analysis
From a broader perspective, after a powerful rally to a new All-Time High around 126000, the market for Bitcoin has entered a significant and complex corrective phase. This entire correction has been developing within the confines of a large triangle pattern, with price coiling between major support and resistance.
Currently, the price has rotated down and is now at a critical inflection point, testing the ascending support line of this multi-week triangle. This area also aligns with the major horizontal Support around the 110500 level, creating a strong confluence of support.
My Scenario & Strategy
I see this test of the Triangle Support Line as a logical point for buyers to step in and defend the structure, just as they have done at previous lows within this pattern.
I'm looking for the price to make one final small corrective dip into this support area. The key signal for me would be a confirmed and strong bounce from this level, which would indicate that the selling pressure is exhausted and a new rotation to the upside is beginning.
The primary target for this rotational move is 116000, a key level of prior price action inside the triangle.
That's the setup I'm tracking. Thank you for your attention, and always manage your risk.

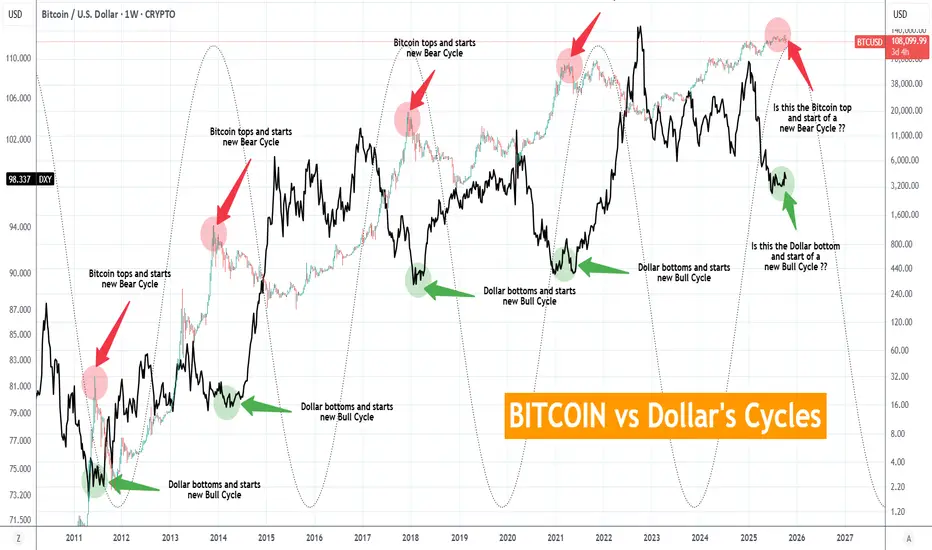
BITCOIN vs Dollar's Cycles. Has the new BTC Bear Cycle started?This is as simple as it can get. And obviously, it is not the first time we give you this chart. This is a cross-asset comparison between Bitcoin (BTCUSD) and the U.S. Dollar Index (DXY) illustrated by the black trend-line. It represents the Cycles of the two assets, typically negatively correlated across the span of 15 years.
As you can see, when the USD bottoms and starts a new Bull Cycle, BTC tops and starts a new Bear Cycle. Similarly vice versa with USD's Bull Cycle tops against BTC's Bear Cycle bottoms.
So the million dollar question is whether the USD has bottomed again. Based on the 4-year Cycle Model and as the Sine Waves illustrate on this chart, it may have. It is no surprise that while the DXY has formed Higher Lows since July 07, BTC has topped and turned sideways on ranged trading with a new Low made on last Friday's crash.
It is not necessary for the USD to break upwards aggressively in order for BTC to start dropping aggressively into its new Bear Cycle. As Jan - March 2018, Jan - March 2013 and May - August 2011 have shown, the USD may range sideways, as long as it is a clear sign of bottom formation, while Bitcoin is already into its Bear Cycle.
So the conclusion is that as long as the USD keeps trading sideways without making a new Low, it is quite like for Bitcoin to be entering its new Bear Cycle. Sound planning, calculated profit taking and gradual (to say the least) de-risking may be required.
So do you think Bitcoin's new Bear Cycle has started? Feel free to let us know in the comments section below!
-------------------------------------------------------------------------------
** Please LIKE 👍, FOLLOW ✅, SHARE 🙌 and COMMENT ✍ if you enjoy this idea! Also share your ideas and charts in the comments section below! This is best way to keep it relevant, support us, keep the content here free and allow the idea to reach as many people as possible. **
-------------------------------------------------------------------------------
💸💸💸💸💸💸
👇 👇 👇 👇 👇 👇
Bitcoin – Corrective Structure Developing#Bitcoin – Corrective Structure Developing
Current price: $110,350
Bitcoin continues to trade inside a corrective structure, suggesting the market may be preparing for another downward leg before a potential recovery.
🧩 Technical Overview
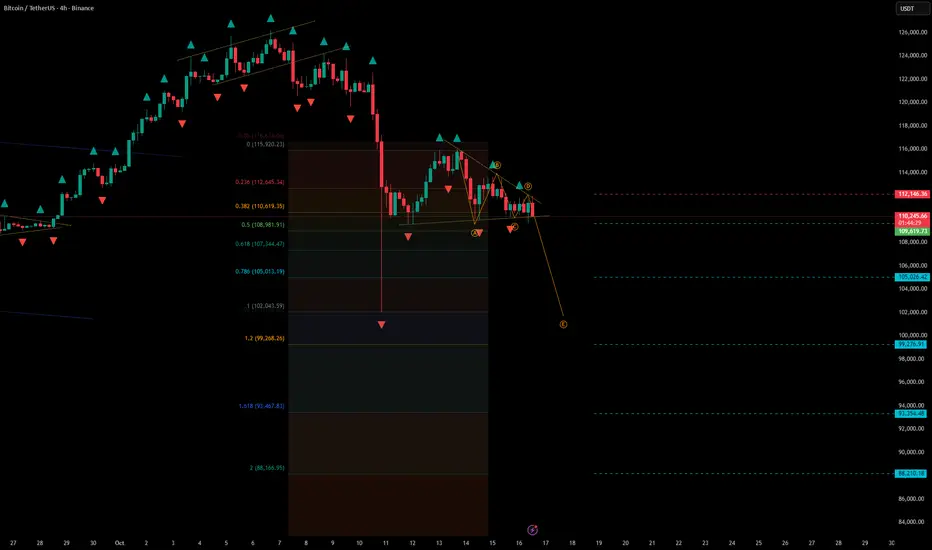
• Price failed to hold above the $112,000 resistance zone and has since formed a descending pattern, likely part of an ABC correction.
• The local structure shows repeated lower highs and compression around $110,000, confirming seller control in the short term.
• The correction remains active while price stays below $112,000–$112,500.
📉 Scenario
• The market is forming a short-term bearish continuation pattern, with potential extension toward deeper Fibonacci supports.
• Stop-loss: above the $112,000 resistance zone.
• Downside zones to watch:
– $108,900–$107,300 — initial support area (0.5–0.618 Fib range)
– $105,000 — critical pivot zone
– $99,000–$100,000 — key Fibonacci cluster and potential short-term bottom
– $93,000–$88,000 — extended target range if pressure intensifies
⚙️ Market Context
• BTC remains in a corrective pullback phase following a strong September rally.
• Broader sentiment shows reduced risk appetite across crypto and macro assets.
• A sustained break below $105,000 could accelerate selling pressure, while recovery above $112,000 would invalidate the bearish scenario.
🧭 Summary
Bitcoin continues to consolidate within a corrective pattern, leaning bearish below $112,000.
Short-term momentum favors further downside toward $105,000–$99,000, with deeper extensions possible near $93,000–$88,000.
Until a breakout confirms otherwise, the bias remains cautiously bearish in the near term.
BITCOIN SIGNAL: THIS IS WHAT WILL HAPPEN NEXT!!!(smash it) Yello Paradisers! Enjoy the video!!
And Paradisers! Keep in mind to trade only with a proper professional trading strategy. Wait for confirmations. Play with tactics. This is the only way you can be long-term profitable.
Remember, don’t trade without confirmations. Wait for them before creating a trade. Be disciplined, patient, and emotionally controlled. Only trade the highest probability setups with the greatest risk to reward ratio. This will ensure that you become a long-term profitable professional trader.
Don't be a gambler. Don't try to get rich quick. Make sure that your trading is professionally based on proper strategies and trade tactics.

BTC TECHNICAL UPDATE BTC TECHNICAL UPDATE
Price action still bearish in structure, hunting liquidity below. 107 ich
Now we’re trading around −1.5 deviation, with technical volume metrics confirming heavy, controlled selling.
Order flow remains high-volume bearish, but the intent looks mechanical:
liquidity grab → reset → build new base.
Current map
Targeting the 107ich zone — likely final liquidity pocket of this leg.
Below that, bids start stacking, hinting that large players already positioned.
If volume compresses and delta flips positive, expect shift back range.
Execution note:
Treat this as high-frequency setup, not a swing setup.
Keep size light, manage per-trade risk — structure says “controlled drive,” not “capitulation.”
—
Daniel Fadeley

Still believe in a short position on bitcoin
Yes, stopped out
But I insist on the direction of my position in the comming days.

BTC/USD (4H Analysis) — October 15, 2025Bitcoin is currently consolidating below the minor supply zone (113.5K–114.5K) and above the local demand zone (110.8K–111K).
The overall market structure remains bearish, with clear lower highs and lower lows forming after a strong rejection from the major supply zone at 120K–122K.
Key Zones
🟥 Major Supply: 120K–122K → heavy distribution zone from previous top.
🟥 Minor Supply: 113.5K–114.5K → short-term retest area.
🟩 Major Demand: 108K–110K → strong support area where buyers are likely to step in.
Main Scenario (Bearish Bias)
- Price may retest the 113.5K–114.5K zone soon.
- If a bearish rejection or engulfing candle forms, BTC could extend its drop toward 108K–110K.
Alternate Scenario (Bullish Reversal)
- If BTC closes above 115K (4H), the bearish structure invalidates, opening the path toward 118K–120K.
If you find this analysis helpful :
👉 Follow for more BTC & market updates,
💬 Share to help others stay informed,
❤️ Like to support and keep this research going!

BITCOIN Risky Short! Sell!
Hello,Traders!
BITCOIN is reacting from a horizontal supply area after a strong impulsive move down. Smart Money may engineer a retracement before continuing to target 111,300$ liquidity. Time Frame 2H.
Sell!
Comment and subscribe to help us grow!
Check out other forecasts below too!
Disclosure: I am part of Trade Nation's Influencer program and receive a monthly fee for using their TradingView charts in my analysis.

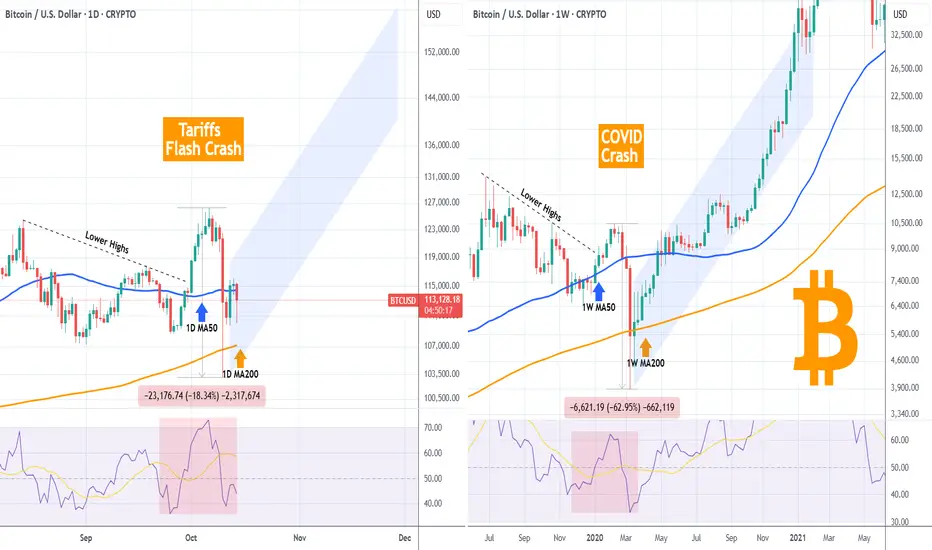
BITCOIN Is last Friday's flash crash similar to COVID's?Bitcoin (BTCUSD) made a strong flash crash last Friday following President Trump's tariff threats to China. That brought back memories of the March 2020 COVID crash. But are those that similar??
Quick answer: strength/ aggression wise no. Last Friday's crash marked 'just' a -18.34% decline from its top on a week basis. COVID's crash, which was longer admittedly, pulled the price down by -62.95% from February's 2020 High. Massive difference in market psychology and dynamics (even though we may have not seen the last of the current Tariff Crash). And that is the reason one chart is on the 1D time-frame and the other on the 1W time-frame.
However this is the exact reason that they look so similar in technical structure. As you can see both started on a Lower Highs downtrend, which broke to the upside that led to the eventual crash that broke below both the MA50 and MA200 (blue and orange trend-lines respectively). Even their RSI structures are similar.
The COVID crash taught us that as long as the MA200 closed the candles above it, a massive rally was sustained to new Highs. If the same structure is followed on the current fractal, we may see BTC rising by as high as $150k.
So what do you think? Do those two crashes share similarities that can justify a market recovery now? Feel free to let us know in the comments section below!
-------------------------------------------------------------------------------
** Please LIKE 👍, FOLLOW ✅, SHARE 🙌 and COMMENT ✍ if you enjoy this idea! Also share your ideas and charts in the comments section below! This is best way to keep it relevant, support us, keep the content here free and allow the idea to reach as many people as possible. **
-------------------------------------------------------------------------------
💸💸💸💸💸💸
👇 👇 👇 👇 👇 👇
BTC BUY Possible !Entered @12400$
BTC/USD Wave Update:
If a correction happens !
Bitcoin is completing wave (4) correction within the 113,200–112,700 support zone. If this level holds, a bullish wave (5) rally toward 116,500–117,000 is expected. A break below 112,700 invalidates the setup. Overall short-term trend remains bullish with minor retracement before continuation. COINBASE:BTCUSD

BTCUSD: Price can Rebound Up from Support line of PennantHello everyone, here is my breakdown of the current Bitcoin setup.
Market Analysis
Bitcoin has been through an incredibly volatile cycle. After reversing from a major low near the 109400 Support, we saw a powerful rally that led to a new ATH around 126000. Since that peak, the market has been in a deep and complex corrective phase.
Currently, this correction has taken the shape of a large pennant or wedge pattern. The price is consolidating and coiling within this structure. After a recent test of the upper boundary, the price is now pulling back towards the ascending support line for what I see as a critical test.
My Scenario & Strategy
I view the current pullback to the support line as a healthy correction and a logical place for buyers to show interest and defend the structure. A confirmed and strong bounce from this dynamic support would be the key signal for me that the pullback is over and the market is ready to challenge the highs again.
Therefore, the strategy is to watch for this bounce. A successful rebound is expected to lead to a rally that will break the intermediate Resistance at 117300. The primary target for the subsequent move is 118600, which aligns with the resistance line of the pennant.
That's the setup I'm tracking. Thank you for your attention, and always manage your risk.

BTCUSD – Resistance Now, but Bitcoin Will PrevailBTCUSD – Resistance Now, but Bitcoin Will Prevail 🚀
After the October 11th Flash Crash, Bitcoin recovered but today just lost its key support at 111,961 — which now acts as resistance. Earlier today, I went long on that level, but once price failed to hold, I closed immediately. That’s how we survive in this market — we play the levels. 📉
Current structure shows next supports at 109,517 and 108,700, with a deeper risk toward 102,000 if pressure persists.
For now, 111,961 remains the wall to watch. Any reclaim above it could flip the tone back to bullish. 🔁
Despite this short-term turbulence, I remain bullish on Bitcoin.
I’ve been divorced from altcoins for months — because Bitcoin represents the values we must return to if crypto is to survive this phase. These are what I call the Catharsis Cycles — cleansing moments before renewal. 🌅 stick around....
We’ve seen these before. The chart levels still work. Bitcoin will prevail.
Trading Wisdom 📜
When the chart tells you “get out,” listen. Levels are not suggestions — they are survival maps.
Discipline keeps you profitable longer than hope ever will.
One Love,
The FXPROFESSOR 💙
Disclaimer: These charts and analyses reflect my personal opinion only. I am not a financial advisor. Nothing here is financial advice, but i am pehaps the best in Prognosis and i believe strongly on what I say after i have examined everything. Trading involves risk, and you are fully responsible for your own decisions. Trade wisely and so will I.

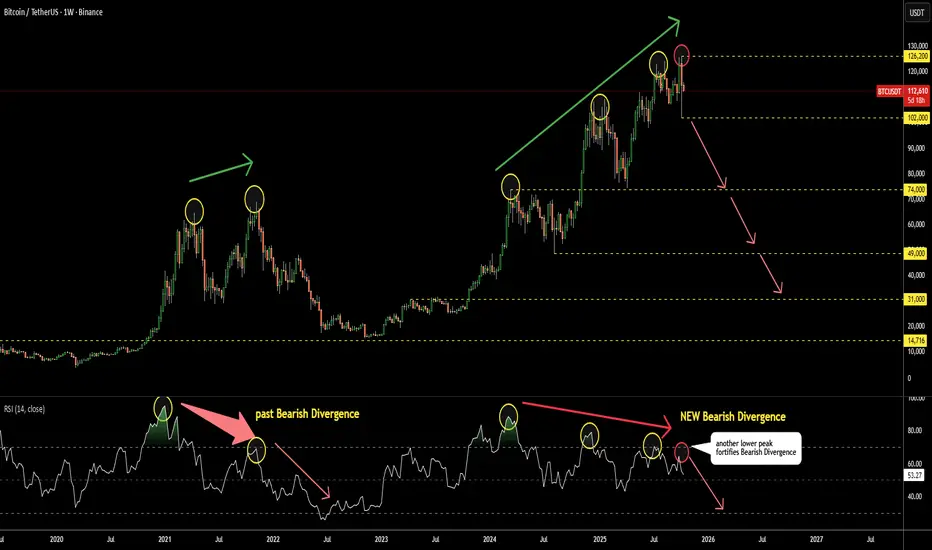
Bitcoin Update: Bearish Divergence on RSI Only Deepens This is a brief update to the analysis shared in August. The RSI has now formed a fourth consecutive lower peak on the weekly chart, further confirming the bearish divergence.
Monitor the RSI closely — a break below 50 (currently at 53) could signal the onset of a bear market.
The first key support level is near 102K, and a decisive move below this level would strengthen the bearish outlook.
BITCOIN... THE DROP IS NOT OVER YET!I see a lot of people fomo-ing to buy the dip, but I don't think this is the bottom yet. At least, that is not what my technical analysis is showing me.
I am expecting Bitcoin to likely go down to the 100k level again, maybe even less to 95k. The question is, will it go back up from there? I think there is a good possibility to make new all-time highs. BUT, if it does not show support or bounce hard, and higher timeframe candles start to close lower, this could mean quite bad things for crypto..
Let's wait and see..
Trade safe!
- R2F

BITCOIN — STRUCTURE SHIFT INSIDE BEARISH RANGEBitcoin has filled the 116.3 to 114.9 imbalance and is now trading inside a defined bearish range.
Lower-timeframe structure has shifted downward with significant volume left behind, which suggests this is not a place to buy into strength.
Price has completed the imbalance fill, and the next question is whether this area becomes a market-maker trap or a true continuation leg.
If smart money continues to build short positions, distribution could follow.
If liquidity dries up and buyers absorb, the trap scenario takes shape. Patience remains the correct position.
Focus on the 15-minute to 1-hour range for confirmation. A break of structure, a clean rejection, or a failed retest around 116.3 will define the next directional move.
Until that occurs, any trade inside this zone is a low-probability action.
On the macro side, the U.S. Dollar Index continues higher, signaling risk aversion and tighter global liquidity.
Bitcoin does not move in perfect correlation, but capital still follows the path of safety when the dollar strengthens.
In the current environment, the edge lies in observation and precision, not anticipation.
Let structure confirm before committing. Probabilities always favor the patient.

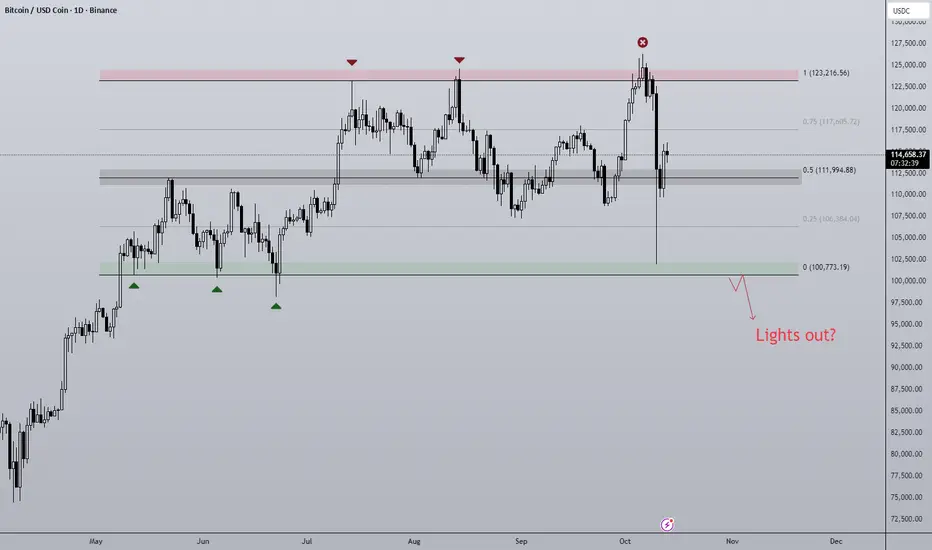
Post Flash-Crash BTC Despite such a large sell-off event, has the outlook on BTC actually changed? Structurally BTC remains very much rangebound with two clearly definable halves of the range. That is until Fridays move off the back of a Tariff Tweet from President Trump causing a liquidation event similar to that of April earlier this year and the Covid crash of 2020.
Bitcoin was less effected when compared to altcoins as is usually the case, some majors dropping as much as 80% in a single 1h candle! An entire bear market in an afternoon. Bitcoin on most exchanges fell roughly 20% on the news and eventually found support at range lows ($100,000), a significant amount of this drop got bought up and so BTC finds itself hovering around range midpoint.
To me this is a no trade zone initially, there is no clear directional bias that is actionable at this time but I am looking for clues as to where price may be going next:
- Should BTC stay above midpoint the next clear resistance level is 0.75 ($117,605). On the lower time frames the trend is bearish, 0.75 would be a good place for the bears to defend.
- A loss of the midpoint would open the door to backfilling the wick, this could get ugly as on the higher time frames a new lower low and price acceptance lower would signal a bearish shift in structure. Calls for "the top is in" will get much louder and so will the 4 year cycle theory comparisons.
- A V-shaped recovery and move straight to the highs would be max pain after such a brutal move down. Although IMO it's the least likely I would not rule it out.
BITCOIN SIGNAL: ROUND 2 OF CRASH INCOMING!!!? (watch out) Yello Paradisers! Enjoy the video!
And Paradisers! Keep in mind to trade only with a proper professional trading strategy. Wait for confirmations. Play with tactics. This is the only way you can be long-term profitable.
Remember, don’t trade without confirmations. Wait for them before creating a trade. Be disciplined, patient, and emotionally controlled. Only trade the highest probability setups with the greatest risk to reward ratio. This will ensure that you become a long-term profitable professional trader.
Don't be a gambler. Don't try to get rich quick. Make sure that your trading is professionally based on proper strategies and trade tactics.

BITCOIN Bullish Correction Ahead! Buy!
Hello,Traders!
BITCOIN taps into a horizontal demand area after sharp decline, signaling a potential bullish reversal. Smart Money likely accumulating positions before expansion toward 116,800$ to rebalance inefficiency. Time Frame 4H.
Buy!
Comment and subscribe to help us grow!
Check out other forecasts below too!
Disclosure: I am part of Trade Nation's Influencer program and receive a monthly fee for using their TradingView charts in my analysis.

BITCOIN Short squeeze in action with 1W MA50 saving the day?Bitcoin (BTCUSD) is rebounding rather as aggressively as it flash crashed on Friday following President Trump's threats on new China tariffs. We've seen the outcome of such Trade War threats back in February - April. In fact that was the last time (April 09 2025) that BTC hit its 1W MA50 (red trend-line). Following that, an enormous long-term rally followed that made new All Time Highs (ATH).
Friday was the first time since then that the price almost touched the 1W MA50, while breaking through the 1D MA200 (orange trend-line) for the first time since April 22. Friday's Low is so far technically a Higher Low on the 1-year Rising Wedge pattern.
The more U.S. and China seem to agree on a new truce and not move forward to escalate threats into actions, the stronger the current short squeeze will be in the market and the current rally will most likely target the top (Higher Highs trend-line) of the Rising Wedge on the key psychological level of $130000.
If however it appears that agreements fall through and the bottom (Higher Lows trend-line) of the Rising Wedge breaks, we expect a deeper and potentially more aggressive fall to he 1W MA100 (green trend-line) around $85000. It also has to be mentioned that Friday's Low hit the 1D RSI 4-month Support Zone and rebounded.
Which scenario do you think is more likely to happen? Feel free to let us know in the comments section below!
-------------------------------------------------------------------------------
** Please LIKE 👍, FOLLOW ✅, SHARE 🙌 and COMMENT ✍ if you enjoy this idea! Also share your ideas and charts in the comments section below! This is best way to keep it relevant, support us, keep the content here free and allow the idea to reach as many people as possible. **
-------------------------------------------------------------------------------
💸💸💸💸💸💸
👇 👇 👇 👇 👇 👇

Everyone’s Bullish Again… But Is Bitcoin Ready?As I explained in yesterday’s post , even though I want to stay bullish — partly because I still hold a bag of altcoins — the overconfidence across the market makes me cautious.
Everyone seems convinced that “the bottom is in.” and history tells us that when sentiment becomes one-sided, it’s often premature.
________________________________________
1. Recent Price Action
Bitcoin indeed reversed from a key support zone and managed to recover part of Friday’s losses.
However, so far, this looks more like a technical rebound than a return of genuine buying power.
Momentum remains fragile, and price is still struggling.
________________________________________
2. Key Technical Levels
• Resistance: The $118K horizontal level followed by the $120K psychological barrier remain decisive.
Only a clear breakout above these zones would signal renewed bullish control.
• Support: On the downside, failure to hold above $110K would likely trigger a new leg lower, erasing the recent optimism.
________________________________________
3. Outlook
The structure is neutral-to-bearish until Bitcoin confirms strength above $118K–$120K.
Until then, this bounce should be treated as a reaction, not a reversal.
________________________________________
Bottom line:
I still want to be bullish — but I’ll follow the chart, not the crowd.
Confirmation first, conviction later. 🚀

BTC 15M Analysis - Key Triggers Ahead | Day 55☃️ Welcome to the cryptos winter , I hope you’ve started your day well.
⏰ We’re analyzing BTC on the 15-Minutes timeframe .
👀 On the 15-minute timeframe for Bitcoin, we can see that after breaking out and consolidating above the $114,351 zone, BTC began moving upward and is now trading within a 15-minute range. A breakout from this range could trigger the next move. The top of this trading range sits at $115,715 and the bottom at $114,750 — breaking and holding beyond either level could start a strong leg for Bitcoin as the new week begins.
🧮 The RSI oscillator on the 15-minute timeframe shows Bitcoin currently moving within a range capped at 64 on the top and 42 on the bottom. A breakout from this RSI range could significantly increase buying or selling momentum, adding fuel to Bitcoin’s next move.
🕯 The size, volume, and count of green candles have increased since the flash crash, and institutions like BlackRock, World Liberty, and Trump-aligned funds have been averaging solid buy positions. With rising buying volume, Bitcoin could break through its ticker-seller resistance at $115,715 and continue its bullish move following the recent dramatic flash crash.
🔍 Despite concerns like the ongoing U.S.–China economic (tariff) war, the market remains in a risk-off mode on higher timeframes. If entering trades, we aim to manage capital across multiple entries — for example, allocating only 0.25% risk per position or averaging in gradually.
🧠 Two trading scenarios are considered for Bitcoin, both offering clear opportunities for structured entries.
↗️ Long scenario (breakout above the range):
If Bitcoin breaks above $115,715 with rising buy volume and RSI crossing above 64, it could initiate another strong bullish leg toward higher resistance levels.
📉 Short scenario (breakdown below the range):
If the micro-buyer support at $114,750 — a key demand zone — breaks, Bitcoin may extend its correction downward. This move should coincide with RSI losing the 42 level and increasing sell volume. Note: in short positions, take profits quickly and maintain tight risk-to-reward control.
❤️ Disclaimer : This analysis is purely based on my personal opinion and I only trade if the stated triggers are activated .
