Drop today? 8800 is on the table?!Hello everyone,
Today AlphaTradeZone Team wants to show you possible option how Bitcoin can trick shorters.
As we all see and know that $9.4k is strong support - our first thought is to load Long position.
But what if to scroll back and see how price acted previous time on that support?
If you see, every dump stopped at $9.4k, but after a few days of flat accumulation - price squeezed down all the longs, collected liquidity and went up.
Usually squeeze takes around 3-4% down, and buy up with increased volume, trapping breakout sellers.
THe more volume price will gain on this mive down - higher it will go.
According to 4H candlesticks, this move is likely to happen.
Also, dropping volume confirms the same.
Bitcoin-short

BCHUSD Inverse Head and Shoulders! Hello Traders
Today's chart will be an update on BCHUSD!, Potential inverse head and shoulder!
Points to consider
- Potential Inverse head and shoulders
- Volume declining on right shoulder
- Calculated target would be a potential double bottom
- VPVR showing low volume of transactions after support
- EMA’s acting as resistance
- RSI putting in lower highs
- Next potential support will be the .618 Fibonacci
BCHUSD may potentially be putting in an inverse head and shoulders which is a very common bearish formation. Confirmation will be a break of the neck line which price is testing right now…
Volume has clearly declined on the right shoulder and with EMA’s providing resistance to price, BCH is probable of breaking its Neck Line. The calculated target of this Inverse head and shoulder will potentially retest yearly lows.
This makes clear sense as there is low volume of transactions according to VPVR after the Neck Line, bears could easily plummet BCH. RSI is putting in clear lower highs, showing us a potential bearish divergence; again giving bears an upper edge
What are your thoughts? Will this be the beginning of capitulation for BCHUSD and all other ALTS?
Please leave a like and comment
And remember,
“All you need is one pattern to make a living.” – Linda Raschke

Weekly and Daily analysis on BITCOIN by ThinkingAntsOkTake this post as an idea to identify relevant areas of the chart, after that use it to support or discard your own trade setup
Main Items we see on the Daily Chart:
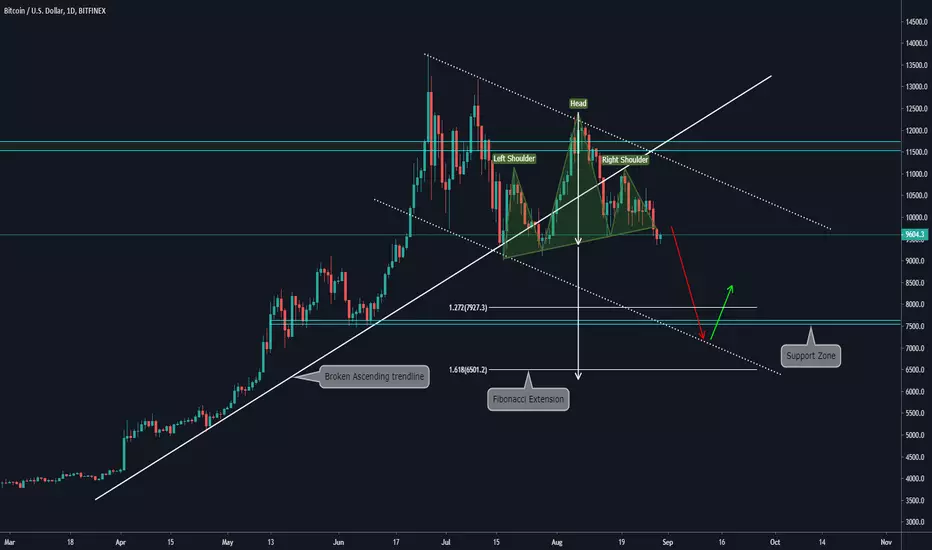
a)The major ascending trendline is broken
b)The Downside move that we can expect is really interesting to think on short setupS + you can have a Risk Reward Ratio of 2:1 more or less
c)After the main Trendline was broken we saw almost 2 bear traps, and then the price returned to current levels (this support the short thesis)
d)We can see a Head and Shoulder Pattern using the Broken ascending trendline as a guide.
e)Based on our analysis we expect a continuation of the bearish movement towards the 7600 LVL
Weekly Vision:
Bitcoin Update #13 - Black Hole Sun !Hi, today we are going to talk about Bitcoin and its current landscape.
Finally, Gann got broken and showing us the force of this indicator after the breakout Bitcoin started to accelerate towards the next Gann support, as highlighted in our chart above. As previously reported in our analysis of the weekly and monthly charts, this devaluation was expected for us. We hope that our readers had benefited from our given guidance.
Thank you for reading and leave your comments if you like.

Bitcoin Short Trade Set up.#XBT Broke down from a multiday range on good volume. This is a pullback continuation setup. These trades often get stopped out, but I am trying to be as conservative as I can. Please do not use more than 1.5% of your capital on this trade. If the price does not reach your short limit order, let it go, do not chase this trade. Many expect a bounce of $9400-9000 support zone, I don't. There will be some reaction, but I expect a lower support zone to fail. Anyhow, please use the stop loss on your short and take profit at the next support zone. Risky trade!!!! Good luck.
Feel free to join my free telegram channel. Link in the bio.

Bitcoin (XBTUSD) short.All description on the chart.
Please, don't forget to like and follow.
Thank you.

Bounce and fall, Bitcoin will return to $8000 supportThe downtrend line continues to operate, we will go back down, reload your short at approx $10300 to take advantage of the fall again. Short Short Again ;) Easy Money.


Bitcoin holding up at $10,000, is ALT Season here?Hello my good friends. Hope everyone is doing well in this midweek trading session. From my last post, Bitcoin was holding my previous support line pretty nicely, even when Binance went down for a 6 hour system upgrade. Yesterday however, Bitcoin fell back down under my yellow support line showing signs that it has failed. Effectively, I readjusted the line to match the two new double bottom dips that have formed from the past week. This new yellow support line is holding and is now showing a strong bull presence with the RSI recovering from its earlier 30% mark. This recovery is also pushing the price up towards the two exponential moving averages. Taking a look at them, we can see that the 50 EMA and 100 EMA had another death cross last week when the price dropped 10%. This death cross being a strong downward indicator, leads me to believe that BTC has a one last shot to recover a bit before following its downward channel ultimatum. As for the CME gaps, the two that are active from prior week and month, are the $11.9k Gap and the $8.6k gap. With the downward channel becoming more prominent, the target of BTC hitting $8.6k is stronger than it breaking the confirmed red selling pressure line and going up to $11.9k.
With that said, we have two nice opportunities coming up including one presently here. For a monthly trader, the present opportunity is to short BTC as it looks like the downward channel is confirmed and that BTC should eventually hit CMEs $8.6k price gap and cover it before any recovery upward. However, this is Bitcoin and it can easily get pumped back up to $11.4k towards the top of the downward channel line bringing about the second trade entry point. Here, you can wait for BTC to rise up to the top of the downward channel line from the current moment, and safely enter a $11.4k short position with a stop loss at $12k in case the $11.9k gap does get covered prior to BTC price reversing. Keep in mind that both of these positions are highly volatile due to the nature of Bitcoin, and always trust your ideas and decisions before investing. I am personally waiting for the second outcome to happen before making a trade to short BTC. With this 4H time frame analysis, the support lines are pushing this consensus down to September 1st and I am willing to wait till then for that entry. If that entry comes sooner I will keep you guys updated.
This analysis has been updated from my previous three posts, and I always appreciate your guy's support and comments to improve my TA. I also peeped that most of the Alt coins from the recent drop have bin holding when compared to BTC and am wondering if ALT Coin season is coming sooner than later. So I pass the question to you my beautiful trader friends. What do you guys think will happen by September 1st with the Crypto markets?
As always,
Onward and Upwards,
Vick


BITCOIN:At the edge of the cliffHello dear traders,
Let's keep it simple.
Summary & trading plan:
- We perfectly called for 10450 dollars XBTUSD zone failure to hold, and we saw a strong bearish move as anticipated yesterday in our idea, targeting low 10k.
- Bitcoin is now sat on the edge of a Daily Cliff and we can see very low targets if it triggers. Please, read the detailed analysis for further details and targets if the idea is triggered.
- Still hedged from >11k4.
- Looking for altsbtc setup considering this potential weakness.
- For live updates on btc & alts, and for free trades, follow us on twitter.
Weekly
a/ Market structure: still intact bullish structure, but indecisive at the moment. In the same time, weekly chart is showing us a trendwall that is getting weaker and weaker here . A trendwall is basically a trendline that is drawn based on a point of resistance, and a point of support during an uptrend, that allow us to get an idea of the exact place where price can reverse. Considering it provided support already three times, we now have to consider that the next test is not going to hold, and we are going to break down, each test making the trendwall weaker and weaker. Weekly support to monitor is 8750.
b/ RSI: indecisive but can definitely move down for a reset.
c/ MACD: Under Bearish Crossover in positive territory. => Consolidation on this TF and a retest of support is possible.
Daily
a/ Market structure: still intact bullish structure, but indecisive at the moment. Breakout of resistance right before monday close. Tuesday confirmed our idea of a bearish rising wedge that is in play now. Support at 9800, 9500 then a possible swing failure pattern at 9k to run the stops that could make us close to the weekly support at 8750 usd. Chart is here. A close under Monthly Open at 10100 is your trigger for downside continuation .
b/ RSI: Indecisive, on support line. A break of the support would confirm our bearish plan and gives strong momentum to the downside. If we have to face a daily downtrend, lower target an be expected and 7800 usd is possible.
c/ MACD : Under bearish crossover, and crossed the centerline, so under bearish territory. That's look bad to be honest at the moment, let's see on daily close.
4 hour
4 hour:
a/ Market structure: Break of Bullish Market structure because we broke down strongly, breaking the low that created the top. We tagged resistance and got rejected. A close under 10100 is your trigger for downside continuation . Volume is decent and we can expect sellers to step in if we see continuation. Chart is here.
b/ RSI: Broke down the trendline. Look like momentum found some support here.
c/ MACD : Under bearish crossover and looks like headed to bearish territory.
Cheers.

BTC Weakness Shows. Bitcoin Slams Back Down Below $10,000Check out the previous 2 publications of my thoughts on the weakness of Bitcoin. It seemed very early on (2 days ago) we hit a ceiling and it has played out.
Always good to see what the 6 hour is doing. Never try and long resistance or something that has stopped moving forward.


Bitcoin (XBTUSD) short.All description on the chart.
Please, don't forget to like and follow.
Thank you.

Bitcoin fractal downtrend comparison and demand drop! (Part 1)As in every market bitcoin price changes come from supply and demand. The supply changes slowly relative to the daily fluctuations in the price so we can consider the supply relatively constant on daily trading timeframe. Most of the demand comes from speculation. Therefore, by tracking the public interest changes we can relate it to the price movement. The best way I found for doing that is by checking the traffic on binance and coinbase with alexa website.
Looking at the Alexa rank 90 day trend, we can see that the interest has already peaked a few weeks ago as the price was around 13k - 14k. Since then, there is almost linear downtrend in the Alexa rank. Considering that as a short signal and that the top of this move is 14k, the second part of the analysis comes in.
We can think of the bitcoin price movements as mass psychology reflection of fear and greed. Therefore, fractal relationships between uptrends as well as downtrends might exist reflecting the repeating patterns of buying and selling from mass psychology. In this Part 1 and the next Part 2, I will show more evidence of this fractal relationship between the last downtrend from 20k to 3.5k and the current one from 14k.
The yellow ellipse represent the bull trap and in both cases it reaches similar retracement percentages (around 65%). The blue ellipse is where I think we are currently at. If this fractal relationship continues we should see a sharp drop in the coming days to 8k, followed by a move up to around 9.5k, then followed by a sharp move down to around 6k.
Of course, there are no guarantees for that and the short position target will be updated as more information becomes available but for now first target is 8k.
For more information on how to get a free trial of my fund, feel free to message me.
For the next two months, I will be posting free trading ideas in crypto, stocks and commodities.
Like and follow me for the next Part 2 tomorrow when I am going to dive in the fractal relationship between the two downtrends.
