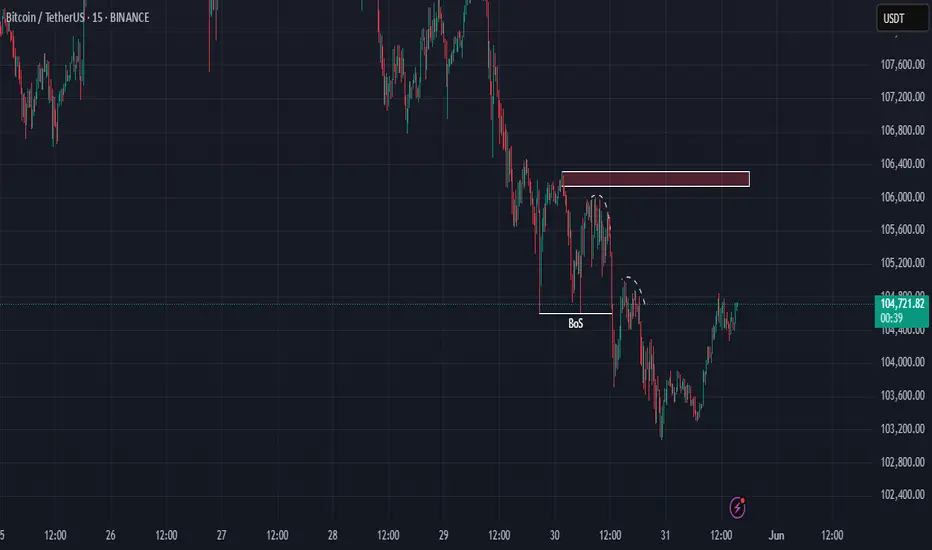
Bitcoin - time to take 100k Bitcoin - time to take 100k
Price is at VAH with rising open interest
all other coins are pumping
That's why I think BTC cna take that zone
after we`ll se what's next - big drop or break above VWAP
Bitcoin-trading

XRP Breakdown: $2 Support Lost, $1.60 in Sight?📉 In December, XRP lost its key $2 support and closed the week with a 3% dip. The breakdown flipped $2 into resistance, a bearish signal as momentum weakens.
📊 Buyers showed up around $1.80, but the bounce lacked strength due to low volume, limiting any chance of reclaiming lost ground. Price structure now favors lower lows.
🕯️ Next key support sits at $1.60, a level not seen since April and October 2025. If bears stay in control, this could be the next major test before bulls regroup.

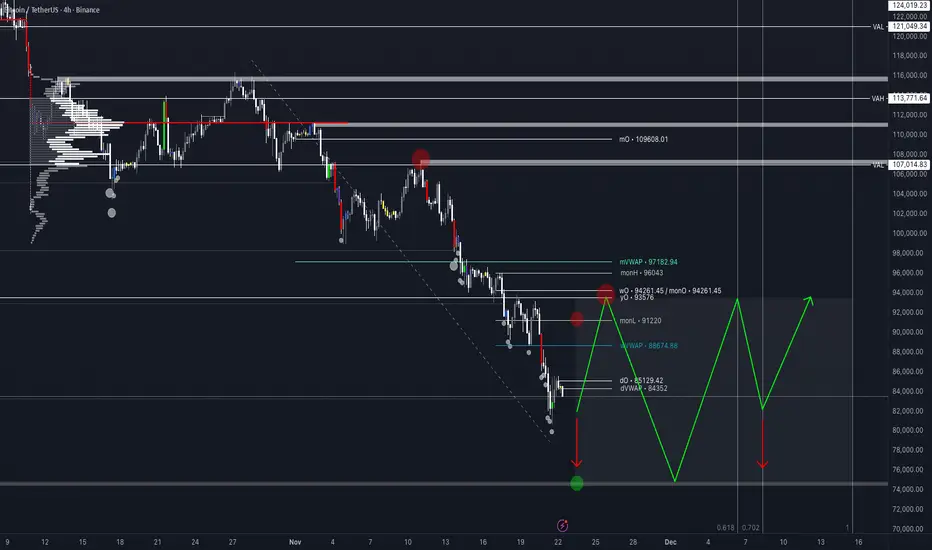
BTC Local Trend. Reversal Zone. Targets. Tactics. 23 12 25Logarithm. Time frame: 1 day.
Local downtrend. After the decline, the price is trapped in sideways consolidation for a long time (the idea is for stop-loss levels to accumulate on both sides). Price is near the breakout zone.
Buy fear in parts, sell joy in parts.
🟢 Upward breakout (trend + key local levels and, due to the short stop-loss domino effect, momentum) — fulfillment of the Dragon pattern's targets (first targets).
🔴 Downward breakout (support and long stop-loss zone) — fulfillment of the descending flag's targets (long stop-loss domino effect), at least partially.
More upside than downside, possible through stop-loss accumulation. But it's important to wait for a breakout in one direction or another.
A patient and consistent person will be rewarded, while a restless person will not.
Use trigger orders on both sides of the reversal zone:
1️⃣ for an upward breakout in the market (marker order) - 2 local zones;
2️⃣ and simultaneously for a decline - 2-3 trigger limit orders.
If you do this, you won't have to constantly monitor charts, news, opinions, and so on like a speculative addict, and you won't care at all which way the price goes. After all, your orders will trigger in the direction of the trend, and won't trigger (cancel them later) in the opposite direction. The exception is if your first orders hit a false exit, but this is taken into account in risk management and position allocation.
Risk should always be justified and controlled by you. This is the foundation of everything. If this isn't the case, you're building a speculative house on a clay foundation, trying only to guess the price. Sooner or later, it will collapse, and the later it happens, the more painful it will be.

How to Use VWAP in Confluence with StructureVWAP is one of the few indicators that consistently adds value when used correctly. It does not predict direction and it does not replace market structure, but it provides a powerful reference point for where fair value sits within the current session or trend.
When combined with structural analysis, VWAP helps you filter trades, improve timing, and avoid impulsive entries that fight the underlying flow.
The first step is understanding what VWAP represents. It shows the average price weighted by volume, reflecting where most transactions have occurred. When price trades above VWAP, it signals that buyers are in control of the session.
When price trades below it, sellers dominate. This context becomes meaningful only when it aligns with the higher timeframe structure.
Start by establishing your bias through market structure.
If the higher timeframe is in an uptrend and price trades within a discount zone, VWAP becomes a dynamic confirmation tool. A reclaim of VWAP after a liquidity sweep or after a break of structure is one of the cleanest signals that buyers are stepping back in.
The same applies in reverse for downtrends: a VWAP rejection after a pullback into premium strengthens the short bias.
VWAP also adds clarity during intraday consolidation. Ranges often form around VWAP because it reflects the session’s equilibrium. Breakouts that occur away from VWAP without pullbacks frequently lack durability.
However, a breakout followed by a retest of VWAP shows acceptance and builds confidence in continuation. This combination turns a common indicator into a reliable filter rather than a standalone signal.
Another effective use of VWAP is identifying exhaustion. When price aggressively pushes far above or below VWAP, it often signals that the move is extended. This does not mean you fade the trend, but it does mean you tighten expectations and wait for structure to align before entering. Once price reconnects with VWAP and shows intent, the next move becomes more sustainable.
VWAP becomes particularly powerful when paired with session logic. Trading above VWAP in a bullish higher timeframe environment during London or New York sessions often leads to cleaner impulses.
Trading against VWAP during low-volume hours produces far more false signals. Timing, structure, and VWAP together create a cohesive framework.
Used in confluence, not in isolation, VWAP supports disciplined decision-making.
It aligns entries with momentum, filters low-quality setups, and clarifies whether the market accepts or rejects a level. When you combine VWAP with structure, liquidity, and session context, your trades become more intentional, less emotional, and significantly more consistent.
Bitcoin Toxic Flows! We need to find balance. After the violent & toxic order flow selling this week on CRYPTOCAP:BTC spot holders in pain, but as traders we have a few key levels to observe. READ PREVIOUS POST ^ for dates & timing. We have major weekly level at 75k & yOPEN 93.5k.
The cleanest outcome is to auction price with organic flows, how does the market find balance? We range. This can come from a squeeze up 1st to test the 93.5k supply or rip the band aid off & give us 75k test. From there? we simply need to observe all flows with zero bias as mercenary sharp shooting traders.
80K is well supported for now. 1.49billion aggregated. But as we have seen this week, key levels breaking one after another. Either way, I would enjoy a range here, why? it simply makes for better trading.
Have a great weekend all!
Strong Support Holding - BTCUSD Buy OpportunityHello Followers, I am going to share you my opinion on BTCUSD next move.
BTCUSD is currently respecting the 89,000-90,000 support zone, indicating strong buying interest. A breakout and hold above support zone presents a high-probability buying opportunity towards the next move targets. As long as price remains above support, bullish continuation toward targets 93,600 and then 96,000 remains likely. If BTCUSD break the support zone then protect downside risk with a stop loss at 87,500.
KEYPOINTS:
Entry-level 90600
Target Area 93600
Target Area 96000
Stop loss point 87500
Support area 89000/90000

ETH/USDT: Price Decline Warning, Caution for Buy Opportunities!The ETH/USDT pair is currently facing clear downward pressure after failing to break through the strong resistance at 4,150.00. The 4-hour chart shows that Ethereum is moving in a short-term downtrend, with prices heading towards the important support level of 3,780.00. The strong rejection from this area indicates that the current market sentiment is leaning towards selling.
The market's cash flow also reflects short-term distribution, and the RSI indicator shows that ETH has previously entered overbought territory, and may continue to correct downward. These factors suggest that Ethereum could continue to face selling pressure, especially if the support levels are not strong enough to hold the price.
Impact of Recent News:
1. Australia's Core Inflation Data Rises Sharply: Australia's core inflation index increased by 1.0% in Q3, exceeding the forecast of 0.8%. This reduces expectations of a near-term rate cut and could affect ETH/USDT if the USD strengthens.
2. Expectations on U.S. Federal Reserve's Monetary Policy: The market expects the Fed to maintain high interest rates, which could strengthen the USD and put downward pressure on ETH/USDT.
Conclusion: Given the current downtrend and pressure from technical indicators, ETH/USDT is likely to continue decreasing over the next 48 hours. However, traders need to be cautious and closely monitor the support level at 3,780.00. If the price shows strong signs of recovery from here, it could present a good opportunity to enter the market.

UDSUSD – FVG’s Not Filled, Trend Ain’t Done YetHey There Guys,
Post-BOS, the market’s still pushing with upside momentum.
That upper +FVG hasn’t been filled yet, so the trend’s not showing signs of fatigue.
The Strong Buy Zone below is still in play—if liquidity gets pulled down there, buyers could step in hard.
As long as we don’t get a daily close below the main support zone, dips are still buying opportunities.
I will share updates here.
Every like you send is my biggest motivation to keep sharing these setups. Big thanks to everyone backing me.

BTC has formed an inverted Head & Shoulders pattern 🚨 CRYPTOCAP:BTC Bullish Pattern Alert! 🚨
CRYPTOCAP:BTC has formed an inverted Head & Shoulders pattern 🔄
👉 If price breaks out above the neckline, it would confirm a bullish trend 📈
⚠️ Key point: Breakout confirmation above the neckline is crucial — watch for retests to avoid fakeouts.
👉 A confirmed breakout would signal strong bullish continuation with buyers in control ✅

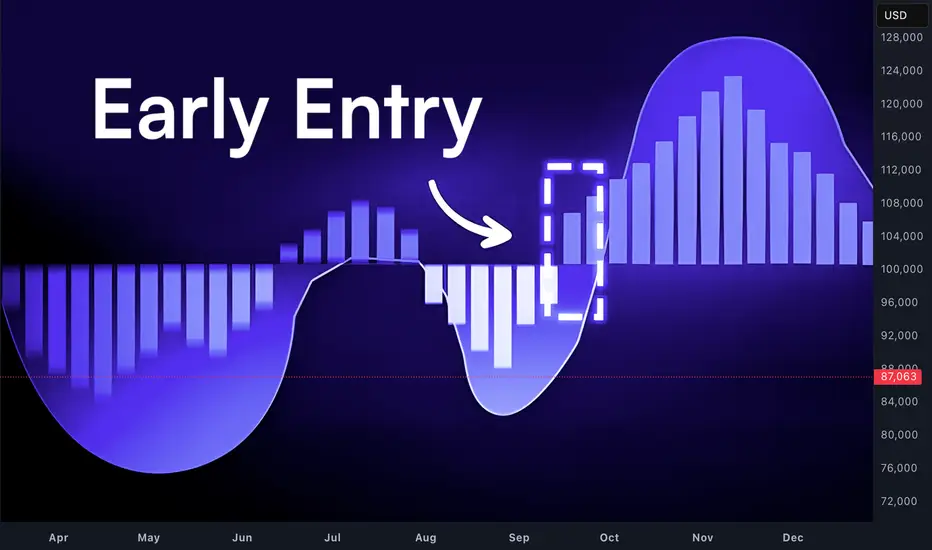
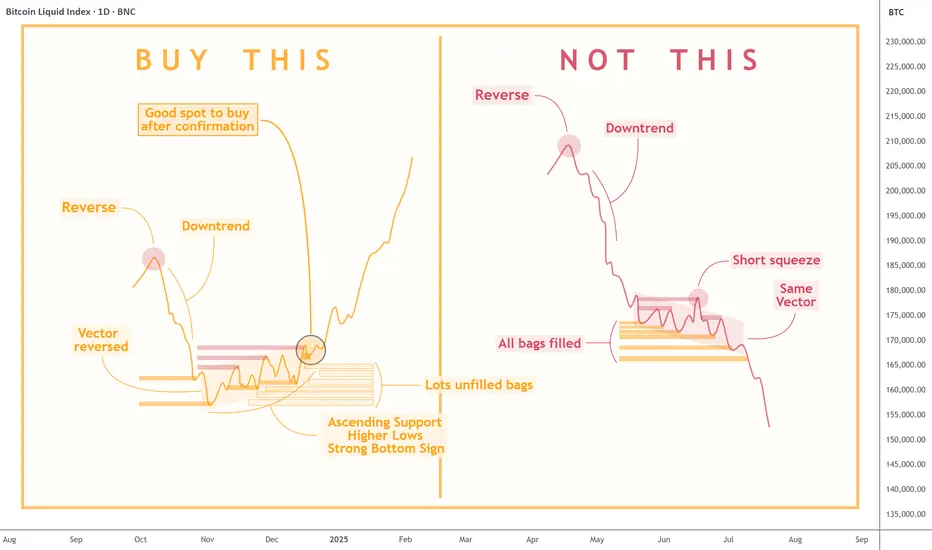
Quick Lesson: How to Identify Trend ReversalKnowing when to enter the market can mean the difference between making a profit and incurring a loss. The chart above clearly compares two similar-looking scenarios with very different outcomes: the one you should aim for and the one you should avoid.
- On the left , we see a textbook example of a bullish reversal. After a significant downtrend, the market prints higher lows and begins forming an ascending support. This signals that selling pressure is fading and buyers are stepping in. Notably, there are usually lots of unfilled bags — latecomers who show strong demand below the current price level but never get their orders filled, and who then just hit the 'market buy' button, which adds fuel to the fire of pump.
- In contrast, the right side shows a very similar pattern — a downtrend followed by consolidation, but with crucial differences. Here, all prior liquidity zones have already been filled, meaning there is less incentive for buyers to support the price. The “same vector” suggests price action hasn’t changed direction, and a common short squeeze traps late buyers before resuming the decline. This is a common bull trap , where a temporary price pump gives false hope before another leg down.
To sum up , a REAL REVERSAL builds on structure, accumulation, and higher lows—whereas a FALSE BOTTOM is often characterized by brief rallies, exhausted liquidity, and no change in vector trend. Experienced traders wait for confirmation and accumulation before entering a position, not just a temporary pause in a downtrend.
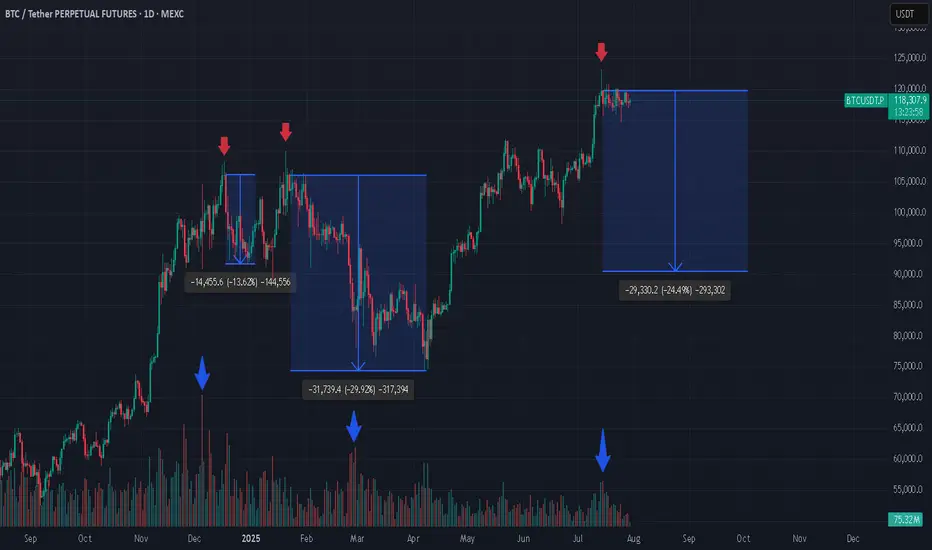
3 Bitcoin Tops, Weak Green Candles, and What’s Next? If you're closely monitoring the Bitcoin (BTC) market, patterns often begin to reveal themselves in surprising ways. In the attached chart, I’ve highlighted three major local tops that Bitcoin has made, each marked by a weak green daily candle. What’s even more striking is what comes next: a dramatic increase in trading volume, followed by steep corrections.
Spotting the Pattern: Weak Green, Heavy Volume
At each pointed top (see red arrows), BTC formed an all-time high (ATH) with a relatively weak green candle, hardly the sign of euphoric buying strength.
Look closely at the volume bars below (blue arrows). Each time, as price struggled to push higher, volume surged after the top, often a signal of major sellers stepping in or longs closing en masse.
What followed? Significant corrections: -13.6%, -29.2%, and, now it might be shaping up for another potential drop (-24.1%) if history rhymes.
Why Does This Matter?
From a technical analysis perspective, volume is the fuel behind price moves. When a new high is reached with limp buying (weak green candles) but is swiftly met with rising volume on the way down, it’s a classic sign of distribution, a strong hand selling into retail euphoria.
Is Another Drop Coming?
Given the consistency in behavior, it’s not unreasonable to ask: are we about to witness another similar correction now that BTC has again hit a top with a weak green candle and volume is ticking up? The historical evidence certainly makes it plausible.
Long-Term Perspective: Still Bullish
Despite these corrections, my long-term outlook remains bullish. Every cycle has corrections, they’re opportunities for healthy consolidation, allowing strong hands to accumulate and the market to reset for its next leg higher.
*not investment advice
#crypto #btc #bitcoin #finance #trading
Bitcoin & Altcoins: Technical Analysis and Market OutlookBitcoin (BTC) Analysis
Bitcoin is currently forming a short-term bullish pennant within a larger long-term pattern, projecting a potential target around $135K.
Key Levels: BTC is consolidating between the lower zone at $117.3K and the upper zone at $119.7K.
Breakout Potential: A break above this pattern could propel BTC toward a new all-time high (ATH), surpassing the current ATH at $123K.
Macro Events This Week:
Wednesday: The Federal Reserve will announce its interest rate decision, with no changes expected.
Wednesday: ADP Employment Report, providing insights into potential future rate cuts.
Friday: Non-Farm Payrolls (NFP) data release, which could further influence market sentiment.
Ethereum (ETH) Breakout
Ethereum has decisively broken through its 4-year historical resistance around $3,725, closing the week above this level. This breakout signals a strong bullish outlook for ETH, with potential for further upside.
Altcoin Highlights
BNB: Has shattered its previous all-time highs, showcasing significant bullish momentum.
XRP: Reached approximately $3.64, reflecting strong gains and market interest.
Market Context
The crypto market is showing robust activity, with altcoins following Bitcoin and Ethereum's lead. Key macroeconomic events this week could introduce volatility, so traders should stay vigilant.
Disclaimer: This is not financial advice. Every trader is responsible for their own strategy and risk management.
Happy trading and good profits! 🚀

vision paintingthis is sort of a game, i would like to play with anyone interested in chart riddles. i'm being very specific with my inputs, and coloring, painting a picture of what i need to see and when. painting whats there, guiding to where itll be. wondering if i could actually create art pieces here. hypothetically the 'paintings' would need to be back checked, to artificialy create any worth to it. market involvement is day/week trades. *no advice whatsoever. so, i think ill give it a go. from here onwards, these posts are the only ill post, with updates, within the comments of such post. happy trading
ballino

Premium zone tagged — now we watch how the Smart Money reactsBitcoin just tapped into the 108,151 level — the top of a measured premium range and a likely area where profit-taking begins and fresh distribution footprints form.
This run-up wasn’t random. Price surged from inefficiency, cleanly filled the fair value gap (FVG), and is now flirting with a key liquidity pocket.
Here's what the structure says:
Premium reached: 108,151 (0% fib)
If rejection holds, Smart Money looks to discount entries:
0.236: 106,136
0.382: 104,889
0.5: 103,882
Deep retracement zone: 0.618 at 102,874
Final defense for bulls? The unmitigated FVG block between 101,440 → 99,613
Possible Playbook Scenarios:
Quick retrace → higher high:
Bounce off 104,889 or 103,882 before attacking 108,967+
Deeper sweep:
Into 102,874 (0.618) before Smart Money steps in again
Invalidation:
Break below 99,613 closes this bullish narrative and confirms a structural break
TL;DR Execution Logic:
Wait for retracement into 0.5–0.618 fibs
Look for bullish reaction (engulfing or SFP)
Upside targets:
108,151 (retest)
108,967 (liquidity sweep)
Further upside if momentum sustains

BTC – Stop Hunt at the Edge of ValueThis is what a liquidity raid looks like.
Price just swept the bottom of the range, tapped into the low-volume zone (as seen on the volume profile), and reclaimed — classic sign of a trap sprung.
Key points:
The downtrend line labeled “comp” = compression — bulls forced to capitulate into a thin zone
High probability deviation with stop run and reclaim — this fuels the next move up
The green box shows risk-defined entry off the sweep low
Targeting the prior high: 106,787
Volume imbalance filled = no inefficiency above — price can now move cleanly
Execution mindset:
Trap spring → retrace into structure → expansion
Risk is clear, liquidity is engineered, structure remains
Late shorts just became the fuel.
Watch the reclaim of the box top. If that flips support, we ride momentum.
📈 For more setups like this — including pre-breakout traps — check the description in the profile.

The FVG above isn’t the target. It’s the bait.This is a classic Smart Money sequence. Most are watching the imbalance at 106.5k–108.7k and expecting immediate delivery. But that’s not how this game works.
The setup:
Price broke down violently, then reversed with momentum — stopping right beneath the daily FVG block. That alone tells me it’s not ready. It’s gathering.
Below? Multiple fib levels that haven’t been tested — 104.4k (0.236), 102.6k (0.0), and a volume-backed rejection wick that still holds weight.
The market is likely to dip again — pull into deeper discount, reset the low timeframe narrative — and only then attack the FVG and upper sweep zones.
What I expect:
Sweep of 102.6k (final liquidity run)
Reaction → reclaim 104.4k
Push into the FVG toward 106.5k (0.5) and possibly 107.4k (0.618)
No emotional reaction to the red candles — this is structure playing out, not weakness unfolding.
Plan:
Ideal Entry: 102.8k–103.2k range
SL: Below 102.6k
TP1: 105.6k
TP2: 107.4k
Final: 108.7k clean inefficiency fill
Let it dip. Let it breathe. That’s where conviction is built.
Final thought:
“The real move starts when they convince you it’s done.”

BTC/USDT: Correction to H1 Demand Zone? Multi-Timeframe Strategy🔹 H1 Context (Bullish):
- Demand zone (green) below Fib 0.5: Key support.
- Breakout (BOS) suggests bullish continuation *after possible correction*.
🔹 M5/M15 Situation (Short-Term):
- Price rejecting red zones (immediate resistance).
- Scenario 1 (Bearish):
→ If price respects red zones: Correction toward H1 demand ($103K).
→ Action: Short trades in M5/M15 targeting green zone.
- Scenario 2 (Bullish):
→ If red zones break: Confirmation of strength (new highs target).
🔹 Risk Management:
- Short entries: Rejection at M5/M15 red zones + M1 confirmation.
- TP: M15 lows ($103.5K) or H1 demand zone ($103K).
- SL: Close above red zones.
🔹 Technical Key:
- H2 Order Block as dynamic support: If respected, prevents drop to H1.
- Confluence: H1 demand + Fib 0.5 = High-probability area.
#BTC #Bitcoin #Trading #Crypto #H1 #M15 #TechnicalAnalysis #Fibonacci
btc . recap . w3 . maymon to eager . wait mon to show its hand - cw!
. early LONG compound because of the bullish outlook
- tp2 108462
tue didn't ride momentum - blind bullish
. tp1 HIT
. missed SHORT at 10pm (UTC+2)
- should have traded the momentum of mon looking to form support during the week later . for more compound LONG
wed mid of range . cw
. no trade zone
thu
. waiting for run of aLow during ny
. compound LONG - 101485
. tp1 HIT
fri didnt catch enough upward momentum
. tp1 HIT
. last limit order for bullish continuation . tpo - 102862.5
wknd
. tp1 for weekly LONG idea finally hit
. duration 5d 22h
. +4.33%
conclusion :
trade what you see, go with momentum, but have a narrative.
outlook :
america downgraded from AAA to AA+ . People will turn hardcore bearish, once the price starts falling. this could be the trigger to find the long awaited drop - while having retail call out a bearmarket . massive potential here, to both sides. wOpen and monday full data (while keeping an close eye on tpo and footprint charts), are key .

btc . may . w3 . friyesterdays LONG was beautiful. ny ran aLow, and never looked back pushing higher.
. new aver entry . 102353
i'm right now scalling into new limit LONGs
. aLow . wVWAP . cw0.5 . liquidity grad - in this BULLISH environment
a last limit order is placed at pdTPO
. 102862.5
SL has been lifted to give new trade breathing room
i see us go to cwHigh . 105871, to which tp1 has been changed.
cheers

XAU/USD: Gold Regains Strength After Pullback – New Highs Ahead?By analyzing the gold chart on the 2-hour timeframe, we can see that yesterday, as expected, gold surged above $3400, reaching as high as $3439 before facing strong selling pressure, dropping sharply to $3359.
Currently, gold is trading around $3385, and if the price can hold above $3366, we may expect further bullish momentum. I believe gold is setting up for another move above $3400, potentially aiming to break into new highs once again.
THE LATEST ANALYSIS :
Please support me with your likes and comments to motivate me to share more analysis with you and share your opinion about the possible trend of this chart with me !
Best Regards , Arman Shaban

btc . wOpen . SHORT weakwOpen with a run down to current range volume profile LOW + minor SFP low (liquidity grab)
- Stop out LONGS
- Catch late retail SHORTS - squeeze them to top range + higher
the friday SHORT was good, but didn't catch momentum
looking to move TP1 to cW 0.5 retrace level @ 93.809
i see this pump higher . though cautios, because these levels are late LONG entries only
looking for LONGS around
93.777 - 92.782
tp1 . 95.843
tp2 . 99.490
if we see a down momentum shift, act accordingly
- i believe this to come towards wednesday

XRP / RIPPLE | 30M | IMPORTANT LEVELSFriends,
I valued your requests and prepared the following Ripple analysis: If Ripple drops below the level of 2.1807 for 30 minutes, the target will be the 2.1424 level. This level holds a very significant support zone.
The most critical support level is located at 2.1085.
If Ripple does not fall below this support zone, my target level for Ripple will be 2.2495.
Please don't forget to like.
Thank you to everyone who supports with likes.

btc . w4 - wknd . SHORT but cautious - yet paytientfriday plan, was to SHORT (see prvs post)
sell zone
starts . friday open
ends . monday open
entry . 95.542
sl . -2.62%
10 sell orders . 1.52% spread
tp1 . 91.642 . +3.99%
funding . +0.01%
we are according to plan + collecting funding
tp1 adjusted to moderate, since bullish outlook coming from april.
tp2 . +10.11%
