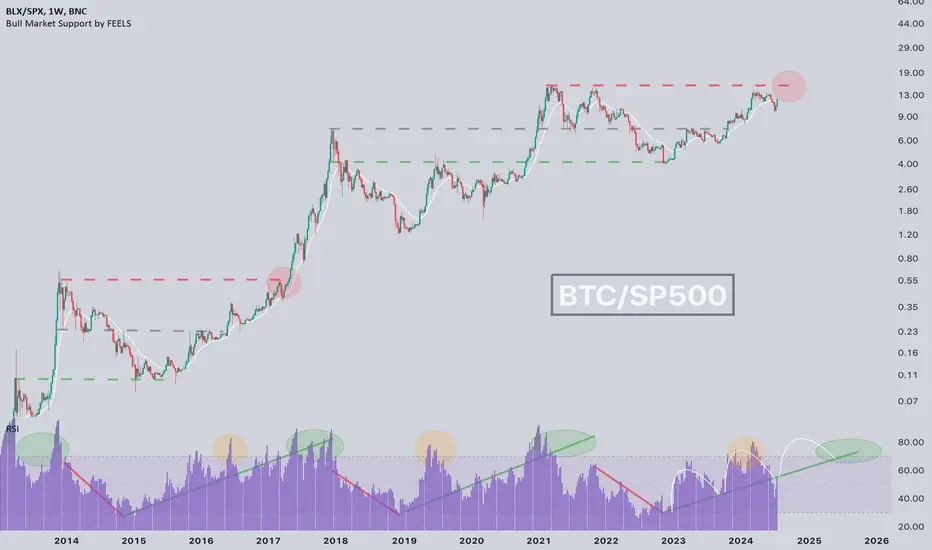
Bitcoin ATH hasn't happened yet !?CRYPTOCAP:BTC ATH hasn't happened yet ⁉️
If you don't count in fiat currency, we haven't seen the 2021 high exceeded yet (In relation to the stock market)
📝Everything is going according to plan, and by the end of this year, we will see a real ATH.
💡Also, it is clearly visible on the RSI that we
Key data points
Previous close
—
Open
—
Day's range
—
Bitcoin Bull/Bear/RecoveryThis chart illustrate the 4-year pattern for bitcoin's price, going through bull, bear and recovery phases.

Bitcoin 1 000 000$ ❚ Livermore cylinder📣 Hello everyone!
I bring to your attention my, I’m not afraid of this word, GLOBAL trading idea for Bitcoin for the decade ahead!
☝️ Now let me, as briefly but informatively as possible, explain to you how, step by step, Bitcoin will most likely come to $1,000,000 dollars, as well as what the two

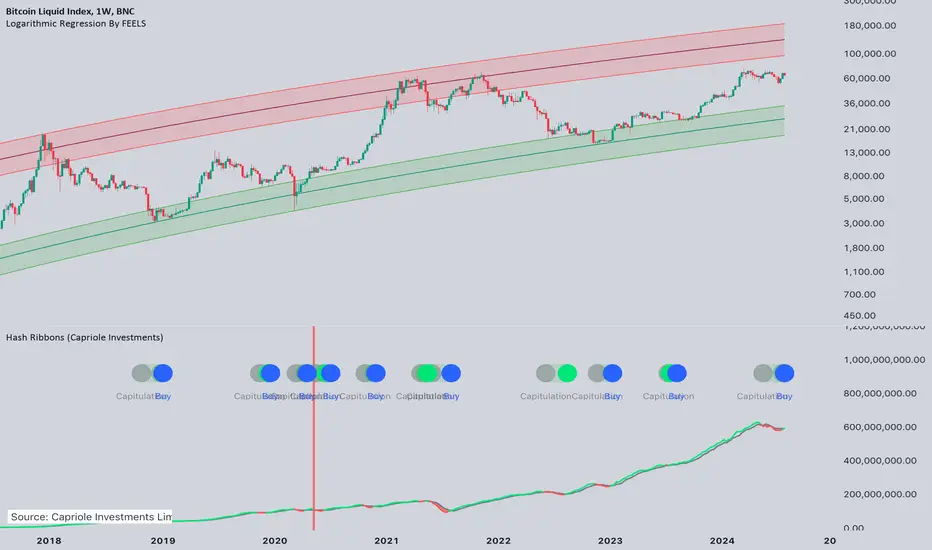
Hash Ribbons - Wrong Signals?🗣: Yesterday we received a buy signal on Hash Ribbons and today we fell, why ⁉️
Answer: The Hash Ribbon is primarily an indicator of the CRYPTOCAP:BTC hashrate, it is 2 moving averages, and when after the capitulation of the miners (after the halving), we reached the plateau at least a little and
Minimum width on Bollinger bandsCRYPTOCAP:BTC Minimum width on Bollinger bands 🤔, What does it mean?
Of course, like last summer, seasonality has played a big role - volatility has fallen.
📝We have tested the lower part of the channel and are now testing the middle line. With a breakthrough, we have an open path to the upper pa


We are all Satoshi- BTC wasn't created to to make you more rich.
- BTC is here to give you more freedom.
- P2P ( peoples to peoples )
- Don't look always at trends and just believe in the method and the idea.
- we are so early.
Happy Tr4Ding !

Bitcoin - Is it Time to Panic?At the low yesterday, the price of Bitcoin was down a little over 27% from the all-time high in March. In previous bull market cycles, we have seen many corrections of 30% or more. As was the case in past cycle corrections, we are seeing a lot of panic selling. Another issue is being in over leverag

Is the Correction Over?In each cycle, from the bottom to the high in the pre-halving rally, #BTC has seen an increase of 330%-370%, followed by a minimum correction of -38% or, with the exception of the rule (pandemic), -62%.
At this moment, a 38% correction means a price of $45,700, while a -62% correction means $27,900

FUTR CORN 5000Cycles gonna cycle!
Corn can’t resist crashing the party right when it’s getting good.

See all ideas