BTCUSD Technical Analysis – Is a Correction on the Way?BINANCE:BTCUSD is currently trading inside a well-defined falling wedge, and the price is pressing against the lower boundary of the pattern. This level could serve as dynamic support, and if a strong rejection occurs, we may see a corrective move toward the 102,000 resistance area.
If sellers successfully defend that zone, the bearish structure remains intact, increasing the likelihood of BTCUSD moving back down to lower price levels. However, if price breaks above this resistance, a deeper correction toward the upper boundary of the wedge could unfold.
At this stage, closely monitoring candlestick signals and volume activity around this key area is essential for spotting high-quality selling opportunities. Ensure every trade setup is backed by solid confirmation, and always maintain strict risk management.
If you have any thoughts or additional perspectives on this setup, I’d be happy to hear them. Feel free to share your opinion in the comments!
Bitcoin (Cryptocurrency)

Check for support near the M-Signal indicator on the 1M chart
Hello, fellow traders!
Follow me to get the latest information quickly.
Have a great day.
-------------------------------------
(USDT 1D Chart)
(USDC 1D Chart)
USDT is the major currency that influences the coin market.
The USDT and USDC charts are moving in opposite directions.
This decline appears to be driven by funds flowing out of USDC.
Once the USDC gap decline stops, funds flowing in through USDT are expected to drive the coin market higher.
-
(USDT.D 1M Chart)
For the coin market to show an upward trend, USDT dominance must remain below 4.91 or show a downward trend.
We need to see if the price can face resistance around the Fibonacci level of 0.618 and turn downward.
If not, we should consider a response plan, as a rally toward 7.13 is expected.
-
(BTC.D 1M chart)
For an altcoin bull market to begin, it must either remain below 55.01 or show a downward trend.
Therefore, for the bull market we're waiting for to occur, both USDT dominance and BTC dominance must decline.
If USDT dominance declines while BTC dominance rises, a bull market will emerge, with only BTC rising.
--------------------------------------------------
(BTCUSDT 1D Chart)
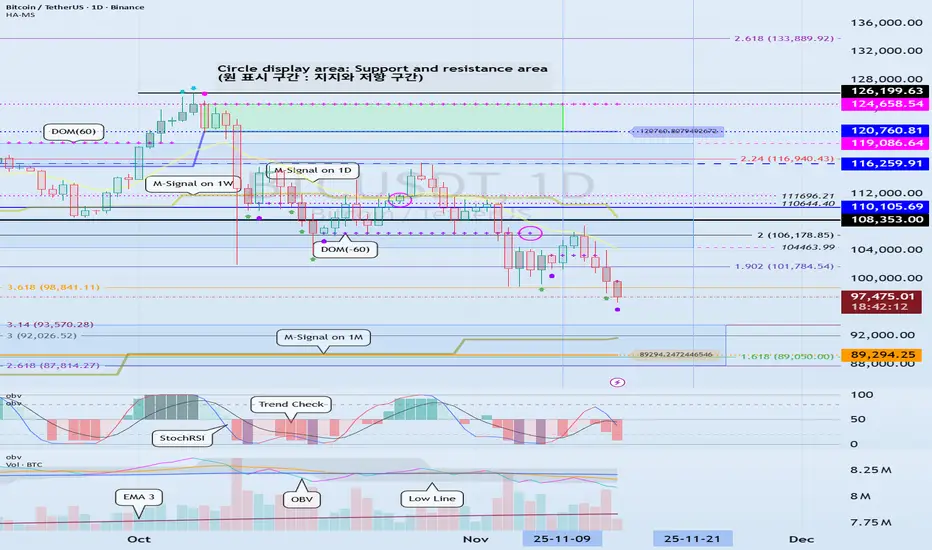
The key is whether the price can touch the M-Signal indicator on the 1M chart and turn bullish.
At this point, it's crucial to maintain the price above 89294.25.
If not, a step-down trend is likely.
To turn bullish, the price must remain above the M-Signal indicator on the 1W chart.
At this point, it's crucial to maintain the price above the newly created HA-High indicator point of 110105.69 on the 1M chart.
If not, the price may pretend to rise but then fall again, so you need to consider countermeasures.
This is a basic trading strategy within the box range: buy between DOM(-60) and HA-Low and sell between HA-High and DOM(60).
If the price rises in the HA-High ~ DOM(60) range or falls in the DOM(-60) ~ HA-Low range, you should switch to trend trading.
To do this, we should consider the movements of the StochRSI, TC (Trend Check), and OBV indicators.
To sustain the uptrend after breaking above a key point or range, the StochRSI, TC, and OBV indicators must show upward trends.
At this point,
1. The StochRSI indicator should not have entered an overbought zone.
2. The TC indicator should remain above zero.
3. The OBV indicator should remain above the High Line.
Therefore, check the movements of the StochRSI, TC, and OBV indicators at the support and resistance levels depicted on the 1M, 1W, and 1D charts and consider whether you can trade accordingly.
Based on the current price range, the key points or ranges are:
- 87814.27-93570.28
- 110105.69
- 120760.81-124658.54
I believe the three ranges above are important points or ranges.
Therefore, when the price is near these ranges, you should check the movements of the StochRSI, TC, and OBV indicators to determine a response plan.
-
Thank you for reading to the end.
I wish you successful trading.
--------------------------------------------------
- This is an explanation of the big picture.
(3-year bull market, 1-year bear market pattern)
I will explain in more detail when the bear market begins.
------------------------------------------------------
BTCUSDT.P - November 6, 2025BTCUSDT is currently consolidating above a rising trendline, with potential breakout zones at $104,496 for a bullish move targeting $106,659, or below $102,684 for a bearish continuation toward $101,164. The setup suggests a breakout-driven trade depending on which level is breached first.

Fear & Greed Index — Rebuilt as a Macro Oscillator for CryptoThe Fear & Greed Index is everywhere — a popular way to gauge market sentiment.
But it's usually just a mix of volatility, momentum, and social buzz...
📉 Not exactly macro.
This script is a technical reinterpretation of the Fear & Greed concept — but grounded in real, measurable economic behavior .
🧠 The Core Idea
This indicator is powered by the Copper/Gold ratio , a time-tested signal used by economists and institutional traders to track macroeconomic cycles:
- 🟢 When Copper outperforms → the economy is likely expanding → risk-on → Greed
- 🔴 When Gold outperforms → the economy may be contracting → risk-off → Fear
Copper represents industrial growth , while Gold signals defensive capital flows .
We track this ratio over time using a Z-Score oscillator to identify when sentiment is statistically stretched in either direction — highlighting moments of macro-level greed or fear.
📊 Why It Matters for Crypto
Crypto doesn’t live in a vacuum.
It's highly sensitive to the broader risk environment.
This oscillator gives you a macro lens to help:
- Anticipate bullish or bearish shifts in crypto markets
- Avoid common emotional traps at sentiment extremes
- Build entries or exits around macro confluence zones
It doesn’t tell you when to buy or sell — it tells you when the market context is shifting .
🔧 How to Use It
- Watch for the Z-Score entering > +2 (Greed) or < -2 (Fear)
- Use it to confirm broader risk-on/off behavior
- Combine with BTC or ETH price for potential lead/lag relationships
- Customize the tickers to test other macro pairs (e.g. SPX/VIX, BTC/DXY)
📈 Built with Pine Script v6
🔍 Default Tickers: CAPITALCOM:COPPER vs TVC:GOLD
📦 Fully customizable inputs, clean visual design, alert-ready
💡 Use this to trade with context — not emotion.
If you found this useful, give it a like and drop your feedback or improvements below 👇

BITCOIN Free Signal! Buy!
Hello,Traders!
BITCOIN taps into a major higher-timeframe demand area, reclaiming structure and sweeping downside liquidity. A bullish reaction here may drive price toward the next internal range high.
--------------------
Stop Loss: 88,783$
Take Profit: 94,407$
Entry Level: 91,500$
Time Frame: 1D
--------------------
Buy!
Comment and subscribe to help us grow!
Check out other forecasts below too!
Disclosure: I am part of Trade Nation's Influencer program and receive a monthly fee for using their TradingView charts in my analysis.

Bitcoin run is over BTC chart shortly . The season probably has been over
This pattern is not accepted yet , but looks promising
Just personal opinion
Not financial advice

BCH Update🚨📊 BCH Update
BCH has also formed a new resistance zone in red 🔴.
This level is now acting as a strong ceiling,
and price must break out above this red resistance
to show any real bullish momentum again.
Until that breakout happens,
sellers remain in control and upside stays limited.

Bitcoin - This chart is crumbling!⛔️Bitcoin ( CRYPTO:BTCUSD ) creates a massive top:
🔎Analysis summary:
All the previous cycles on Bitcoin have been lasting about 1,000 days. And exactly three years ago, Bitcoin retested the previous all time high, starting the next bullrun. If we soon see bearish confirmation on Bitcoin, this crypto will lead to another insane bloodbath.
📝Levels to watch:
$100,000 and $50,000
SwingTraderPhil
SwingTrading.Simplified. | Investing.Simplified. | #LONGTERMVISION

2025 Bitcoin cycle over, prepare for 2029. Phase A — “Early Downtrend”
Nov 2025 → Apr 2026
Bitcoin drifts down from $100K–$95K
Enters $80Ks
Weekly momentum failing
Phase B — “Cycle Breakdown → Panic Flush”
Jun 2026 → Nov 2026
Macro liquidity tight
Miner stress increases
ETF inflows slow or briefly reverse
Price cascades into $60Ks and $50Ks
Monthly oscillators bottom out
You BUYS HERE: ($68–$55K)
This is your PRIME accumulation zone.
Rinse, repeat. This is how true Bitcoiners do it.
UP FOREVER: Bitcoin Doesn't Care About Your Opinion
@upforevermovie

btc is ready to reloadAfter the recent increase, Bitcoin should activate more stop losses and eventually reach the $85,000-$87,000 range after a period of range fluctuations. After that, we expect the price to grow.

BTC/USD: Sell Pressure Building AgainBTC/USD: Sell Pressure Building Again
Market Summary
BTC/USD continues to operate within a declining market environment where sell-side pressure remains dominant. The recent recovery attempt has shown limited strength, forming only a temporary corrective phase within a broader downward cycle. Current conditions indicate that the market is preparing for another bearish continuation as liquidity builds on the upper side.
Market Behavior
The chart highlights a consistent pattern of declining impulses followed by shallow recoveries. Each upward phase has been met with swift rejection, reinforcing the dominance of bearish sentiment. The mid-range compression visible in the current structure reflects a controlled environment where market participants are redistributing positions rather than initiating larger upward transitions.
Momentum remains weak on the upside, and overall flow continues to align with the prevailing sell-side direction. Repeated structure shifts earlier in the sequence indicate that sellers are maintaining control of directional movement.
Current Setup
BTC/USD is now approaching a zone historically associated with short-term manipulation and liquidity grabs. Price appears to be forming a tight consolidation while climbing into this region. Such behavior often precedes a sell-side continuation, especially when rallies fail to show progressive expansion.
The chart projection suggests a likely formation of a distribution-style sequence before a renewed downward movement. This scenario aligns with the market’s broader behavior over recent sessions

BTC (MBT) on the way ot 86'000Price reacted very well at the white and red fork lines (see arrows).
We have left the white centerline, and now price is hovering around the red one. If we get an open and close below it, we’ll have a new target: the WL1 of the white fork, which unsurprisingly, lines up with the red L-MLH.
Rough times ahead...

BTCUSDTP. - November 18, 2025Price is pulling back toward a clear support zone around 93,000, with a deeper support level near 92,000, while the nearest resistance sits around 96,200 along a descending trendline. The chart suggests a possible bounce from support toward resistance, but a break below 93,000 could open the way toward 92,000.
If trading this setup, the long scenario is higher-risk, as price is currently trending downward into support and could continue lower before reversing.

MSTR – Approaching Major Support as Downtrend ContinuesMicroStrategy remains in a clear higher-timeframe downtrend, and if Bitcoin continues to weaken, NASDAQ:MSTR could slide further toward the next major support level — now sitting roughly 63% below its all-time high. This zone may act as a potential reversal area, especially if market sentiment stabilizes.
Trade Setup:
• Entry Zone: $170 – $180
• Take Profit Targets:
🥇 $280
🥈 $360
• Stop Loss: $122

BTC Daily View 17.11Hey friends! How’s your trading week starting off?
In my last Bitcoin post, I shifted my invalidation zone from 96,600 to 95,545 and said that if 95,545 breaks, then 96,600 won’t hold either.
Well… it broke — so I revisited the chart.
Now I think the correction after the drop should be bigger than I first expected.
For now, I’m looking at a move up toward 98,400, and then a possible continuation of the downtrend.
I still see two paths — along the orange and purple arrows.
❌ Invalidation zone: 94,850
⚠️ Not financial advice — just sharing my view.
Trade your own plan, always use stops.
⭐ Follow for updates
💬 Drop a reaction in the comments!

Bitcoin to $340k by March 2026?Bitcoin is quietly forming one of the largest high-timeframe bullish structures we've ever seen — a massive cup-and-handle / inverse head & shoulders hybrid that mirrors a multi-cycle trend stretching all the way back to 2015.
We just tapped the trendline for the third time, and historically, BTC’s explosive legs have always started right after this kind of multi-touch compression.
📍 Technical Setup
Long-term ascending channel (2015 → now)
Repeated bullish structure with measured-move targets around +350%
A clean breakout from the handle places BTC right around $340k–$345k
March 2026 aligns with both the channel top and the projected cycle extension
💥 Why This Could Be the Max-Pain Scenario
The market spent the last 60 days liquidating:
Overleveraged long traders
10/10 liquidation-event tourists
OG whales expecting another “easy” 4-year cycle play.
This creates the perfect fuel for a melt-up as liquidity rotates back upward. Max pain isn’t down — it’s a breakout that leaves the majority completely unpositioned.
⏳ Timing
The setup suggests:
End of year → First quarter of next year: momentum builds
2025 → 2026: extension move toward channel top
Target zone: $340k
Time window: March 2026
This is a slow-burn, high-timeframe structure that most traders simply aren’t looking at.
📈 Final Thought
Everyone is focused on short-term chop. Meanwhile, Bitcoin might be printing its most perfectly aligned macro structure since 2015.
If this breaks out like the previous two cycles, the move won’t give many chances to “buy back in.”

BITCOIN The 1W MA50 Bear confirmation you didnt want, happened..Bitcoin (BTCUSD) just closed last week below its 1W MA50 (blue trend-line) for the first time since March 06 2023. Since that break-out, the 1W MA50 had been tested and held on 3 major occasions within the Bull Cycle, providing the most optimal mid-Cycle entries during those 2.5 years.
What's even more important than this time distance, is the fact that every 1W candle closing below the 1W MA50 has always marked/ confirmed the start of the new Bear Cycle historically. This is something that we've presented to you and discussed numerous times this year, as we were analyzing BTC's 4-year Cycle theory and why October was the most likely Cycle Top candidate time-wise.
This time we are looking at the previous Cycle more specifically, due to the strong similarities so far leading to the current Top. First of all the end-of-Cycle rallies on both started after a clear test and rebound on the 1W MA50. At the same time, the both displayed Higher Highs, against the 1W RSI's Lower Highs, which is a huge Bearish Divergence and the first strong indication that the Cycle Top may be forming.
The Cycle Top on both came when the 1W RSIs were 70.00. Also the 1W MA50 break-out took place around the 0.382 Fibonacci level from the last test/ rebound. As you may realize, there is a high degree of symmetry here both price-wise and in terms of RSI. If that continues, we can expect the Bear Cycle bottom to be at least on the 1.618 Fibonacci extension at $55000.
So do you think that the closing below the 1W MA50 has confirmed the new Bear Cycle? Feel free to let us know in the comments section below!
---
** Please LIKE 👍, FOLLOW ✅, SHARE 🙌 and COMMENT ✍ if you enjoy this idea! Also share your ideas and charts in the comments section below! This is best way to keep it relevant, support us, keep the content here free and allow the idea to reach as many people as possible. **
---
💸💸💸💸💸💸
👇 👇 👇 👇 👇 👇

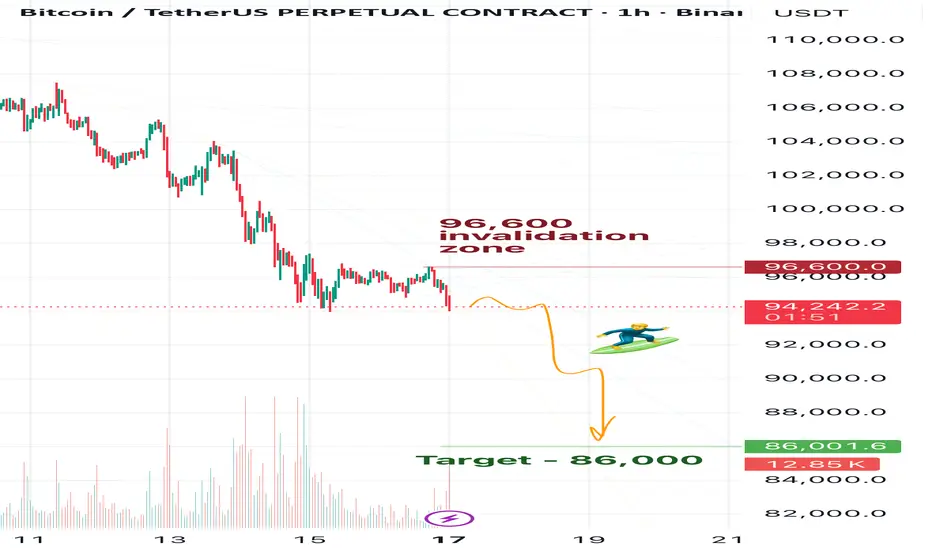
BTC Daily View 17.11Friends, as you may remember from my previous Bitcoin updates, I’m expecting BTC to reach 83k. At the moment, in my view, Bitcoin is already preparing for this move down.
However, for now my main target is 86k — I think BTC currently has enough momentum only to drop to that level. Before we see 83k, it will likely need to build more energy.
So after hitting 86k, I expect a correction — probably a prolonged one. But let’s see what the market gives us.
🎯For now, my target remains 86k.
❌Invalidation zone: 96,600
⚠️Disclaimer:
This is not financial advice. Please make your own decisions according to your own trading rules, and never trade without stop-losses.
🗯️If you find my ideas helpful, please leave a reaction and write a comment — your support really matters to me
TradeCityPro | Bitcoin Daily Analysis #223👋 Welcome to TradeCity Pro!
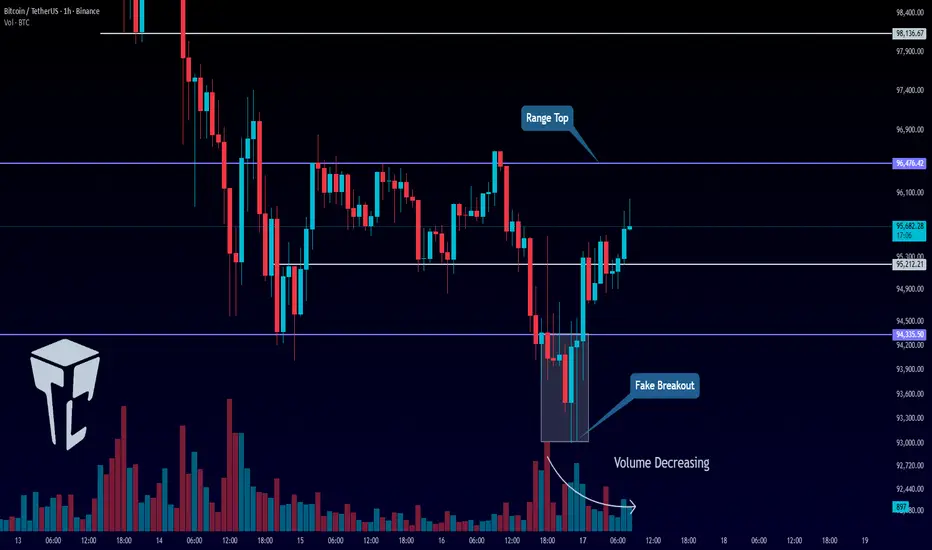
Let’s dive into the Bitcoin analysis. Yesterday, Bitcoin made a fake downward move and is now back in its range box.
⏳ 1-Hour Timeframe
Yesterday, the short triggers we had at 95,212 and 94,335 were activated, and the price moved slightly downward. However, this bearish move turned out to be a fakeout, and the price started moving upwards again.
✅ Currently, the price has moved above 95,212 and managed to stabilize above this level. The next resistance zone for Bitcoin is at 96,476.
⚡️ The 96,476 zone was faked yesterday, and after a candle closed above it, the price moved downward. Now, we need to wait for the price’s next reaction to this level to refine the exact breakout point.
✨ After this encounter, we can open a risky long position if the level breaks on the next attempt. The next target above this level is 98,136.
📊 For a short position, since the price faked the bottom of the range, the chart is a bit messy. I personally prefer to wait for the price to establish more structure and for a new trigger to form. We can then open a new position upon the breakout of the next trigger.
💼 For previously opened short positions, we can move the stop loss above the 96,476 level.
❌ Disclaimer ❌
Trading futures is highly risky and dangerous. If you're not an expert, these triggers may not be suitable for you. You should first learn risk and capital management. You can also use the educational content from this channel.
Finally, these triggers reflect my personal opinions on price action, and the market may move completely against this analysis. So, do your own research before opening any position.
Bitcoin MULTI supportsat $94 on weekly , looks like Bitcoin has many support-lines which could make it bullish to $118k again

BTCUSD Daily: Watching for Post-ATH Correction Pattern to UnfoldPotential Local Bottom Ahead?
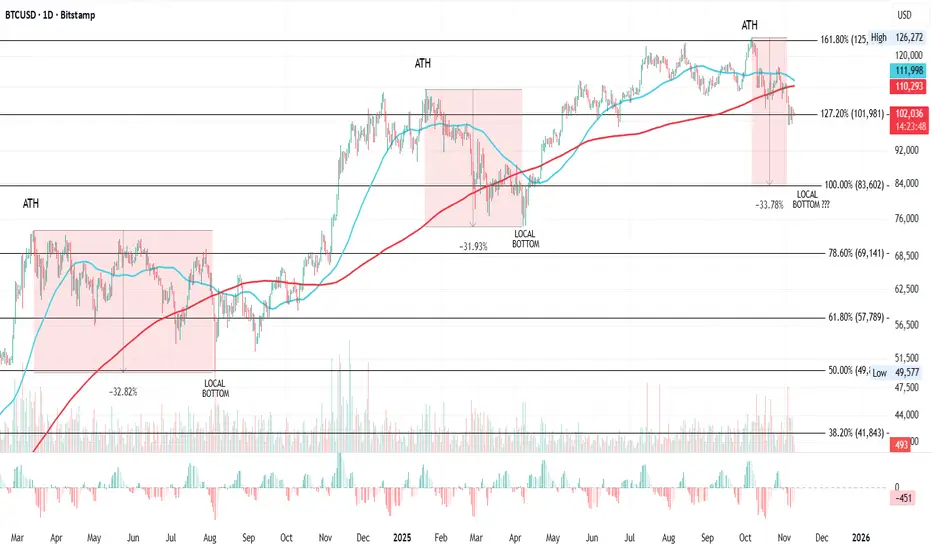
Overall Outlook: I'm tracking a recurring pattern in Bitcoin's price action following each all-time high (ATH), involving sharp drops, interactions with the 50-day and 200-day moving averages (MAs), and key Fibonacci levels. This has played out twice before in this cycle, and we're now in the midst of what could be the third iteration. The setup suggests a potential further drop of around 33.78% from the latest ATH, targeting the 100% Fib level for a local bottom, possibly timed near a death cross. If this holds true, it could signal a strong buying opportunity at the bottom, as price has historically reversed and rallied hard afterward. For now, the theory looks promising, but I'll update this idea as events unfold.
Key Pattern and Historical Observations: This analysis focuses on a consistent post-ATH correction structure that's emerged in Bitcoin's daily chart over the past couple of years. It typically involves: A new ATH breaking above a key Fib extension level.
A subsequent drop of 31-33%, crossing under the 50MA and 200MA.
Bottoming near a lower Fib level (often 2 levels below the ATH breakout point), with timing influenced by the death cross (50MA crossing under 200MA).
Post-bottom recovery: Choppy ups and downs, reclaiming MAs and Fib levels, leading to the next leg up.
Let's break it down by each ATH in the series: First ATH (March 2024): Peaked at $73,794, right above the 78.60% Fib level. This was followed by a 32.82% drop to a local bottom at $49,577. Price action dropped 2 Fib levels to land at the 50% Fib, after crossing under both the 50MA and 200MA. Notably, the local bottom formed just days before the death cross occurred, suggesting the cross could help time reversals. From there, recovery wasn't immediate, price pushed up, hit resistance at the 200MA, dropped, rallied again, and repeated this process. Eventually, it found support at the 50MA and pushed over the 200MA. This consolidation phase lasted from March to August 2024 before the uptrend resumed.
Second ATH (January 2025): Hit $109,356, breaking above the 127.20% Fib level. Similar to the first, it dropped 31.93% to a local bottom at $74,434 and again, 2 Fib levels lower, landing close to the 78.60% Fib (which was key in the prior ATH). This time, the bottom came shortly after the death cross, flipping the timing slightly from the previous instance (after vs. before). Post-bottom, price reclaimed the next Fib level and the 50MA, then crossed the 200MA and held strong without looking back, all the way until October 2025.
Third ATH (Early October 2025): Reached $126,272, just above the 161.80% Fib level. Following the pattern, but accelerating faster this time, price has already dropped under the 200MA and found at least temporary support at the 127.20% Fib level.
Current Setup and Open Questions: Based on the prior two ATHs, this third one raises two key questions that could define the next move: Will price drop to the next lower Fib level? That would mean targeting the 100% Fib, implying a total drop of around 33.78% from the $126,272 ATH (putting the local bottom somewhere near $83,600, give or take based on exact Fib anchoring).
Will a death cross mark the bottom? In the first case, the bottom was days before the cross; in the second, shortly after. Watching for an impending death cross could help time the reversal in real time.
If the pattern repeats, we're likely in the early stages of the correction, with more downside before the bottom forms. This setup has a good chance to play out given the historical parallels, offering a prime spot to buy the dip once the local bottom confirms. I'll keep this idea updated as price action develops, especially monitoring Fib interactions, MA crosses, and any signs of reversal. Potential Trade Considerations: Watch Zones: Resistance: 161.80% Fib ($126,272, prior ATH) and 200MA for any failed retests.
Support Targets: 127.20% Fib (current temp support), then 100% Fib for the potential local bottom (~33.78% drop zone).
Entry Idea: No aggressive positions yet, wait for signs of bottoming near the 100% Fib or around a death cross. If confirmed, long entry on reversal signals (e.g., bullish candle above 50MA).
Risk Management: Set stops below key Fib supports. Target post-recovery upside to prior ATH or higher Fib extensions.
Invalidation: A quick reclaim of the 200MA without further drop could break the pattern, shifting to bullish continuation.
External Factors:
While the technicals are strong, BTC in late 2025 is heavily influenced by US macros, which could amplify or disrupt this post-ATH drop pattern.
For instance: Ongoing Government Shutdown: The US federal government has been shut down since October 1, 2025, making this the longest shutdown in history (now at 39+ days as of Nov 9). It's causing widespread disruptions, including halted SNAP benefits for millions, delays in airport operations due to air traffic controller shortages, increased reliance on food pantries by military families, and broader economic strain like reduced tourism and spending ahead of Thanksgiving. Negotiations are stalled, with Senate Republicans pushing for votes to reopen but Democrats holding out for extensions on ACA tax credits. This uncertainty could weigh on risk assets like BTC, potentially accelerating the expected 33.78% drop if it drags on and hurts consumer confidence or triggers a recessionary vibe. On the flip side, a quick resolution might spark a relief rally, shortening the correction phase.
Fed's Stance on Rate Cuts: There's no FOMC meeting in November, so no rate cut then. For December, Fed Chair Powell emphasized after the October 29 quarter-point cut (bringing the fed funds rate to 3.75%-4%) that another reduction is "not a foregone conclusion" and depends on incoming data. Internal divisions are evident: some officials like Beth Hammack and Lorie Logan question further easing, citing a resilient economy and risks of reigniting inflation.
The shutdown is complicating this by blocking key data releases (e.g., jobs reports), which Powell likened to "driving in the fog." If no cut happens in December, it could pressure BTC lower in the short term by signalling tighter policy, aligning with a deeper Fib target. But if data softens dramatically (e.g., due to shutdown effects), a surprise cut might catalyze the bottom and reversal.
Ending QT and Potential QE Shift: The Fed announced it will end quantitative tightening (QT) on December 1, halting the balance sheet runoff and instead rolling over maturing Treasuries to hold holdings steady at around $6.6 trillion. This addresses tightening money markets and funding strains, but it's not yet quantitative easing (QE), it's more of a pause to maintain ample reserves rather than active expansion. Some analysts speculate this could pave the way for QE resumption if economic conditions worsen (e.g., prolonged shutdown or labour market cooling), potentially starting in December or early 2026. For BTC, ending QT removes a liquidity drain, which is bullish long-term and could support post-bottom rally. If QE kicks in sooner, it might act as rocket fuel, shortening the correction and pushing toward new ATHs faster, but watch for inflation risks that could prompt hawkish pushback.
If you like this idea, feel free to leave a comment, boost, or share your thoughts.
Remember, this is not financial advice; trade responsibly!
Always take profits and manage risk!
Interaction is welcome in the comments!
BTCUSD Rebounds From Buyer Zone — Correction Toward $101KHello traders! Let’s take a look at BTCUSD (Bitcoin). After an extended bearish phase inside a broad descending channel, price consistently respected both the resistance and support lines, forming a clear series of lower highs. Each touch of the descending resistance line resulted in a Turned Around reaction, confirming strong seller control throughout the structure. Earlier, Bitcoin broke below its local support area, initiating a deeper correction toward the major Support Level near $96,000. This zone aligns with the lower boundary of the descending channel and historically served as a strong reaction area for buyers. Recently, BTCUSD reached the bottom of the structure and is now showing early signs of a potential pullback. Price is attempting to rebound from the Buyer Zone, aiming toward the nearest resistance cluster around $100,800–$101,600, which also forms the lower boundary of the Seller Zone. This level previously acted as support and is now expected to serve as a strong retest area. As long as price remains below the descending resistance line, the overall trend stays bearish. A short-term bullish correction toward TP1: $101,600 remains possible, especially if buyers maintain control above the $96,000 support. However, if BTC fails to break above the Seller Zone, sellers may step in again, potentially pushing the price back toward the major support and even extending the downtrend. A confirmed breakout above the descending resistance would invalidate the bearish scenario and open the door for a stronger recovery. Please share this idea with your friends and click Boost 🚀

BTC 95K is DONE. WATCHING FOR 100K BounceMorning folks,
So, our plan worked perfect, BTC collapsed as we suggested. Now price is at oversold as on daily as on weekly TF and at support. So, it is reasonable to expect a tactical bounce, somewhere back to 100K. And it could start from a kind of reverse H&S on 1H Chart .
If it starts at all...
But it is not interesting... today we probably can't escape some fundamental analysis. I don't believe in occasional coincidence of stock market collapse right at the eve of Thanksgiving and Xmas and appearing of Epstein compromat on D. Trump. Meantime Donny is loosing all his allies - Musk, Carlson, Now M. Taylor Greene.
I wouldn't worry too much, if I would not see a big bearish signs on BTC, suggesting drop to 80K and even 50K in perspective. As you understand, this could happen only in a case of total collapse on stock market.
Buckle up and be prepared. No longs by far. Wait for mentioned pullback to consider a new shorts.
Take care, S.
