BITCOIN – LEVELS TO WATCHTraders,
We dumped. Now we are in a controlled recovery. The question is not only “are we going up” but “where will the market make its real decision.” Right now the chart is giving us two very clean checkpoints.
1. What happened
We lost the weekly open and sold off.
Spot was selling too, so the dump was real.
After the low, spot started buying again and price reclaimed above the big wick. That looks like a failed attempt lower.
Markets left a really weak low behind at ~99k. I am convinced we will sweep this low somewhere in the coming weeks.
Funding is negative while price is moving up. Shorts are still in the market. This is how squeezes start.
2. First decision zone: 107.300 to 108.000
This area is important because several things come together.
107.300 is a weak high. It stopped at a clean level without strong rejection. That often means liquidity is still sitting above it.
The AVWAP anchored from 7 April is there. Price is below it for the first time since that move. When price comes back into an AVWAP from below the market often reacts because old buyers meet new sellers.
We also have an LVN just below. That tells us the market did not trade much there before. Price likes to test that kind of gap.
So 107k to 108k is our first place to watch the data. If spot keeps pushing and perps do not start selling we can break it. If CVD stalls there it can be a take profit zone.
3. Accumulation and Distribution
On both the 1 hour and 4 hour spot charts the Accumulation/Distribution line tells an important story.
Price made a clear new low after the dump.
The A/D line did not make a new low. It actually started to turn up.
That is what traders call a bullish divergence. Price is still falling but the money flow is already improving.
In simple words. While candles were going down someone was quietly buying.
That means the bounce we see now is not just short covering or a random spike. It was prepared by real spot demand.
Futures can show a similar thing but spot is the cleaner signal because it is not influenced by funding, leverage or hedges.
When real buyers step in while shorts are still in the market it often creates the right conditions for a squeeze.
4. OBV check
On the 4h OBV you can see it popping up from the base after the dump. OBV going up while price is moving up means volume is supporting the move. This agrees with the spot A/D story. It is better when price and OBV move together than when price moves alone.
5. Scenario 1
Price pushes into 107k to 108k.
That sweep takes the weak high and tags the AVWAP.
If at that point spot CVD slows down or perps start to sell we can reject.
A rejection there can send price back into the mid zone and even lower towards 101k to 102k and in extension back to the HTF LVN near 98k.
This is the simple “first resistance holds” idea.
6. Scenario 2
This is the one I am leaning toward.
Price breaks and holds above 108k.
Shorts do not get their reaction.
Spot keeps supporting and funding stays negative to flat.
Then the market has room to go for the next real liquidity pool which is 117k to 118k.
7. Why 117k to 118k matters
On the liquidity heatmap there is clear resting liquidity higher up. Price often travels to those areas because that is where orders are.
The golden pocket of the previous move sits in this same zone. Many traders watch this fib area so reactions there are common.
Several AVWAP bands from earlier dates are meeting around 117k to 118k. When AVWAPs from different anchors cluster together it creates a stronger level because different groups of traders all care about that price.
Between the current price and that zone there are imbalances and LVNs. That means the market moved quickly there before and did not build volume. These thin areas often get filled on the next push.
8. How to read it in real time
Above 108k and spot CVD still rising means squeeze is on.
Above 108k and funding still negative means shorts are paying to stay wrong.
Lose 108k again after a sweep and see CVD roll over means scenario 1 is playing.
Price can just dump down without getting more liquidity. But looking unlikely based on the data right now.
So if Bitcoin can break and hold above 108k there is not much in the way until 117k to 118k.
Final view
We dumped on real flow.
We are recovering with spot support.
We have a clear first test at 107k to 108k.
Break and hold and the magnet becomes 117k to 118k because of liquidity, golden pocket, AVWAP confluence and imbalance.
TLDR;
Bitcoin sold off hard, but the data says the low was bought. Spot A/D started rising while price was still making new lows, funding turned negative and price reclaimed above the wick, which tells us real buyers stepped in while shorts stayed in their positions. Now price is climbing back toward 107k to 108k where a weak high and the April AVWAP are waiting, so that is the first place the market can decide if this recovery is just a bounce or the start of a squeeze. If buyers keep showing up there and we push through, the path above is thin and the next real pocket of liquidity, AVWAP confluence, imbalance and even the golden pocket of the earlier move all sit together around 117k to 118k. That is why this recovery matters. It is not just candles going up. It is positioning, spot flow and liquidity all lining up.
If you enjoy this type of analysis or find it helpful, leave a like or drop a comment. I don’t ask for anything in return — I share this to help traders understand what’s really happening behind the charts. It also helps me see if people actually read and value these breakdowns, so if it helped you, let me know below.
Bitcoin (Cryptocurrency)

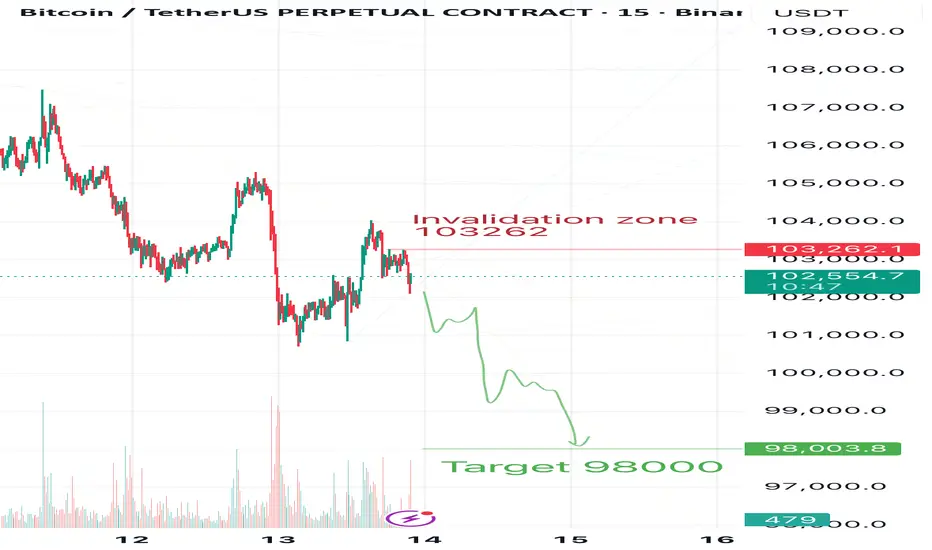
Bitcoin Daily — From 103 to 98k, MaybeI’m no longer waiting for Bitcoin to reach 100K, as I mentioned yesterday.
Now my target is 98K — and in my opinion, all the signs for this move are already in place.
In my previous posts, you can find my global target for Bitcoin at 83K, but that’s not the focus today.
❌The invalidation zone is marked on the chart — 103,262.
🎯Target: 98,000.
⚠️This is not a signal, just my personal view of the market.
Trade based on your own system and always use stop losses.
💬Share your thoughts in the comments, react if you agree, and follow me so you don’t miss my daily Bitcoin updates
$BTC bounce. What is happening?On the Macro Side:
Metaplanet was on the verge of bankruptcy — their stock dropped from $1,900 to $415 in just five months.
Their average Bitcoin buy price sits around $104K, and they had to take on more loans to buy even more BTC, in an attempt to lift the price and save their position.
Michael Saylor and NASDAQ:MSTR are in a similar situation. MicroStrategy’s stock has fallen from $460 to $236, with an average Bitcoin purchase price around $66K.
This puts huge pressure on these institutional treasuries — they cannot afford a bear market.
They’re forced to keep buying Bitcoin to prevent a BTC dominance collapse ( CRYPTOCAP:BTC.D ) and hold market confidence.
In the last two days, altcoins ( CRYPTOCAP:OTHERS ) have been outperforming Bitcoin, signaling a possible rotation from BTC to alts.
That alone was enough for these mega whales to ignite a quick pump before the weekend, trapping retail traders and preventing massive ETF sell pressure from retail-driven redemptions.
On the Chart:
Bitcoin is oversold on both RSI and MACD across multiple timeframes.
This aligns perfectly with the whales’ attempts to spark a rebound — and may support a short-term bounce lasting 5–7 days.
However, don’t be fooled — this looks more like a desperate defense pump than a true trend reversal.
The weekly trend remains bearish until at least Q2 2026, and we’ll likely see more bounces and dips along the way.
A new all-time high seems unlikely in this macro environment, with a maximum target around 108K before another correction.
Stay cautious. Don’t FOMO into this move — it’s engineered to protect treasury positions, not to start a new bull run.
Things will truly turn bullish only when Powell is replaced, QE restarts, or a major macro catalyst (like a government resolution) happens.
DYOR. Stay smart. Don’t chase hype.
#Bitcoin #CryptoMarket #BTC #Altcoins #CryptoNews #CryptoAnalysis #Macro #Whales #MarketUpdate #BTCUSD #AltcoinSeason #Investing #Trading #CryptoTrends #MSTR #Metaplanet #CryptoCrash #CryptoStrategy #DYOR

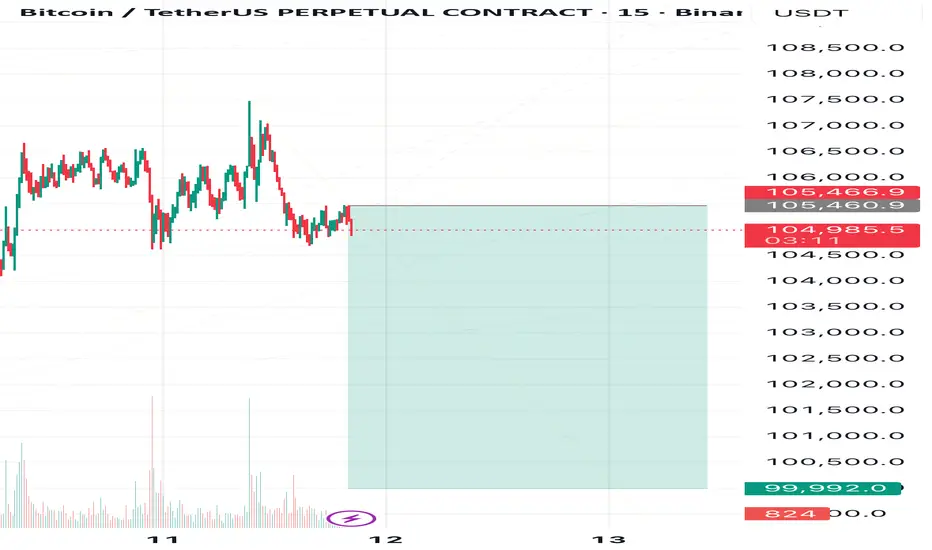
Bitcoin’s Slide to the 100K SideI expect Bitcoin to decline toward 99,999🎯
❌Invalidation Zone: above 105,565.
⚠️This is not a signal — make your own decisions and always trade with stop-losses!)
What’s your view on this setup?
💭Share your thoughts in the comments and follow to stay tuned for what’s next!
BTC Daily Scene — Still Not GreenAs you know from my previous publication, I’m still expecting Bitcoin to reach 100,000 and below.
The invalidation zone of my previous bearish scenario was 105,465 .
At the moment, Bitcoin tried to approach that zone but failed to even touch it , which only confirms its intention to keep heading down toward my target area — 100,000 and lower .
My global downside target is 83,000 , but for now, I only expect 100,000, since I don’t believe Bitcoin will drop straight to 83K in one go.
⸻
⚠️ Disclaimer:
This is not a trading signal, just my personal analysis.
Always trade according to your own system and use stop losses.
⸻
💬 Follow me so you don’t miss my daily Bitcoin analysis — the story continues!

TradeCityPro | Bitcoin Daily Analysis #219👋 Welcome to TradeCityPro!
Let’s dive into the Bitcoin analysis. A bearish structure has formed in the market, so let’s review today’s key triggers together.
⏳ 1-Hour Timeframe
Yesterday, Bitcoin made another bearish leg after being rejected from the 10,5043 level, dropping all the way down to 10,1302.
🔔 The corrections during this downtrend that started from 10,6644 have been quite deep, and yesterday, after reaching the 10,1302 zone, the price made a short-term correction up to 10,3855.
✔️ Today, after reaching that level again, Bitcoin has started forming red candles and is now moving back toward the 10,1302 support.
💡 If the 10,1302 level breaks, we can open a short position.The main confirmation of a continued bearish trend will come with the break of 10,0308.
📊 For a long position, the first trigger is at 10,3855, and the main long trigger is at 10,5043.The main confirmation of a bullish reversal will come with a break above 10,6644.
❌ Disclaimer ❌
Trading futures is highly risky and dangerous. If you're not an expert, these triggers may not be suitable for you. You should first learn risk and capital management. You can also use the educational content from this channel.
Finally, these triggers reflect my personal opinions on price action, and the market may move completely against this analysis. So, do your own research before opening any position.

BTCUSDT.P - November 13, 2025BTCUSDT is currently in a short-term downtrend on the 30-minute chart, trading around $102,450. Price action is consolidating below a descending trendline, with key resistance at $104,825–$105,090 and strong support near $99,896. The structure suggests potential accumulation around the $100K level, with a possible revisit below recent lows before a rebound. A breakout above $103.5K–$104K would likely confirm bullish momentum toward $105K, while a drop below $99,896 could signal further downside. Overall, the short-term outlook is neutral to slightly bullish, contingent on holding support.

Fractal Range Analysis (FRA) for Bitcoin (11/13/25)Fractal Range Analysis for BTC (11/13/25): At ICE (AVWAP) & under microtrend support. Look for short consolidation in this area as buyers attempt to hold the ICE (102.8). If not, we are falling back to 99K for SCLX mitigation. See video for details.

In 2026 Bitcoin should trade to the $60k-$80k RegionOn October 23rd, I published an update on Bitcoin titled “Is Bitcoin About to Shed Its 6-Figure Price Tag?” … and that post certainly struck a nerve.
A number of Bitcoin defenders were quick to tell me I was wrong. As it turned out, those same voices had to face the public reality that their conviction was misplaced, and my analysis proved correct in the short term.
To be clear, I remain agnostic when it comes to Bitcoin’s investment merits. My focus is purely on the wave structure, counting 5’s and 3’s nothing more. I cover most tier-1 cryptocurrencies, and while I remain bullish on Bitcoin over the long term, I continue to expect further downside in the intermediate term once a minor B-wave retracement higher completes.
Ultimately, my analysis continues to suggest a bottoming region between $60,000 and $80,000 sometime in 2026, from which Bitcoin can begin a primary-degree rally. Until that region is reached, Bitcoin may be best viewed as a vehicle for shorter-term trades of minor degree, rather than a sustained long-term hold.

BTC Range Grind: Floors to Harvest, 103.5k Cap__________________________________________________________________________________
Market Overview
__________________________________________________________________________________
Bulls defend a mid-range after a corrective leg, with price trapped under 103,500–105,000 supply and resting atop 101,700–100,400 HTF floors. Momentum is mixed intraday but the higher-timeframe trend still leans up.
Momentum: Slightly bearish intraday within an HTF uptrend; range behavior below 103,500–105,000.
Key levels:
- Resistances (HTF): 103,500 (pivot high); 104,800–105,000 (supply shelf); 106,400–106,900 (upper supply).
- Supports (HTF): 101,700 (1D floor); 100,400 (12H floor); 98,400–99,100 (multi‑TF demand cluster).
Volumes: Mostly normal; occasional moderate spikes on 1H/30m around tests of 101,700 and 103,100–103,600.
Multi-timeframe signals: 1D/12H Up; 6H/4H/2H/1H Down. This favors buying confirmed dips into 101,700/100,400 while avoiding chases into 103,500–105,000 unless reclaimed on strength.
Harvest zones: 100,400 (Cluster A) / 98,400–99,100 (Cluster B). These are ideal dip-buy zones for inverse pyramiding with confirmation.
Risk On / Risk Off Indicator context: NEUTRE VENTE (risk-off tilt). It tempers long conviction and asks for confirmation, aligning with the intraday pullback despite the HTF up-bias.
__________________________________________________________________________________
Trading Playbook
__________________________________________________________________________________
The dominant structure is a range inside an HTF uptrend; adopt a buy‑the‑dip stance at HTF floors with strict confirmations and reduced size given a risk-off backdrop.
Global bias: Neutral Buy while above 100,400–101,700; key invalidation = sustained 12H close below 100,400.
Opportunities:
- Buy the dip: Confirmed 2H/4H reversal at 101,700 or 100,400 toward 103,500.
- Breakout buy: Reclaim and hold above 103,500 on 1H/2H opens 104,800–105,000.
- Tactical sell: Clean rejection at 103,500–105,000 if 2H/4H trend remains Down and breadth weak.
Risk zones / invalidations: A 12H close below 100,400 would invalidate the dip-bid and expose the 98,400–99,100 cluster; acceptance below 100k risks a deeper slide.
Macro catalysts (Twitter, Perplexity, news):
- US government reopening vote may unlock risk appetite short term.
- Fed tone: cuts discussed; reserves near “ample” and QT wind‑down—liquidity supportive but lumpy.
- CPI print can flip the tone and break the 103,500/100,400 range.
Harvest Plan (Inverse Pyramid):
- Palier 1 (12.5%): 100,400 (Cluster A) + reversal ≥2H → entry
- Palier 2 (+12.5%): 96,400–94,400 (-4/-6% below Palier 1) → reinforcement
- TP: 50% at +12–18% from PMP → recycle cash
- Runner: hold if break & hold first R HTF (103,500)
- Invalidation: < HTF Pivot Low 100,400 or 96h no momentum
- Hedge (1x): Short first R HTF (103,500) on rejection + bearish trend → neutralize below R
__________________________________________________________________________________
Multi-Timeframe Insights
__________________________________________________________________________________
Across timeframes, HTF structure remains constructive while intraday trends lean lower, creating buy-the-dip opportunities into defined floors.
1D/12H: Uptrend intact; price capped by 103,500–105,000 supply with key demand at 101,700 and 100,400. A daily/12H bullish close off these floors keeps the path open to 103,500 then 104,800–105,000.
6H/4H/2H: Down within range; prefer long confirmations at 101,700/100,400; short bounces only if sell volume expands and 2H/4H momentum stays Down.
1H/30m/15m: Micro down-to-sideways; frequent wicks under 103,100–103,600. Use only as execution layers aligned with HTF signals.
Major confluence: Strong overlap of HTF floors at 100,400–101,700 versus a persistent supply cap at 103,500–105,000; macro risk-off explains the intraday pressure despite HTF Up.
__________________________________________________________________________________
Macro & On-Chain Drivers
__________________________________________________________________________________
Macro liquidity is tentatively supportive, but the current risk regime is cautious; together they favor selective dip-buys rather than break-chasing.
Macro events: A potential US government reopening, dovish-leaning Fed messaging (cuts discussed; reserves near “ample”; QT wind‑down), and CPI as a near-term risk event that can swing risk appetite.
Bitcoin analysis: Price hovering above 100k with signs of seller fatigue; a large short-liquidity pocket is noted above, implying squeeze potential if spot bids return and 103,500 is reclaimed.
On-chain data: Stablecoin mints (USDC/PYUSD) point to improving on-chain dollar liquidity; range bias near ~100k with dense supply 106k–118k supports the current capped-range picture.
Expected impact: While HTF structure supports buying confirmed dips, the risk-off regime argues for patience and confirmation; a reclaim of 103,500 could quickly target 104,800–105,000, with squeeze risk if flows improve.
__________________________________________________________________________________
Key Takeaways
__________________________________________________________________________________
BTC is in a range beneath 103,500–105,000 while HTF demand at 101,700/100,400 continues to attract bids.
- Trend: Neutral within an HTF uptrend; intraday pressure persists under supply.
- Setup: Primary is a confirmed dip-buy at 101,700 or 100,400, with a secondary breakout buy on strong hold above 103,500.
- Macro: Dovish Fed tone and a potential US reopening help, but CPI and a risk-off regime demand discipline.
Stay patient at floors, avoid chasing into supply, and let confirmation do the heavy lifting—just like timing a boss window in a tough raid.

BTCUSDT.P - November 13, 2025BTCUSDT.P has formed a consolidation base above $101,600, indicating accumulation and potential for further upside toward the $103,685 partial profit zone and the $105,297 profit level.
A decisive close above $103,700 would confirm bullish momentum continuation, while failure to hold above $100,700 could expose the pair to renewed selling pressure toward $99,200.
Risk Assessment: Moderate — The price structure suggests potential bullish recovery from oversold levels, but the setup remains vulnerable to downside continuation if support near $100,700–$100,000 fails to hold. Traders should consider moving stops to breakeven once the $103,685 level is reached to manage risk effectively.

BTCUSD Bulls Aim Higher: Buyers Eye Breakout Toward $107,500Hello traders! Let’s take a look at the current BTCUSD structure. After an extended corrective phase within a descending movement, the market found solid support near the $100,000–$100,200 Buyer Zone, which aligns with both the horizontal Support Level and the lower boundary of the broader structure. This zone has repeatedly triggered strong buying reactions in the past, confirming it as a key demand area. Recently, Bitcoin began forming a bullish correction channel, where price has been developing higher highs and higher lows, suggesting early signs of trend recovery. Within this structure, buyers successfully defended the Buyer Zone, followed by a steady rise toward the $107,000–$107,500 Resistance Level — a zone that previously acted as a Seller Zone during prior rejections. At the moment, BTCUSD is consolidating inside this ascending channel, trading slightly below resistance. The market may attempt another push toward TP1 at $107,500, which aligns with the upper resistance line and marks a potential short-term target. If price manages a confirmed breakout above this level, we could see further continuation toward the next resistance around $111,000. However, if the price faces rejection at the current resistance, a temporary pullback toward the Support Line or Buyer Zone ($100,200–$101,000) could occur before the next wave of growth. The structure remains bullish as long as Bitcoin stays above the ascending Support Line. Please share this idea with your friends and click Boost 🚀

#BTC 95-96K 3-DRIVE IS NOT EXCLUDEDMorning folks,
So, as we suggested BTC has shown healthy downside action out from 106K resistance area. Despite good news around shutdown, BTC shows limited reaction. Even more, I would say that 3-Drive pattern on daily chart is not excluded, down to 94-96K area.
This pattern fits well to idea of weekly H&S pattern ... On 4H in a few hours we could get a bearish grabber as well .
So, I wouldn't be too fast on long entry right now and prefer to wait for confirmation. It might be upside breakout of 108K area at least, just to erase all "bearish suspicions" around...
For short entry, if you want - try to catch the grabber or take position as close to 108K local top (and 2nd Drive top) as possible. This is invalidation point for bearish scenario.
Take care.
S.

BITCOIN + BULLISH DIVBitcoin has weekly RSI bullish divergence which with passing 110.5k can push the price to new ATH

GOLD break all time high!GOLD is back on the rise. Lets's see if after news it will continue rising and a potential all time high.

Bitcoin Geometric Ghost of Bitcoin Past and Future. I used my intuition for this hypothetical theory.

Moon Boys don't want you to see this Bitcoin/Gold chart !Hi Guys,
We have a massive head & shoulders on the Bitcoin / Gold chart that almost nobody talks about! With all the major players being openly bullish on Bitcoin and while everyone is waiting for the AI bubble to burst ..Bitcoin will be the first one to react considering how easy it can be sold and how volatile it usually is.
The charts don't lie and all markets are clearly at the top so protect you capital at all cost while you still can.
Let me know what do you guys think about this.

LONG ON BTC/USD (BITCOIN)Bitcoin has given us a retracement to the demand zone it created after it gave a change of character from down to up.
I expect bitcoin to rise to fill imbalance to the upside for about 15k-20k points.

BTC is losing momentum
Price closed at $101,827, below both the 9 EMA ($104,098) and 9 SMA ($103,096).
The setup points to continued weakness:
Momentum Shift: BTC failed to hold above $104K, triggering sell pressure.
Fear in the Market: The Fear & Greed Index is at 26, signaling risk-off sentiment.
Liquidity Drop: Total crypto market cap fell to $3.41T, down over 2% in 24h.
Altcoin Season Score (29): Capital rotation is limited. Dominance is fading without new inflows.
Volume Divergence: Buying volume is declining while volatility remains high.
BTC remains in a broader uptrend, but short-term structure shows lower highs and weaker bounces.
If support at $100K breaks, the next demand zone sits around $96K–$98K.
Patience and capital preservation matter more here than chasing small bounces.

Solana Cup w/ HandleFor some reason everyone is bearish on SOL right now.
Breakpoint coming up.
Falling Wedge for the handle.
I'll see you at $400 bears.

BTCUSDT.P - November 11, 2025BTCUSDT.P is showing potential for a short-term bearish continuation after breaking below the ascending trendline support near $105,300. The pair has lost upward momentum, indicating potential downside movement toward the $103,530 partial profit zone and the $102,039 profit level. A stop level is positioned around $107,473–$107,714, marking the invalidation area for this bearish setup.
Risk Assessment: Moderate — The breakdown from trendline support favors further downside, but a sustained recovery above $105,600–$106,000 could signal a failed breakdown and shift sentiment back toward bullish consolidation.

TradeCityPro | Bitcoin Daily Analysis #218👋 Welcome to TradeCity Pro!
Let’s dive into the Bitcoin analysis. Today, the market has started another upward move.
⏱ 1-Hour Timeframe
Yesterday, after breaking the support zone, Bitcoin made a downward move to the 10,2489 level. Now, it has started another upward movement.
The price is currently facing resistance at the 10,5020 level, and as you can see, it has experienced a strong rejection from this level, which has caused the bullish momentum to fade from the market.
This rejection at the 10,5020 level makes it a very important zone. If this level is broken, it will act as a strong trigger for a long position.
The first trigger for a long position:
The first trigger for a long position is the 10,5020 level. The next main trigger, which is our primary long trigger, is at 10,6644.
For a short position:
If the downward momentum continues, we can open a short position when the 10,2489 level is broken.
However, as long as the price is ranging between 10,2489 and 10,5020, I prefer not to open any new positions.

BTCUSD Long: Breakout From Descending Channel Targets $108KHello traders! Bitcoin is showing a potential continuation of bullish momentum after breaking out of the descending channel, where sellers had previously maintained control over the market structure. During the prolonged downtrend, the price consistently made lower highs and lower lows, until forming a strong Pivot Point near the $100,500–$101,000 Demand Zone — an area that has historically triggered solid bullish reactions.
Currently, after a fake breakout below this demand zone, the price quickly recovered, signaling liquidity sweeps and seller exhaustion. Since then, BTCUSD has rebounded strongly, confirming a structural shift from bearish to bullish control. The pair has now broken above the channel resistance, establishing a short-term bullish bias supported by steady higher lows. At the moment, Bitcoin is approaching the $107,500–$108,000 Supply Zone, which coincides with previous market consolidation and marks a potential reaction area where sellers might temporarily slow down the move. A clean breakout and close above $108,000 would open the door for a further rally toward the $111,000 Supply 2 Zone, reinforcing the medium-term bullish structure.
I expect the $104,500–$105,000 area to act as immediate support and a key retest level, allowing buyers to maintain momentum and target $108,000. Holding above this zone maintains the bullish scenario, while a confirmed break below it could trigger a pullback to the previous demand level before a new rally develops. Manage your risk!
