BITCOIN SIGNAL: SELL EVERYTHING NOW!!!!!!!? (big)Yello Paradisers! Enjoy the video!
And Paradisers! Keep in mind to trade only with a proper professional trading strategy. Wait for confirmations. Play with tactics. This is the only way you can be long-term profitable.
Remember, don’t trade without confirmations. Wait for them before creating a trade. Be disciplined, patient, and emotionally controlled. Only trade the highest probability setups with the greatest risk to reward ratio. This will ensure that you become a long-term profitable professional trader.
Don't be a gambler. Don't try to get rich quick. Make sure that your trading is professionally based on proper strategies and trade tactics.
Bitcoin (Cryptocurrency)

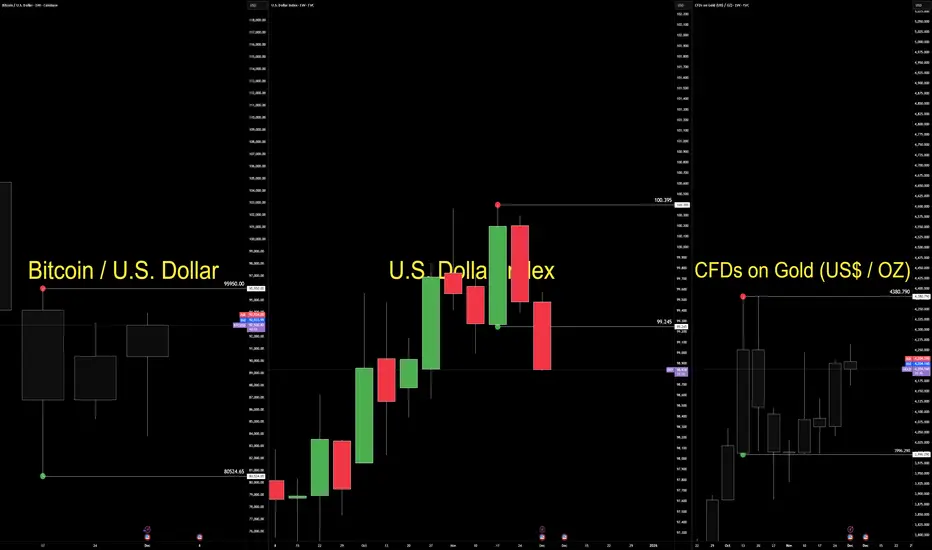
The Dollar Isn’t Falling. It’s Being Repriced.The dollar didn’t weaken because of a single headline.
It weakened because two forces aligned at the same moment—policy certainty and political uncertainty.
Futures now price a full December rate cut.
That removes the dollar’s yield premium and lifts liquidity expectations.
But the bigger shift is political.
Odds have increased that Kevin Hassett could replace Jerome Powell as Fed Chair.
Markets understand the implication: potential pressure on Fed independence.
Currencies respond quickly to credibility risk.
EURUSD strengthened.
Gold firmed.
Bitcoin stabilized despite its bearish structure.
Now the technical side.
The dollar still trades inside a bullish consolidation between 99.245 and 100.395.
Structure is intact, but behaviour has shifted under the surface.
Pressure is building inside the box.
Gold holds a weekly bullish consolidation above 3996.290.
Price is absorbing quietly—typical when investors hedge independence risk.
Bitcoin remains in a weekly bearish consolidation between 95,950 and 80,524.
A rare decoupling from the debasement narrative.
The macro story supports upside, but structure has not yet released.
This environment demands a behaviour-first lens.
Market Structure maps the containment.
Geometry shows the compression.
Volume Flow reveals participation rotation.
Order Flow exposes intent before trend.
Execution depends on pressure validation, not prediction.
Today is not a trend shift.
It is a credibility repricing.
The dollar hasn’t lost structure.
It has lost premium—while gold and crypto absorb the early rotation of capital into assets less dependent on institutional stability.
When policy becomes predictable and leadership becomes political, markets adjust before headlines explain why.
— CORE5DAN
Institutional Logic. Modern Technology. Real Freedom.
BTCUSDT.P - December 4, 2025Bitcoin is in a short‑term uptrend on the 15‑minute chart, respecting a rising trendline from the recent swing low and currently pausing in a shallow pullback after an impulsive advance. Price is trading just above a key support band around 90,500–91,000, with a higher consolidation zone projected near 96,000–97,000 and major resistance and upside target identified in the 113,000 area. A clean bounce from the trendline and a sustained move above 92,000–93,000 would confirm continuation momentum toward the 96,000–97,000 range, while a decisive break below the trendline and 90,500 would invalidate the immediate bullish structure and open room for a deeper retracement toward 88,500–86,500 before any new long setups are considered.

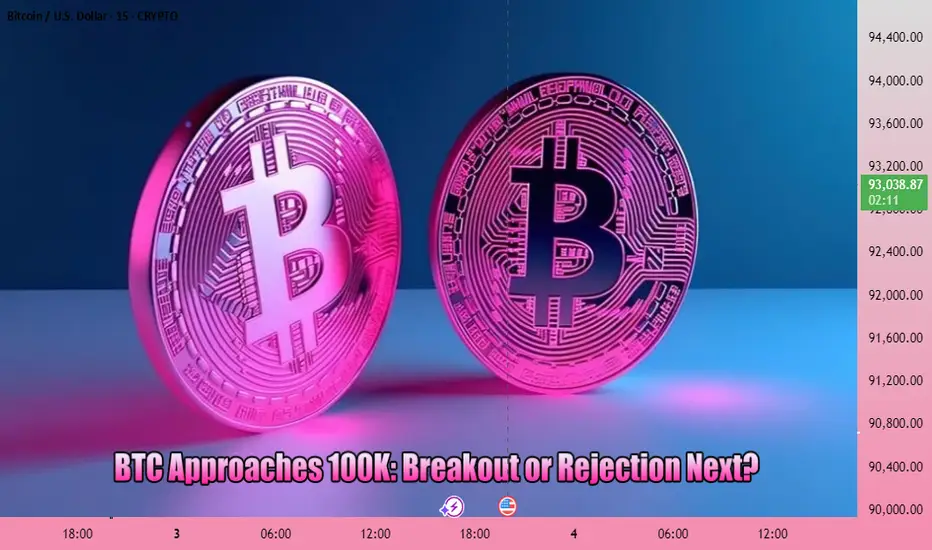
The 100K Magnet: Bitcoin Can’t Resist This Zone!!!🧲🧲Bitcoin is aggressively climbing, and the chart makes one thing very clear, the red zone above is acting like a powerful magnet pulling price toward it.
Here’s why:
1️⃣ 100k Round Number
Major round numbers always attract liquidity. Traders, algorithms, and even long-term investors pay attention to them, making 100,000 a natural magnet for price.
2️⃣ Supply Zone
This area hosted heavy selling in the past, meaning there’s unfilled liquidity sitting there. Markets tend to revisit such zones to rebalance orders.
3️⃣ Major Resistance Zone
Historically, this level acted as a ceiling multiple times. What was once previous resistance often turns into the next major test.
With all three factors stacked together, the entire zone becomes a high-gravity area, and BTC tends to get "pulled" toward such confluences.
🏹As long as BTC maintains its short-term momentum, a retest of this magnet zone becomes the most likely scenario. After that? The reaction will reveal whether the bulls can finally break through, or get rejected again.
Will Bitcoin reclaim the magnet zone this time? 🤔
⚠️ Disclaimer: This is not financial advice. Always do your own research and manage risk properly.
📚 Stick to your trading plan regarding entries, risk, and management.
Good luck! 🍀
All Strategies Are Good; If Managed Properly!
~Richard Nasr

AVAX Trade Setup – Watching the Pullback Opportunity!AVAX has rallied hard overnight, showing strong bullish continuation. After such a sharp move, we’re now expecting a short-term pullback, which could provide a great opportunity for a long spot entry.
🔹 Entry Zone: $12.50 – $13.50
🔹 Take Profit Targets:
• TP1: $18.50 – $21.00
• TP2: $24.00 – $27.00
🔹 Stop Loss: $12.00
If price retraces into the highlighted zone, this could mark a strong risk-reward setup for trend continuation. Keep an eye on momentum and volume confirmation before entry.

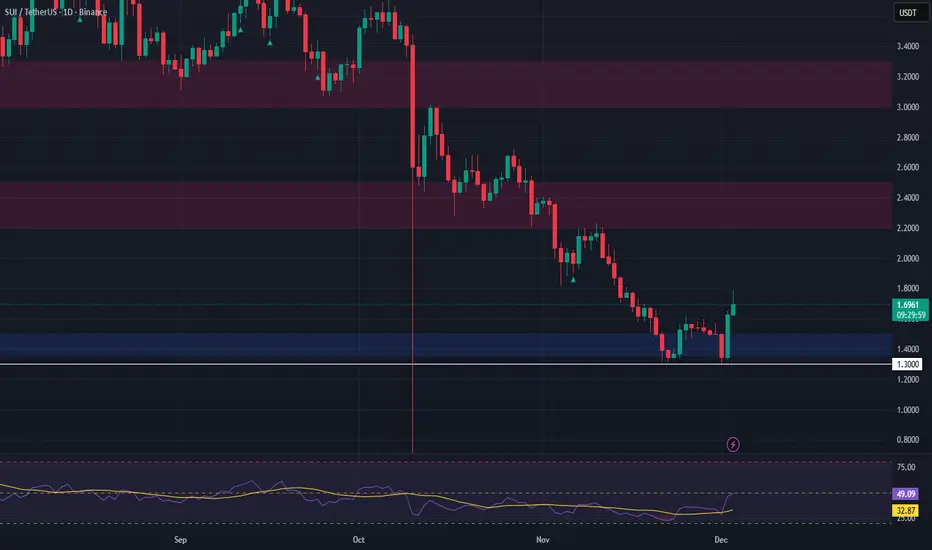
SUI Rally Cooling Off – Long Opportunity on Pullback!SUI has seen a massive rally over the past 24 hours, breaking out with strong bullish momentum. As price begins to cool off, we’re watching for a healthy pullback that could present a great long spot entry opportunity.
📉 Entry Zone: $1.36 – $1.50
🎯 Take Profit Targets:
• TP1: $2.20 – $2.50
• TP2: $3.00 – $3.30
🛑 Stop Loss: $1.30
The recent surge indicates strength, but after such explosive movement, a retest of support is likely before continuation. Patience is key—wait for the dip into the zone and monitor how price reacts. If support holds, this could be a strong mid-term trade setup.
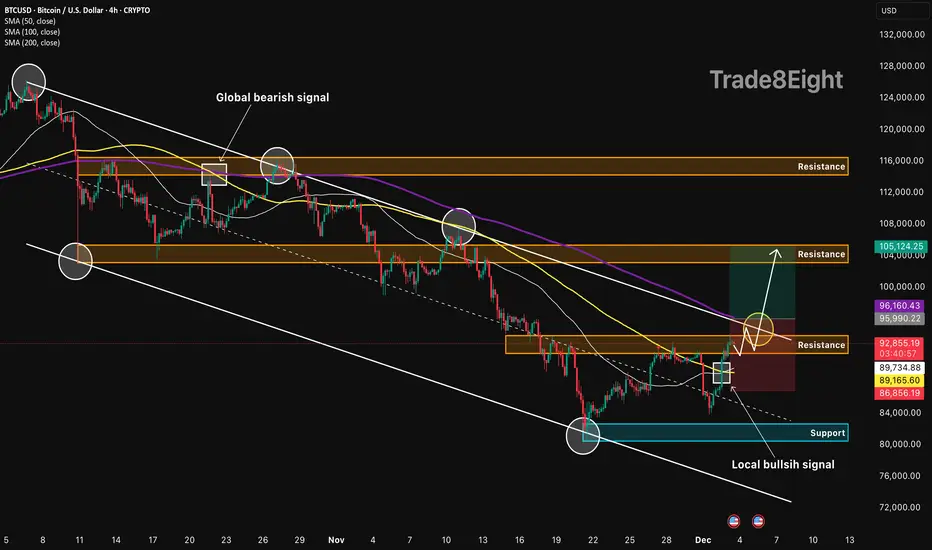
BTCUSD: channel breakout setup🛠 Technical Analysis: On the 4-hour timeframe, Bitcoin (BTCUSD) is trading within a descending channel but has recently printed a "local bullish signal" after bouncing from the 82,000 support zone. The price is currently compressing against the channel's upper trendline and the immediate resistance block at 92,877, with the moving averages (SMA 50, 100) flattening to support a potential reversal. The projected trade setup anticipates a high-momentum breakout above the SMA 200 and the diagonal resistance, targeting the liquidity pool at the 105,000 level.
❗️ Trade Parameters (BUY) ❗️
➡️ Entry Point: Buy on confirmed breakout of resistance (approx. 95,500 – 96,200)
🎯 Take Profit: 104,500 – 105,120
🔴 Stop Loss: Below SMA (approx. 86,850)
⚠️ Disclaimer: This is a potential trade idea based on current analysis; market conditions and price direction are subject to change based on news factors and volatility.
BTC 100K Breakout or Rejection Next? | Follow for more insightsBITSTAMP:BTCUSD is approaching a key support zone near $87,500–$88,000. If price holds and bounces from this zone, the next upside target could be $95,000 — with possible follow‑through toward $100,000+ if bulls regain strength.
On the flip side — a decisive break below $87,500 would raise risk toward $80,000.
Watch for a clean daily close and volume confirmation before entering. Manage risk carefully; avoid chasing a bounce.
BTCUSD Long: Volatility Rising — Retest of 90,000 ExpectedHello, traders! The price auction for BTCUSD has been in a corrective phase, forming a broad descending structure guided by the major Trend Line. This bearish pattern has been defined by a sequence of lower highs and lower lows, with price repeatedly getting rejected from the Supply Zone and consolidating inside the highlighted range. The market has respected both the descending supply line and the rising Demand Line, creating a well-defined compression of price action.
Currently, the auction is at a critical inflection point, with BTC retesting the Demand Line near the 85,600 demand level. After a series of volatile moves inside the range, the price is attempting to stabilize at this structural support while gradually approaching the descending trendline once again. This tightening of volatility between supply and demand suggests that a significant directional move is likely to occur soon.
My scenario for the development of events is a bullish rebound from the Demand Line, followed by a test of the descending supply line. I expect the price to attempt an impulsive breakout toward the major Supply Zone. In my opinion, a successful breakout above this zone may carry BTC toward the 92,300 resistance target marked on the chart. Manage your risk!

XAGUSD: countertrend setup🛠 Technical Analysis: On the 1-hour timeframe, Silver (XAGUSD) is forming a classic "Head and Shoulders" reversal pattern, signaling a potential shift from the recent uptrend to a bearish correction. Price is currently testing the critical neckline support around 56.600; a confirmed breakdown below this level would validate the pattern. The projected trade aims for a decline toward the confluence of the ascending trendline and the 100 SMA near the 54.750 support zone.
🌍 Fundamental Analysis: The metal is facing selling pressure as traders book profits ahead of crucial US economic data due this week, specifically the ISM Services PMI and the Non-Farm Payrolls (NFP). Market sentiment suggests that any signs of resilience in the US labor market could bolster the Dollar and bond yields, thereby weighing on non-interest-bearing assets like Silver. Additionally, year-end portfolio rebalancing in December often triggers volatility and corrective moves in commodities.
❗️ Trade Parameters (SELL) ❗️
➡️ Entry Point: Sell on breakdown of the neckline support (approx. 56.300 – 56.600)
🎯 Take Profit: 54.059
🔴 Stop Loss: Above the right shoulder resistance (approx. 57.903)
⚠️ Disclaimer: This is a potential trade idea based on current analysis; market conditions and price direction are subject to change based on news factors and volatility.

BTCUSD Short-Term Setup: Buyers Defend Support, TP1 at $89,200Hello traders! Here’s my technical outlook on BTC/USD based on the current market structure. After reaching the Seller Zone near $92,000, the price once again faced strong rejection, forming a clear reversal right under the descending Trend Line. This confirms that sellers continue to defend this area and keep Bitcoin within a broader corrective structure. From there, BTC pulled back toward the Buyer Zone around $86,000–$85,500, which has acted as a reliable support multiple times in the recent sessions. The market is now forming a potential short-term recovery after a fake breakout below this zone, highlighting attempts from buyers to regain control. However, as long as the price trades below the Seller Zone and the descending Trend Line, bearish pressure still dominates the chart. The structure suggests that Bitcoin may attempt a move toward TP1 at $89,200, where the market previously consolidated and faced resistance. A clean rejection from the Trend Line could send the price back toward support for another test, while a confirmed breakout above $92,000 would shift short-term sentiment and open the way for stronger bullish continuation. On the other hand, a breakdown below $85,500 could expose BTC to deeper declines toward lower support lines. Please share this idea with your friends and click Boost 🚀

BTCUSDTWe have a big downtrend.
By breakout from support and resistance we will have continued trend to next target.
Breakout 82k ready to 70k.
Breakout 93k ready to 100k and 115k.
CRYPTOCAP:BTC BITSTAMP:BTCUSD BINANCE:BTCUSDT

Bitcoin Comes Back to Life! Buyers Return With Full PowerIf I had to name a “warrior rising from the storm” , it would be BTCUSDT right now. After plunging to the 84k region, Bitcoin has just staged an almost 7% rebound back toward 93k, accompanied by news that big money from Wall Street is flowing back into crypto and overall fear in the market is calming down. The USD is no longer overly strong, and Bitcoin is once again being mentioned as a key gauge of market risk appetite .
Looking at the 12H chart, BTC has broken back above the bottom of the long-term descending channel and is now pushing into the Ichimoku cloud. This rebound isn’t a “spike and die” pattern — it’s a sequence of steady bullish candles with shallow pullbacks , showing that buyers are firmly in control. The scenario is becoming clearer: price may pull back to around 90,500 to gather liquidity and retest the cloud edge, before potentially bouncing toward the higher resistance region around 107,300 — the next equilibrium zone of the trend.
With the supportive news flow (institutional money re-entering, market accepting a new price base after the drop) and a technical structure showing BTC has temporarily escaped the free-fall phase , I remain biased toward buy-the-dip setups . The plan is to wait for short pullbacks for entries rather than trying to sell against a recovering bullish wave that’s clearly being “revived”.

BTC 4H – Complete Technical Analysis & Trade PlanMarket Structure
BTC is still in a macro downtrend, continuously creating Lower Highs (LH) along the descending trendline.
Recent bounce from 87,766 formed a Higher Low (HL), but structure remains bearish until price closes above 93,080.
Key Levels
Resistance / Liquidity Above:
93,080 (Major LH + liquidity cluster)
98,888
107,473
116,380
Support / Liquidity Below:
87,766 (HL)
83,786
80,600
Pattern & Trend
Price is compressing inside a symmetrical triangle, between:
Descending trendline resistance
Ascending demand trendline
This signals a volatility expansion soon.
Indicators
RSI: 65 → bullish momentum but approaching overbought zone.
Previous bullish divergences have played out.
No fresh bearish divergence yet.
Volume
Impulse buying was strong, but volume faded near resistance.
This warns of a potential rejection unless a breakout happens with high volume.
Next Likely Move
BTC likely sees:
A pullback from the 93k resistance
Into the 90k–89.5k region
Then a decisive move based on trendline reaction.
Break above 93,080 = trend shift.
Break below 87,766 = continuation down.
High-Probability Long Setup
Condition: Breakout + retest of 93,080
Entry: 93,200–93,300 on successful retest
SL: 91,300
TP1: 98,888
TP2: 107,473
TP3: 116,380
RR: 2R to 7R
Confluence:
Break in structure, break in trendline, liquidity sweep, volume expansion.
High-Probability Short Setup
Condition: Rejection from descending trendline + 93k zone
Entry: 92,800–93,000
SL: 93,800 (above liquidity)
TP1: 90,000
TP2: 87,766
TP3: 83,786
TP4: 80,600
RR: 1.8R to 7R
Confluence:
Trendline resistance, LH zone, fading volume, liquidity above price.
Summary
BTC still bearish until 93,080 breaks.
Market in compression phase.
Large move coming soon.
Best setups:
Break-and-retest long above 93,080
Rejection short from 93,000

BITCOIN (BTCUSD): Bullish Reversal is Coming?!
On our yesterday's live stream, we discussed Bitcoin.
It looks like the market found a bottom and preparing for a bullish reversal.
To confirm a start of an uptrend, I suggest focus on
92000 - 94100 Order Block zone.
Its breakout and a daily candle close above will confirm a bullish reversal.
A formation of a Higher Low after the last retracement from that leaves
some clues of a weakening bearish momentum.
A breakout will be our final confirmation.
❤️Please, support my work with like, thank you!❤️
I am part of Trade Nation's Influencer program and receive a monthly fee for using their TradingView charts in my analysis.

BTC (bitcoin) Double-Bottom Reversal Testing Key ResistanceHi!
The chart shows Bitcoin forming a clear double-bottom pattern, supported by bullish RSI divergence on the lower panel. This combination often signals exhaustion of downward momentum and a potential trend reversal. The price has rallied strongly from the second bottom and is now pressing directly into the neckline zone, which aligns with a broader descending trendline drawn from previous swing highs.
This overlap creates a high-confluence resistance area. The current reaction here is critical: if price decisively breaks above the neckline and closes above the descending trendline, it would confirm the reversal structure and open the path toward the next major liquidity pocket around the 100k–104k region, marked on your chart as the target. This region matches previous consolidation and supply, making it a realistic upside magnet if breakout momentum is strong.
However, without a confirmed breakout, the neckline remains a potential rejection level, and price could retest the mid-range or even revisit trendline support. Bulls need continuation volume above resistance to flip the zone into support.
Overall, market structure has shifted from aggressive selling to a constructive bottoming phase. The key now is whether bulls can convert this pattern into a sustained trend reversal.

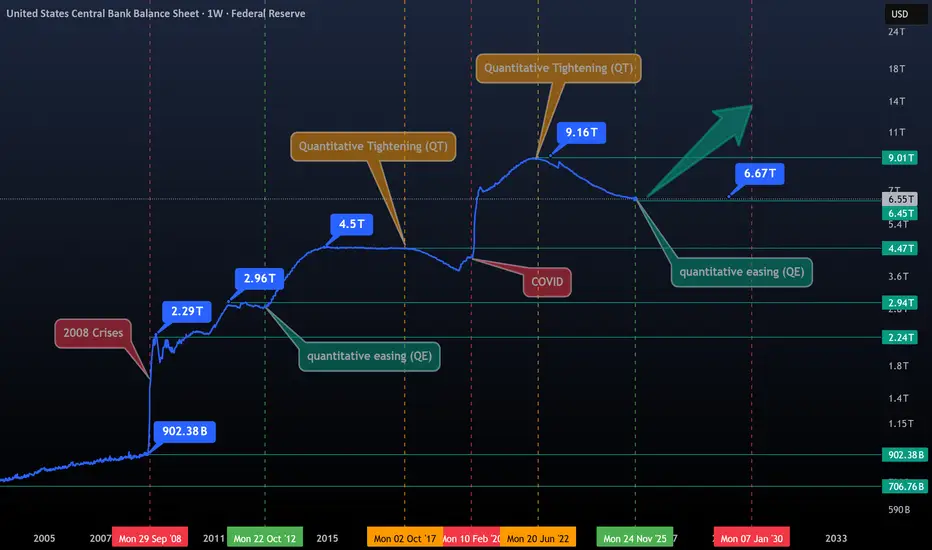
The Era of Gentle Money (QE)- This chart features labels for all key dates, offering a clear and comprehensive overview, including trillions in money creation, QT and QE phases, crises, and flash printing events.
- To truly understand stocks, cryptocurrencies, or precious metals, you first need to understand the monetary system and how it drives inflation.
- The market has been heavily suppressed since June 2022, when the Fed began its Quantitative Tightening (QT), the Fed kicked off a new QE phase on December 1, 2025.
- This is the primary driver behind yesterday’s BTC market surge.
- To complement this, we will soon have a new Fed President, Most likely, they will continue cutting rates, printing more money, and Banks will increase lending, encouraging people to take more risks, which could drive markets higher. Bearish sentiment is premature at this stage.
The heart of truth beats in the printer and in the river of liquidity !
Happy Tr4Ding !
QuickScalp on #EURUSD 📌 Market Insight: {#EURUSD }
⚠️ Risk Assessment: {High}
🚀 Approach:
Need a valid Momentum Structure , a nice one
better to have LTF entry sign first
#Ash_TheTrader #Forex #GBPJPY #MarketAnalysis #TradingSetup #RiskManagement #GOLD #Scalper #NQ #EURUSD

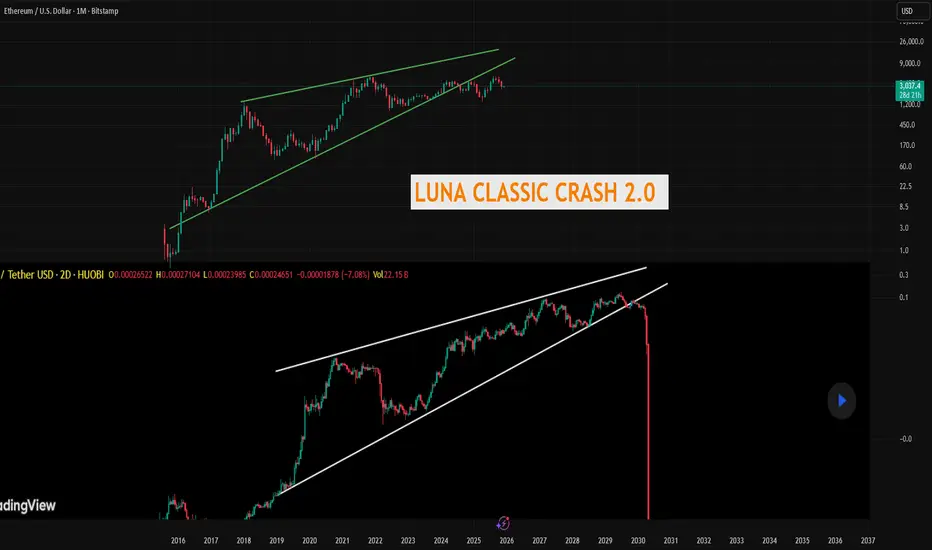
IS ETH ABOUT TO CRASH LIKE LUNA CLASSIC?I pointed this out a couple years ago you can fins my chart in my profile but I think ETH might crash like Luna Classic did. Look at the similarities with the massive rising wedge. ETH is actually outdated, clunky, the fees are stupid high, and its extremely overvalued, in my opinion. I called the Luna Classic crash down to about 50 cents from when it was at its high around 70 dollars, Ill link it below, it went waaay below even my crazy target. People thought I was crazy, go read the comments.
I think the same is on tap for Ethereum. Its already broken below if it cant get back above, I see a waterfall of red candles. What the narrative will be who knows but its coming.
The chart I added of Luna you cant even find it anymore on here this is a screenshot of that chart from my previous ideas.
Not financial advice just my opinion.
BTCUSDT.P - December 3, 2025Bitcoin is attempting to reverse from a prior downtrend, trading above a short-term rising trendline and pushing into a key resistance band around 93,000–94,300. The chart highlights a bullish scenario targeting the 112,000 area if price can clear this resistance and hold above the stop zone near 97,800. A failure to break and sustain above resistance, coupled with a break below the trendline, would favor a corrective move back toward the 87,300 profit level marked on the chart. Momentum is improving but remains vulnerable around resistance, making this a pivotal area for trend confirmation.

$BTCUSD - #Bitcoin cycle analysisHi guys! 👋🏻
🔔I'd like to share with you my current Bitcoin BTCUSD analysis here.
🔔 The last correction is taking an impulse 5-wave structure, it seeems like we are about to complete the 5th wave of the Intermediate A, bounce back to $102K to complete the B and drop back to the levels near $70K - 64K to complete the correction.
🔔 I know it sounds disappointing but we need a correction to regain power. Now, before throwing tomatoes, please see cycle charts below. And never underestimate the power and rules of cycles in the market.
🔔 Why channels always matter
🔔Wave paths
🔔Fibo
🔔 Path to $150K shall look like this
🔔Concetration of Supports and Resistances
Sharing for educational purposes!
✊🏻 Good luck with your trades! ✊🏻
If you like the idea hit the 👍🏻 button, follow me for more ideas.

BITCOIN FREE SIGNAL|SHORT|
✅BTCUSD price is approaching the mitigation block after sweeping liquidity inside the premium zone. If the retest confirms displacement, a drawdown into the target imbalance becomes likely.
—————————
Entry: 92,246$
Stop Loss: 93,200$
Take Profit: 90,000$
Time Frame: 4H
—————————
SHORT🔥
✅Like and subscribe to never miss a new idea!✅

$BTC — WEEK 49 TREND REPORTBTC — WEEK 49 TREND REPORT
Ticker: BITSTAMP:BTCUSD — 12/02/2025 @ 90,800
Timeframe: WEEKLY
This is a reactive structural classification of BTCUSD based on the weekly chart as of this timestamp. Price conditions are evaluated as they stand — nothing here is predictive or forward-assumptive.
⸻
1) Current Trend Condition
• Trend Duration: +9 weeks (bearish)
• Trend Reversal Level (Bullish): 103404.5$
• Trend Reversal Level (Bullish)( Confirmation ): 103405$
• Pullback Support: 100,074$
• Correction Support: 79,507$
⸻
2) Structure Health
• Retracement Phase:
Correction (approaching 61.8%)
• Position Status:
Unstable (price below both structural layers)
⸻
3) Temperature:
• Cooling Phase
⸻
4) Momentum :
• Bearish
⸻
Author’s Note
This analysis is fully reactive, not predictive. Market conditions, trend structure, and behavior are classified as they appear in real time. The objective is to identify where directional shifts first occurred, where structural integrity remains intact, and where it would begin to weaken if key levels were breached.
Predictive analysis projects outcomes that do not exist yet. Without price confirmation, prediction is built on baseless assumptions. This framework avoids that entirely by responding only to verified structural changes and live conditions.
The levels shown simply identify where the current trend structure first shifted and where it would begin to lose integrity if breached. Recognizing these boundaries allows for clearer interpretation of market behavior without relying on forward guarantees, speculative projections, or unsupported assumptions.
⸻
Methodology Overview
This classification framework evaluates directional conditions using internal trend-interpretation logic that references price behavior relative to its structural layers. These relationships are used to identify when price movement aligns with the framework’s criteria for directional phases, transition points, or regime shifts. Visual elements or structural labels reflect these internal interpretations, rather than explicit trading signals or preset indicator crossovers. This framework is observational only and does not imply future outcomes.
