BTC/USD (Bitcoin) LONG SET UPEntry Price 1: $89,500
Entry Price 2: $85,500
Stop Loss: $79,500
Take Profit 1: $94,500(Close 25%)
Take Profit 2: $99,500 (Close 50%)
Take Profit 3: $105,500 (Close 75%)
Take Profit 4: $110,500 (Close 100%)
Status: ACTIVE
Bitcoin (Cryptocurrency)

BITCOIN Will Go Higher From Support! Buy!
Take a look at our analysis for BITCOIN.
Time Frame: 4h
Current Trend: Bullish
Sentiment: Oversold (based on 7-period RSI)
Forecast: Bullish
The market is approaching a key horizontal level 86,080.52.
Considering the today's price action, probabilities will be high to see a movement to 92,932.85.
P.S
Overbought describes a period of time where there has been a significant and consistent upward move in price over a period of time without much pullback.
Like and subscribe and comment my ideas if you enjoy them!

BTC/USDT | The real test ahead! (READ THE CAPTION)Hello everyone, back with another analysis, this time on BTC.
By examining the daily chart of BTC, we can see that bitcoin has been boosted up after hitting the demand zone and is currently being traded in 93K zone. I expect a rise to 97k-98k FVG zone, if BTC manages to go past through this zone, a rise to 104K could be possible. Should it fail to go past 98K, another drop to 81K is likely to happen.

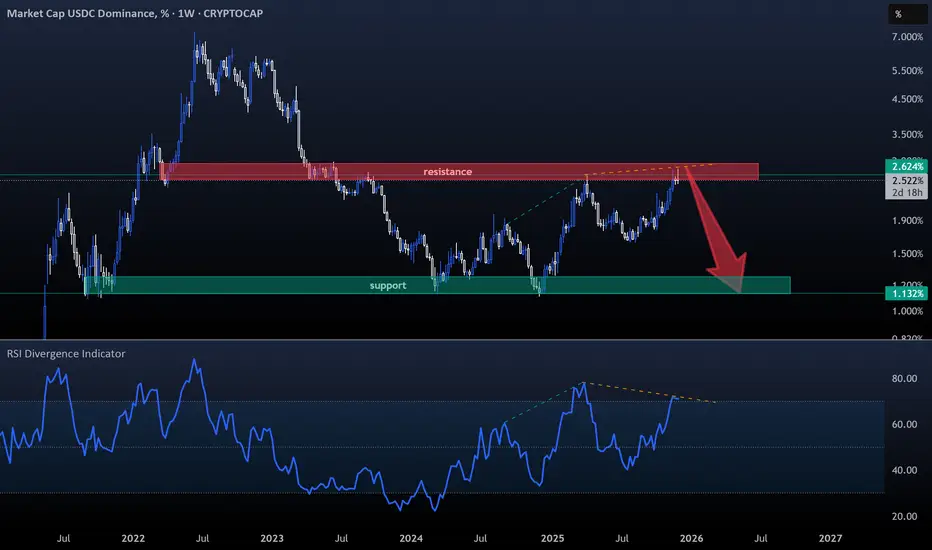
USDC DOM- I haven’t covered Circle’s stablecoin recently. Tether's USDT remains the clear leader at 6% Dom, but with USDC rising back to 2.5% Dom, it’s definitely worth watching again.
- The chart is simple, focus on the Weekly RSI and you’ll see a clear divergence developing on the weekly timeframe.
- So just keep an eye on USDC’s support around 1.1% (green zone) and it's resistance near 2.8% (red zone).
One Simple Rule : Stablecoins down = Bitcoin up.
Happy Tr4Ding !
BTCUSDT.P - December 5, 2025Price is currently in a corrective pullback within a broader intraday up swing after rebounding from the lower support band around 86,600. The key immediate support sits near 91,800–92,000, with a tighter risk level just below 93,400, while the next significant resistance and projected target lies in the 105,000–106,000 region. A sustained higher low above current support with rising short‑term momentum would favor a continuation toward that upper resistance zone, whereas a break below support would open the way for a retest of the recent lows.

Strong ETH Rally Meets FVG Resistance, Pullback Risk AheadETH is extending an impressive upward leg after rebounding strongly from the 2,770–2,820 USD zone, with a sequence of bullish FVGs indicating that proactive buying flow is firmly in control. However, this momentum is now confronting a major challenge as price touches the 3,190–3,220 USD FVG resistance — an area that has repeatedly rejected price in the past and carries the footprint of strong historical sell-side pressure. This is not just any FVG; it corresponds to a region with old sell orders, low traded volume, and long upper wicks — all signs that the market tends to react negatively whenever price enters this zone.
Structurally, ETH remains in an uptrend, but the rally has pushed price into an “overextended” state relative to the Ichimoku cloud — a condition that often triggers a pullback for rebalancing. The sequence of bullish FVGs below, stretching from 2,770 up toward the 3,050 USD area, remains unfilled, and markets typically gravitate toward equilibrium before launching a new leg higher. The appearance of an H4 candle with a long upper wick exactly at the FVG resistance further reinforces the idea that sellers are defending this zone and profit-taking pressure is gradually returning.
Momentum is also slowing down. Volume surged during the advance from 2,770 to 3,050 USD, showing strong real demand behind the breakout. But as price approaches 3,200 USD, volume steadily declines, reflecting fading FOMO and increasing caution among buyers. This combination heightens the probability of a short-term pullback before ETH can attempt another continuation move — especially as price stalls precisely at a significant FVG resistance level.

Big Money Is Pouring Into SOL – Is a Breakout Coming?When large capital starts flowing into Solana , SOLUSDT is no longer just another altcoin — it’s becoming a new safe haven for risk-on liquidity. Forward Industries recently announced that it now holds over 6.9 million SOL , making it one of the largest Solana treasuries in the world — a clear sign that institutional players are not just talking, but actually deploying capital.
On the technical side, the chart shows that SOL has broken away from its bottom structure and is now holding beautifully above the Ichimoku cloud. The area around 138 USDT has emerged as a new support zone: price has retested it multiple times without breaking, turning it into a solid base for accumulation. The current structure of higher lows confirms that buyers are still in control of the trend.
The most bullish scenario: SOLUSDT continues to consolidate above 138, compressing like a spring, before making a push toward the 153 USDT resistance area — exactly as projected on the chart. As long as price stays above 138 and the Ichimoku cloud remains below, the priority remains to buy dips, not to fight the trend.
In short, institutional inflows combined with a strong technical structure suggest that SOLUSDT is in a healthy, sustainable uptrend , and the current pullback looks more like an opportunity to enter, rather than a sign of weakness.

BTC = Bout To Collapse
I'm not trading bitcoin, but I trade the highly correlated stock Microstrategy. This is a pristine setup before the Asian session punishes Bitcoin for that faux breakout we saw into market close.
The downtrend on the daily chart is the dominant trend on BTC right now, and cracked the whip anytime Bitcoin even thought about crossing that downtrend.
BTC hit massive daily resistance.
Asia rarely breaks resistance overnight.
Max pain favors a move DOWN, not up.
Dealers are short gamma into the strike zone you’re playing.
Your deltas (–0.41) will explode to –0.55 to –0.70 on a gap-down.
IV crushed today → will expand tomorrow morning, benefiting you.
MSTR ALWAYS overreacts to BTC.
Strong Open Interest build at 185, 180 and 175 - temporarily OTM ;)
Max pain sits well below current price on MSTR of $186 at $175
Market Makers hedge delta, not max pain
The largest Open Interest of call options sit at $190.
My prediction for Bitcoin and MSTR for 12/5:
BTC opens below 91,400 and MSTR opens below $183
Under $183, Market Makers hedge mildly bearish
Under $181, MM's hedge strongly bearish (accelerating fall similar to what we saw today around 2-2:45pm)
Under $179, Gamma Squeeze in control - move down accelerates
Under $177, MMs forced to short to $175 (current max pain level)
Under $175, Max pain magnet realized. If we hit $175 - expect price to be pinned by MMs.
Options are pricing in a big downward movement for the overnight session pointing at a 65-70% likelihood of a big selloff.

did bitcoin make an inorganic low?good afternoon,
an inorganic low is reffered to as a "truncated 5th" in elliott wave theory. one of the original people who mentioned the term was ralph nelson elliott, when he wrote "the wave principle"
an inoragnic low, by definition is a 5th wave which fails to sweep the wave 3 area. in an uptrend, this can happen due to loss of momentum, but in a downtrend, this could happen due to a major sign of strength.
through out my years in this market, i have personally observed and studied the psychology behind the truncated 5th and how the crowd mentality behaves around it.
often times, there's a sharp reversal and people expect the low to get swept, orders at the lows; but price never returns down there, and their orders don't get filled - which leads to panic buying on the way up, creating extensions in the waves which follow.
---
truncated 5ths in a downtrend are very bullish.
---
i postulate btc sweeps the all time highs, without sweeping the recent 80k low.
---
🎯 = 151k

BTCUSD | Waiting for breakbitcoin got rejected from the red zone a few days ago. Posted that idea a while ago.
Since then it has come back and struggled a bit to break through.
If btc where to break the bottom blue line you see on the chart. I would be confident we are going to see lower prices fast.
Let me know what your analysis and outlook is for bitcoin!
Stay safe out there and do your own due diligence, this is not investment advise!

Bitcoin Pumps +10% — Bull Trap or Trend Reversal?Bitcoin( BINANCE:BTCUSDT ) has experienced over a +10% increase in the past two days, which came as a surprise to many analysts considering the previous bearish momentum. In other words, Bitcoin is on something of a roller coaster lately😂.
The question now is whether Bitcoin has started a new bullish trend or if it’s likely to see another decline.
Let’s dive into the 4-hour chart of Bitcoin. Currently, Bitcoin is approaching a resistance zone($94,850-$93,000), a Cumulative Short Liquidation Leverage($94,710-$94,063), and the monthly pivot point. This cluster of resistances, combined with the recent upward momentum, might make it challenging for Bitcoin to break through.
It’s also worth noting that the trading volume during this recent rally hasn’t been particularly high, so Bitcoin could still surprise us. This recent behavior shows that Bitcoin can move sharply both up and down, so it’s crucial to maintain proper risk management.
From an Elliott Wave perspective, considering Bitcoin’s recent decline, I initially expected that Bitcoin might at least test the low of its main wave 3 again. However, the recent rebound suggests that the main wave 5 may be truncated, and the corrective waves could still push Bitcoin lower, potentially even below $75,000.
From a classical technical analysis perspective, Bitcoin might be forming a bearish flag pattern, with the ascending channel acting as the flag’s pole.
In addition, the USDT.D%( CRYPTOCAP:USDT.D ) is still on an upward trend, which indicates that the cryptocurrency market might still face downward pressure.
Moreover, geopolitical tensions, such as those between the U.S. and Venezuela, could also act as a trigger for further Bitcoin declines if they escalate.
Lastly, the S&P 500 index( SP:SPX ), despite its recent bullish trend, doesn’t show the same positive correlation with Bitcoin. In fact, a decline in the S&P 500 could amplify Bitcoin’s downward movement.
Considering all these factors, I expect Bitcoin to continue its bearish trend and potentially test the heavy support zone. If these support levels break, we could see even more significant declines in the crypto market.
Based on the above explanation, I expect Bitcoin to have at least a correction to the targets I specified on the chart, and then depending on the momentum, we can expect a continuation of the decline or a resurgence.
Note: In general, with the opening of the US markets, financial market movements have become more intense these days than before, and it is better to be prepared for any scenario at that time.
What do you think? Do you believe Bitcoin will dip below $75,000, or will it bounce back?
Cumulative Short Liquidation Leverage: $98,591-$96,688
Cumulative Long Liquidation Leverage: $91,860-$90,960
Stop Loss(SL): $96,200
Points may shift as the market evolves
💡 Please respect each other's opinions and express agreement or disagreement politely.
📌Bitcoin Analysis (BTCUSDT), 4-hour time frame.
🛑 Always set a Stop Loss(SL) for every position you open.
✅ This is just my idea; I’d love to see your thoughts too!
🔥 If you find it helpful, please BOOST this post and share it with your friends.

IBIT in 1H ApexAs you can see here, IBIT is consolidating inside the 100sma and the apex is in play. Likely to see continuation into the 200MAs and into the yellow box, the resistance area.
Possibly 10% in near term.

TradeCityPro | Bitcoin Daily Analysis #240👋 Welcome to TradeCity Pro!
Let’s move on to today’s Bitcoin analysis. The market has started its correction phase today.
⏳ 1-Hour Timeframe
Yesterday, Bitcoin had a very strong bullish momentum and reached the 93,609 level.
✨ Breaking this level could have continued Bitcoin’s upward movement, but the price failed to break through and faked it, starting a correction instead.
💥 The RSI oscillator, as I mentioned before, was showing strong bullish momentum while above the 50 level. However, with the break of this level, the bullish momentum faded, and Bitcoin entered a deeper correction.
📊 During this correction, volume has decreased significantly, and the price has corrected down to 91,974.
The reaction of the price to this level is very important.
⚡️ If the price is supported at 91,974, the likelihood of breaking the resistance increases, and the price could break through this level in future attempts.
💫 However, if the price breaks 91,974 and volume increases, Bitcoin could see deeper corrections, potentially moving to 90,421 or even 88,082.
✔️ For now, I’m only looking for long positions and will open a long position if 93,609 is broken.
⭐ However, I won’t open a short position if 91,974 breaks; I’ll wait for more bearish momentum to enter the market before considering a short.
❌ Disclaimer ❌
Trading futures is highly risky and dangerous. If you're not an expert, these triggers may not be suitable for you. You should first learn risk and capital management. You can also use the educational content from this channel.
Finally, these triggers reflect my personal opinions on price action, and the market may move completely against this analysis. So, do your own research before opening any position.

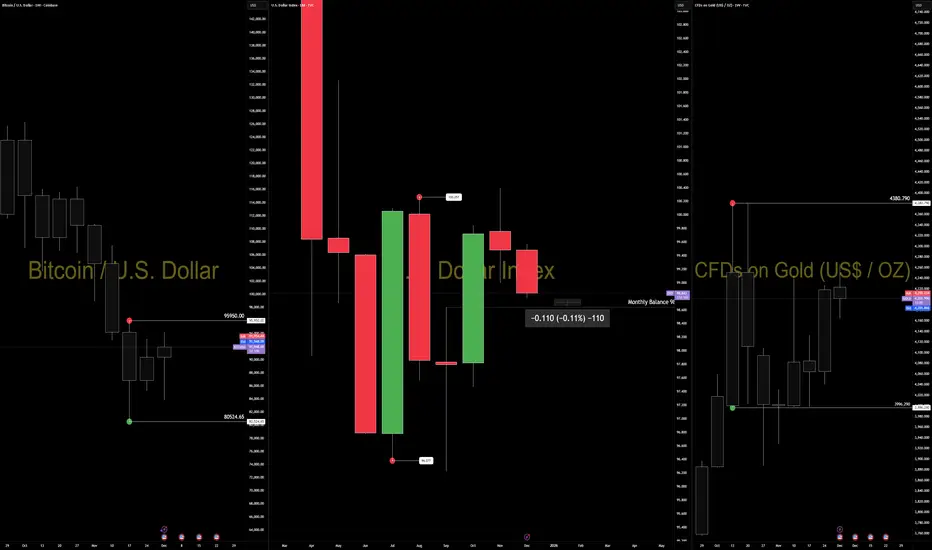
The Dollar Is Compressing Into 98.635 — Macro Pressure Meets StrThe dollar has been under steady macro pressure all week.
Rate cut expectations, softer yields, and liquidity repricing have weakened the USD across the board.
We’ve seen the same conditions lift EURUSD, gold, and BTC — not because those markets react to DXY levels, but because they respond to the same macro drivers.
That is the correct interpretation.
Now the structural question is simple:
DXY is sitting less than 0.11% above monthly balance and pressing into 98.635 — the level algorithms historically defend.
This is the inflection.
If 98.635 holds:
USD stabilizes, stretched rotations cool, and we likely see counterflow in EUR, gold, and BTC.
If 98.635 breaks:
Macro pressure accelerates, and the next leg of dollar weakness opens with far more momentum.
The key distinction:
FA explains the pressure.
TA defines the resolution.
Cross-asset strength today isn’t randomness.
It’s macro conditions expressed differently across instruments while USD approaches the structural point where the next phase becomes obvious.
Watch 98.635.
Structure will answer what fundamentals only set up.
— CORE5DAN
Institutional Logic. Modern Technology. Real Freedom.
$INJ – Extremely Oversold at Key Support | Long Setup PotentialInjective CRYPTOCAP:INJ is trading at an extremely oversold level, sitting directly on major horizontal support that has historically triggered strong bullish reversals. The current zone could offer a high-risk, high-reward opportunity for a long spot position.
🟢 Trade Setup
Entry Zone: $5.50 – $6.00
Targets (TP):
• TP1: $7.00 – $8.00
• TP2: $10.25 – $12.00
• TP3: $14.00 – $16.00
Stop Loss: $5.00

LINKUSDT – Pullback Opportunity Before Next Leg Up?Chainlink (LINK) has rallied strongly but is now testing resistance, where price action could stall short-term. We're watching for a healthy pullback to reload for the next bullish wave.
🔹 Entry Zone: $12.50 – $13.50
🔹 Take Profit Levels:
• TP1: $15.50 – $16.50
• TP2: $19.00 – $21.00
• TP3: $25.00 – $28.00
🔹 Stop Loss: $11.90
Key Idea: A rejection at current resistance could offer a better long entry. If price dips into the $12.50–$13.50 zone and shows strength, it may kick off the next upward move.
📌 Watching for bullish confirmation in that range. Chart structure still favors upside as long as $11.90 holds.

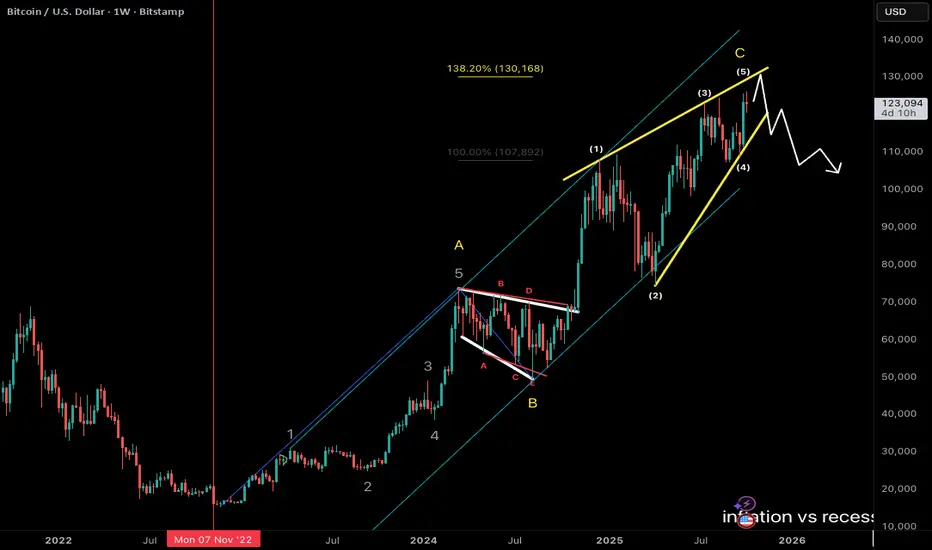
bitcoin ending diagonalbitcoin price going up in a parallel channel
wave A = 12345 and wave C making ending diagonal pattern
C = 138% of A
wave C projection, yellow ending diagonal upper line near 130k
so 130k area is big resistance zone
it has been three years for debasement trade gold and bitcoin are going up
feels like crowd panic on debt
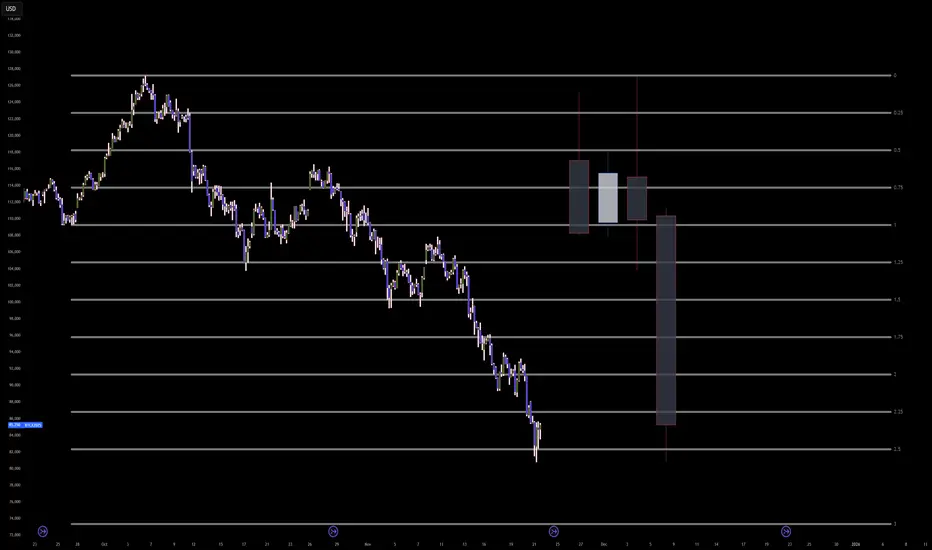
BTC CME Futures: The Capitulation Buy SetupSimply:
The logic here is simple.
Bitcoin has dropped too far and too fast.
We are currently hitting a major mathematical exhaustion point (the 2.5 Standard Deviation line).
At the same time, we are entering that big blue support box between 78k and 82k where the massive rally started earlier this year.
This is not a crash anymore; it is a bear trap.
Retail traders are panic selling right at the bottom, which provides the liquidity for big players to buy.
We are setting a limit order to catch the final wick down before the bounce.
Entry: 81,250 (Buy Limit)
Stop Loss: 77,500 (If it goes below here, the setup is wrong)
Target: 94,000 (The bounce back to equilibrium)
Don't chase the red candles.
Let the price come to you, fill the order, and wait for the squeeze.
____
Advanced:
The algorithm is currently executing a terminal volatility expansion into the 2.5 Standard Deviation extremity to finalize the Macro Sell Model and engineer a generational Smart Money Reversal.
The present liquidation cascade is not a crash but a precise, mathematically ordained delivery of price into the deep discount 'Blue Box' accumulation array to harvest the final sell-side liquidity before the grand repricing event.
Entry: 81,250.00 (Limit Order - 4,000 points below market)
Stop loss: 77,500.00 (3,750 points)
Take profit: 94,000.00 (12,750 points)
Risk to reward ratio: 3.40R
The Opportunity
The Bitcoin algorithm has been running a high-velocity sell program from the 126,000.00 highs, systematically dismantling every bullish PD Array.
However, we have now breached the Event Horizon. The price is magnetically drawn to the confluence of the 2.5 Standard Deviation projection and the historical Accumulation Block (78k-82k) originating from the early 2025 impulse.
This zone represents the 'Algorithmic Floor'—a region of maximum discount where institutional order flow must pivot from distribution to accumulation to close massive short positions and defend the macro bull trend.
The Entry
Do not chase the current candle. The algorithm demands a touch of the 2.5 Standard Deviation level at approximately 80,800.00 - 81,200.00 to complete the fractal expansion.
We place our limit order at 81,250.00 to front-run the absolute mathematical bottom, capitalizing on the 'Capitulation Wick' that will clear the final trailing stops.
This entry is timed for the CME close/open gap or the weekend volatility injection, which often targets these extreme deviation levels to trap late bears before a violent Monday reversal.
The Invalidation
The reversal thesis is ontologically corrupted if price displaces below the 3.0 Standard Deviation level and the bottom of the accumulation block at 74,000.00.
A sustained closure below this level signifies a total failure of the macro structure and a transition into a secular bear market, invalidating the accumulation narrative.
This would shift the probability manifold to the Primary Antithetical Chain, targeting the 60,000.00 liquidity void.
Key Trajectory Waypoints
Target 1: 86,000.00 | Type: Immediate Rebalance (2.25 SD) | Probability: 90% | ETA: 24 Hours
Target 2: 90,500.00 | Type: Internal Bearish Breaker | Probability: 75% | ETA: 3-5 Days
Target 3: 94,000.00 | Type: Equilibrium / FVG Fill | Probability: 60% | ETA: 1-2 Weeks
The Shadow Reality
A 25% probability exists for the antithetical reality: The Abyss Cascade.
In this scenario, the 2.5 SD level fails to provide a reaction, and the algorithm enters a 'Free Fall' discovery mode targeting the 3.0 SD at 74,000.00 immediately.
This reality is confirmed if price slices through 80,000.00 with no wick response.
___
tags: BITSTAMP:BTCUSD COINBASE:BTCUSD INDEX:BTCUSD BINANCE:BTCUSD
BITCOIN Mayer Multiple shows the way to the Bear Cycle bottom.Bitcoin (BTCUSD) remains on a short-term rebound, as mentioned before, a standard counter-trend/ dead cat bounce during Bear Cycles.
Here you see the Mayer Multiple Bands (MMB), an indicator we've used countless times to determine tops, bottoms and general trends of a Cycle. This time we plot this simple yet powerful tool to make an early estimate on the potential bottom of this Bear Cycle.
We will keep this short as there is no reason to overcomplicate things, especially at this stage. BTC is as we said on a small rebound currently after almost testing the 2SD below (blue trend-line) of the MMB. On all previous Bear Cycles show on this chart, every time this happened, the market bounced and consolidated then.
When the 2SD below trend-line broke, the market reached the 3SD below (green trend-line) rather aggressively and quickly. In all instances, that was the Bear Cycle bottom, with the only exception being the 2022 Bear Cycle, which gave one last short-term rebound/ consolidation and bottomed when it broke below the 1W MA300 (red trend-line).
The 1W MA300 has historically had a hidden but key role on BTC Cycles. When tested, always after the initial MMB bottom, it provided a 2nd and final opportunity to enter (buy) the new Bull Cycle at such a low price.
It is possible to see something like that happen again. With its course (1W MA300), assuming the current Bear Cycle also lasts for around 52 weeks (364 days) like the previous two, we estimate it to be a little under $60000 by October 2026. The MMB 3SD below though could be by that time around $40000. It is possible of course that we breach the 1W MA300 (much) earlier thus at a lower price, meaning also potentially hitting the MMB bottom a little higher.
In any case the bottom range seems roughly by $60k - $40k. Since determining the Cycles (hence Tops - exits, Lows - entries) has always been more about timing and less about pricing, this is why we've discussed before that it would be a good idea to start buying (call it DCA if it suits you better) around $60k. As always, however, these are just the facts. The decision is yours.
So at what price do you think this Cycle will bottom? Feel free to let us know in the comments section below!
---
** Please LIKE 👍, FOLLOW ✅, SHARE 🙌 and COMMENT ✍ if you enjoy this idea! Also share your ideas and charts in the comments section below! This is best way to keep it relevant, support us, keep the content here free and allow the idea to reach as many people as possible. **
---
💸💸💸💸💸💸
👇 👇 👇 👇 👇 👇

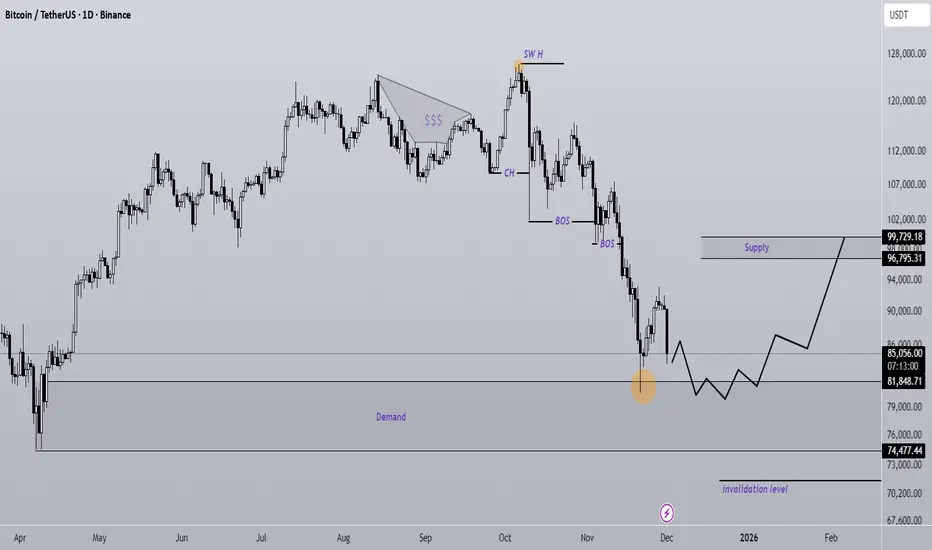
Bitcoin new update (1D)Bitcoin has not yet fully absorbed the buy orders in the marked support zone. This time, upon tapping the support area again, we can expect the price to form a stronger bullish move, at least toward the identified supply zone.
A daily candle closing below the invalidation level will invalidate this outlook.
Do not enter the position without capital management and stop setting
Comment if you have any questions
thank you
Bitcoin Analysis (4H)Bitcoin is in a bearish phase. It appears that Wave C of the bearish phase has transformed into a dimaetric.
The price is expected to bounce back from the green zone toward the upside, and then we may see the main rejection from the red box. The bullish wave we are expecting for Bitcoin corresponds to Wave D.
Let’s see whether a double bottom forms to support the price upward or not.
A daily candle close below the invalidation level will invalidate the bullish Wave D.
For risk management, please don't forget stop loss and capital management
When we reach the first target, save some profit and then change the stop to entry
Comment if you have any questions
Thank You

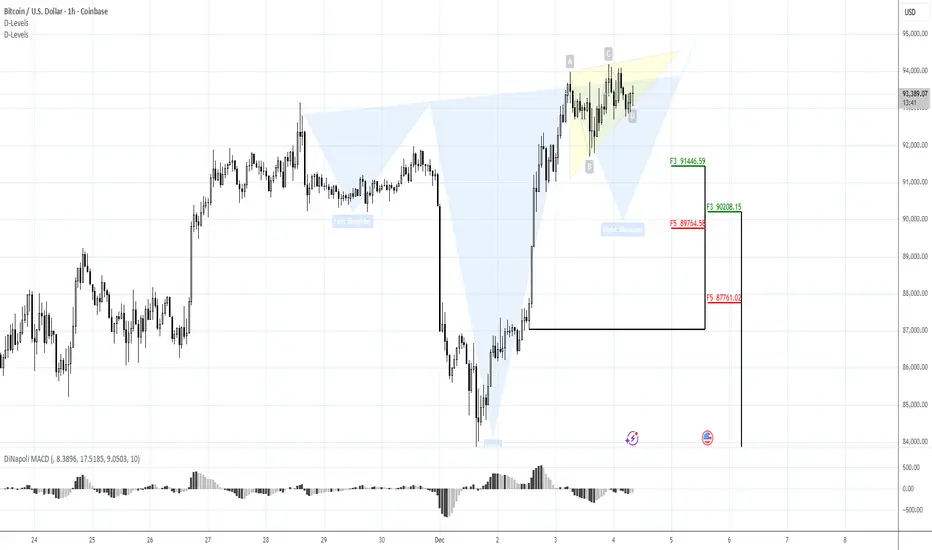
BTC 90K SEEMS INTERESTING FOR ENTRYMorning folks,
So, once our bearish trade was over, market turns to AB=CD upside shape, that we intend to follow. 97K is rather strong resistance, so we consider 96.5K as the nearest upside target. BTC shows nice acceleration, so, it has not bad chances to proceed.
For entry we intend to use reverse H&S shape on 1H chart. 90K area looks interesting now for potential long entry...
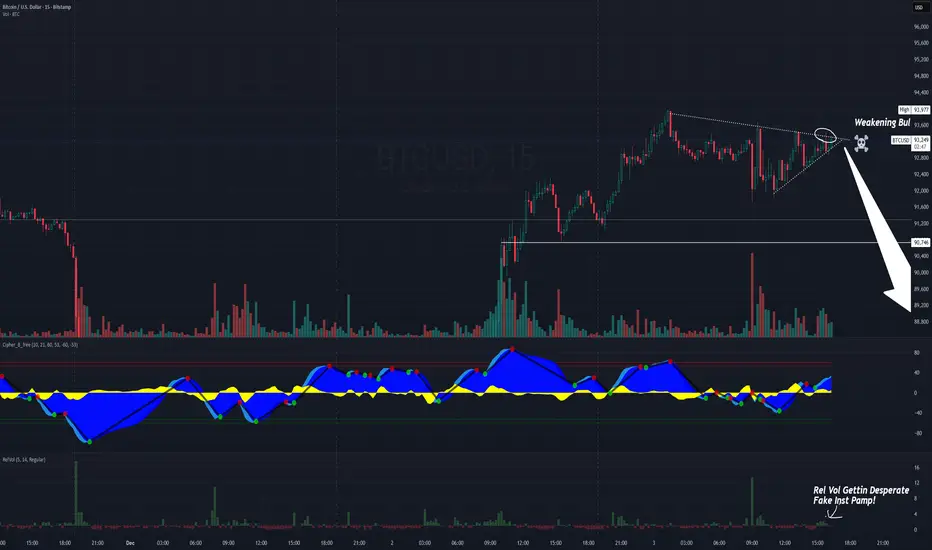
The Bitcoin Meteorite and MSTR falling knifeThe US Trading session just ended and handed Asia a Bitcoin Meteorite. If there's one thing Asia hates - it's fake pumps...and that's all today was on BTC. We'll be lucky if BTC is over $90k when the US market opens tomorrow on 12/4.
Asian session behavior is predictable:
They love to liquidate overleveraged U.S. breakout traders
They fade fake pumps
They push price back toward equilibrium
At the very least we pull back to $92, and while I think $91k is more likely and even $90 isn't out of the question. The other concern is all the benevolent articles coming out about BTC. Larry Fink said bitcoin is the new bellbottoms...or whatever. When they flood the market with bogus 'opinion' pieces, these people only speak because they want to influence retail traders. You really think the CEO of black rock wants to drive the price of BTC UP before they expand their holdings... If they're talking about something...they're selling you a bridge. I think BTC and it's biggest holding company MSTR (which managed to buy only 130 Bitcoins this cycle (BWHAHAHA) is going to crash even harder than it has been. $1.4B in cash reserves to fund $773+ Million in annual dividends while diluting shares is a recipe for bankruptcy and a $.01 share price...
Shorting BTC and MSTR all week long and twice on Sunday.