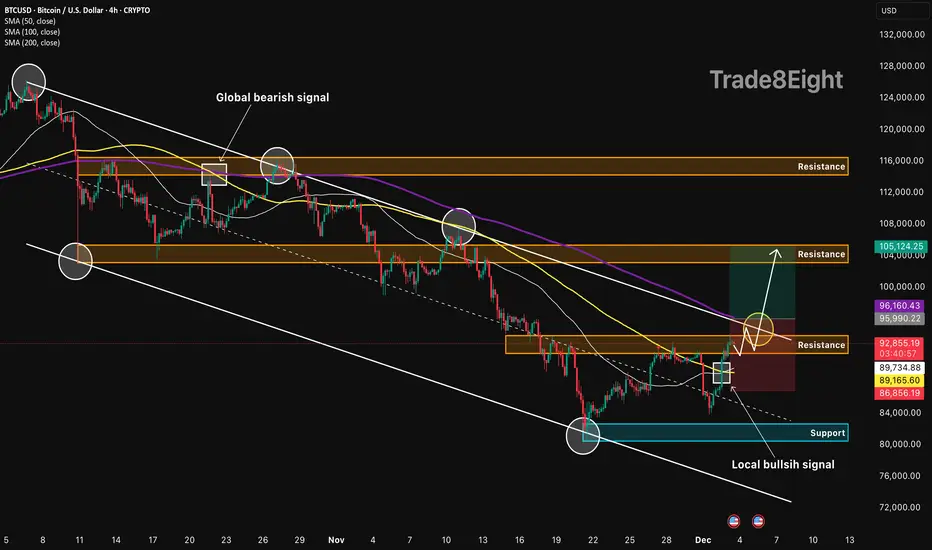
BTCUSD: channel breakout setup🛠 Technical Analysis: On the 4-hour timeframe, Bitcoin (BTCUSD) is trading within a descending channel but has recently printed a "local bullish signal" after bouncing from the 82,000 support zone. The price is currently compressing against the channel's upper trendline and the immediate resistance block at 92,877, with the moving averages (SMA 50, 100) flattening to support a potential reversal. The projected trade setup anticipates a high-momentum breakout above the SMA 200 and the diagonal resistance, targeting the liquidity pool at the 105,000 level.
❗️ Trade Parameters (BUY) ❗️
➡️ Entry Point: Buy on confirmed breakout of resistance (approx. 95,500 – 96,200)
🎯 Take Profit: 104,500 – 105,120
🔴 Stop Loss: Below SMA (approx. 86,850)
⚠️ Disclaimer: This is a potential trade idea based on current analysis; market conditions and price direction are subject to change based on news factors and volatility.
Bitcoin (Cryptocurrency)
BTC 100K Breakout or Rejection Next? | Follow for more insightsBITSTAMP:BTCUSD is approaching a key support zone near $87,500–$88,000. If price holds and bounces from this zone, the next upside target could be $95,000 — with possible follow‑through toward $100,000+ if bulls regain strength.
On the flip side — a decisive break below $87,500 would raise risk toward $80,000.
Watch for a clean daily close and volume confirmation before entering. Manage risk carefully; avoid chasing a bounce.
BTCUSD Long: Volatility Rising — Retest of 90,000 ExpectedHello, traders! The price auction for BTCUSD has been in a corrective phase, forming a broad descending structure guided by the major Trend Line. This bearish pattern has been defined by a sequence of lower highs and lower lows, with price repeatedly getting rejected from the Supply Zone and consolidating inside the highlighted range. The market has respected both the descending supply line and the rising Demand Line, creating a well-defined compression of price action.
Currently, the auction is at a critical inflection point, with BTC retesting the Demand Line near the 85,600 demand level. After a series of volatile moves inside the range, the price is attempting to stabilize at this structural support while gradually approaching the descending trendline once again. This tightening of volatility between supply and demand suggests that a significant directional move is likely to occur soon.
My scenario for the development of events is a bullish rebound from the Demand Line, followed by a test of the descending supply line. I expect the price to attempt an impulsive breakout toward the major Supply Zone. In my opinion, a successful breakout above this zone may carry BTC toward the 92,300 resistance target marked on the chart. Manage your risk!

XAGUSD: countertrend setup🛠 Technical Analysis: On the 1-hour timeframe, Silver (XAGUSD) is forming a classic "Head and Shoulders" reversal pattern, signaling a potential shift from the recent uptrend to a bearish correction. Price is currently testing the critical neckline support around 56.600; a confirmed breakdown below this level would validate the pattern. The projected trade aims for a decline toward the confluence of the ascending trendline and the 100 SMA near the 54.750 support zone.
🌍 Fundamental Analysis: The metal is facing selling pressure as traders book profits ahead of crucial US economic data due this week, specifically the ISM Services PMI and the Non-Farm Payrolls (NFP). Market sentiment suggests that any signs of resilience in the US labor market could bolster the Dollar and bond yields, thereby weighing on non-interest-bearing assets like Silver. Additionally, year-end portfolio rebalancing in December often triggers volatility and corrective moves in commodities.
❗️ Trade Parameters (SELL) ❗️
➡️ Entry Point: Sell on breakdown of the neckline support (approx. 56.300 – 56.600)
🎯 Take Profit: 54.059
🔴 Stop Loss: Above the right shoulder resistance (approx. 57.903)
⚠️ Disclaimer: This is a potential trade idea based on current analysis; market conditions and price direction are subject to change based on news factors and volatility.

BTCUSD Short-Term Setup: Buyers Defend Support, TP1 at $89,200Hello traders! Here’s my technical outlook on BTC/USD based on the current market structure. After reaching the Seller Zone near $92,000, the price once again faced strong rejection, forming a clear reversal right under the descending Trend Line. This confirms that sellers continue to defend this area and keep Bitcoin within a broader corrective structure. From there, BTC pulled back toward the Buyer Zone around $86,000–$85,500, which has acted as a reliable support multiple times in the recent sessions. The market is now forming a potential short-term recovery after a fake breakout below this zone, highlighting attempts from buyers to regain control. However, as long as the price trades below the Seller Zone and the descending Trend Line, bearish pressure still dominates the chart. The structure suggests that Bitcoin may attempt a move toward TP1 at $89,200, where the market previously consolidated and faced resistance. A clean rejection from the Trend Line could send the price back toward support for another test, while a confirmed breakout above $92,000 would shift short-term sentiment and open the way for stronger bullish continuation. On the other hand, a breakdown below $85,500 could expose BTC to deeper declines toward lower support lines. Please share this idea with your friends and click Boost 🚀

BTCUSDTWe have a big downtrend.
By breakout from support and resistance we will have continued trend to next target.
Breakout 82k ready to 70k.
Breakout 93k ready to 100k and 115k.
CRYPTOCAP:BTC BITSTAMP:BTCUSD BINANCE:BTCUSDT

Bitcoin Comes Back to Life! Buyers Return With Full PowerIf I had to name a “warrior rising from the storm” , it would be BTCUSDT right now. After plunging to the 84k region, Bitcoin has just staged an almost 7% rebound back toward 93k, accompanied by news that big money from Wall Street is flowing back into crypto and overall fear in the market is calming down. The USD is no longer overly strong, and Bitcoin is once again being mentioned as a key gauge of market risk appetite .
Looking at the 12H chart, BTC has broken back above the bottom of the long-term descending channel and is now pushing into the Ichimoku cloud. This rebound isn’t a “spike and die” pattern — it’s a sequence of steady bullish candles with shallow pullbacks , showing that buyers are firmly in control. The scenario is becoming clearer: price may pull back to around 90,500 to gather liquidity and retest the cloud edge, before potentially bouncing toward the higher resistance region around 107,300 — the next equilibrium zone of the trend.
With the supportive news flow (institutional money re-entering, market accepting a new price base after the drop) and a technical structure showing BTC has temporarily escaped the free-fall phase , I remain biased toward buy-the-dip setups . The plan is to wait for short pullbacks for entries rather than trying to sell against a recovering bullish wave that’s clearly being “revived”.

BTC 4H – Complete Technical Analysis & Trade PlanMarket Structure
BTC is still in a macro downtrend, continuously creating Lower Highs (LH) along the descending trendline.
Recent bounce from 87,766 formed a Higher Low (HL), but structure remains bearish until price closes above 93,080.
Key Levels
Resistance / Liquidity Above:
93,080 (Major LH + liquidity cluster)
98,888
107,473
116,380
Support / Liquidity Below:
87,766 (HL)
83,786
80,600
Pattern & Trend
Price is compressing inside a symmetrical triangle, between:
Descending trendline resistance
Ascending demand trendline
This signals a volatility expansion soon.
Indicators
RSI: 65 → bullish momentum but approaching overbought zone.
Previous bullish divergences have played out.
No fresh bearish divergence yet.
Volume
Impulse buying was strong, but volume faded near resistance.
This warns of a potential rejection unless a breakout happens with high volume.
Next Likely Move
BTC likely sees:
A pullback from the 93k resistance
Into the 90k–89.5k region
Then a decisive move based on trendline reaction.
Break above 93,080 = trend shift.
Break below 87,766 = continuation down.
High-Probability Long Setup
Condition: Breakout + retest of 93,080
Entry: 93,200–93,300 on successful retest
SL: 91,300
TP1: 98,888
TP2: 107,473
TP3: 116,380
RR: 2R to 7R
Confluence:
Break in structure, break in trendline, liquidity sweep, volume expansion.
High-Probability Short Setup
Condition: Rejection from descending trendline + 93k zone
Entry: 92,800–93,000
SL: 93,800 (above liquidity)
TP1: 90,000
TP2: 87,766
TP3: 83,786
TP4: 80,600
RR: 1.8R to 7R
Confluence:
Trendline resistance, LH zone, fading volume, liquidity above price.
Summary
BTC still bearish until 93,080 breaks.
Market in compression phase.
Large move coming soon.
Best setups:
Break-and-retest long above 93,080
Rejection short from 93,000

BITCOIN (BTCUSD): Bullish Reversal is Coming?!
On our yesterday's live stream, we discussed Bitcoin.
It looks like the market found a bottom and preparing for a bullish reversal.
To confirm a start of an uptrend, I suggest focus on
92000 - 94100 Order Block zone.
Its breakout and a daily candle close above will confirm a bullish reversal.
A formation of a Higher Low after the last retracement from that leaves
some clues of a weakening bearish momentum.
A breakout will be our final confirmation.
❤️Please, support my work with like, thank you!❤️
I am part of Trade Nation's Influencer program and receive a monthly fee for using their TradingView charts in my analysis.

BTC (bitcoin) Double-Bottom Reversal Testing Key ResistanceHi!
The chart shows Bitcoin forming a clear double-bottom pattern, supported by bullish RSI divergence on the lower panel. This combination often signals exhaustion of downward momentum and a potential trend reversal. The price has rallied strongly from the second bottom and is now pressing directly into the neckline zone, which aligns with a broader descending trendline drawn from previous swing highs.
This overlap creates a high-confluence resistance area. The current reaction here is critical: if price decisively breaks above the neckline and closes above the descending trendline, it would confirm the reversal structure and open the path toward the next major liquidity pocket around the 100k–104k region, marked on your chart as the target. This region matches previous consolidation and supply, making it a realistic upside magnet if breakout momentum is strong.
However, without a confirmed breakout, the neckline remains a potential rejection level, and price could retest the mid-range or even revisit trendline support. Bulls need continuation volume above resistance to flip the zone into support.
Overall, market structure has shifted from aggressive selling to a constructive bottoming phase. The key now is whether bulls can convert this pattern into a sustained trend reversal.

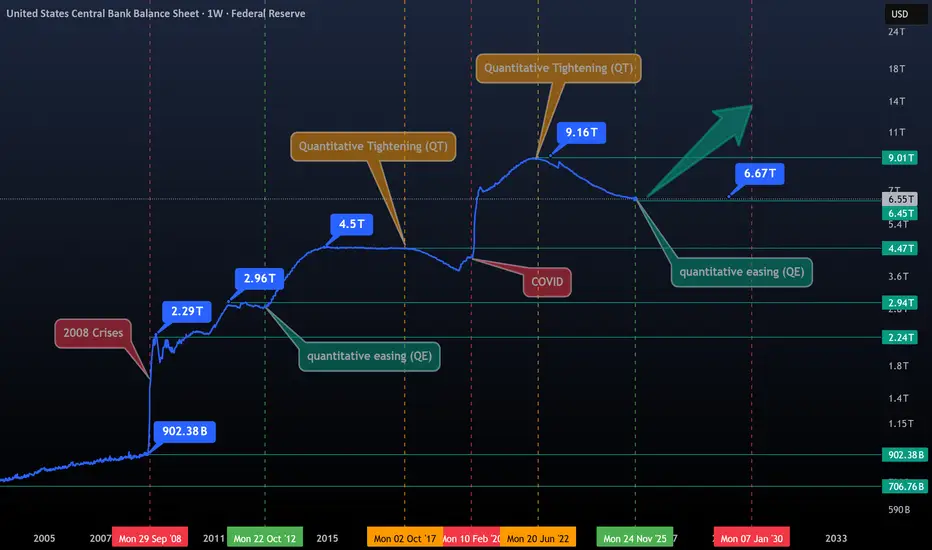
The Era of Gentle Money (QE)- This chart features labels for all key dates, offering a clear and comprehensive overview, including trillions in money creation, QT and QE phases, crises, and flash printing events.
- To truly understand stocks, cryptocurrencies, or precious metals, you first need to understand the monetary system and how it drives inflation.
- The market has been heavily suppressed since June 2022, when the Fed began its Quantitative Tightening (QT), the Fed kicked off a new QE phase on December 1, 2025.
- This is the primary driver behind yesterday’s BTC market surge.
- To complement this, we will soon have a new Fed President, Most likely, they will continue cutting rates, printing more money, and Banks will increase lending, encouraging people to take more risks, which could drive markets higher. Bearish sentiment is premature at this stage.
The heart of truth beats in the printer and in the river of liquidity !
Happy Tr4Ding !
QuickScalp on #EURUSD 📌 Market Insight: {#EURUSD }
⚠️ Risk Assessment: {High}
🚀 Approach:
Need a valid Momentum Structure , a nice one
better to have LTF entry sign first
#Ash_TheTrader #Forex #GBPJPY #MarketAnalysis #TradingSetup #RiskManagement #GOLD #Scalper #NQ #EURUSD

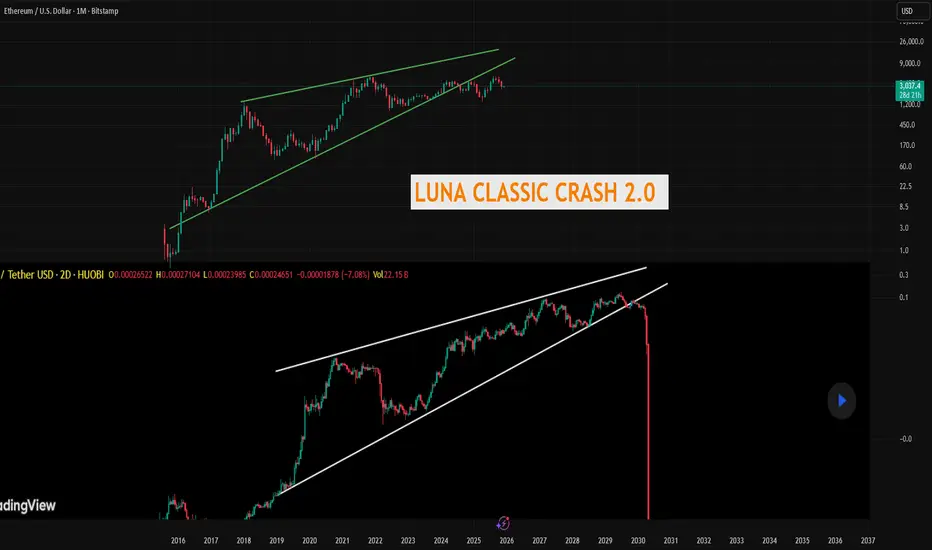
IS ETH ABOUT TO CRASH LIKE LUNA CLASSIC?I pointed this out a couple years ago you can fins my chart in my profile but I think ETH might crash like Luna Classic did. Look at the similarities with the massive rising wedge. ETH is actually outdated, clunky, the fees are stupid high, and its extremely overvalued, in my opinion. I called the Luna Classic crash down to about 50 cents from when it was at its high around 70 dollars, Ill link it below, it went waaay below even my crazy target. People thought I was crazy, go read the comments.
I think the same is on tap for Ethereum. Its already broken below if it cant get back above, I see a waterfall of red candles. What the narrative will be who knows but its coming.
The chart I added of Luna you cant even find it anymore on here this is a screenshot of that chart from my previous ideas.
Not financial advice just my opinion.
BTCUSDT.P - December 3, 2025Bitcoin is attempting to reverse from a prior downtrend, trading above a short-term rising trendline and pushing into a key resistance band around 93,000–94,300. The chart highlights a bullish scenario targeting the 112,000 area if price can clear this resistance and hold above the stop zone near 97,800. A failure to break and sustain above resistance, coupled with a break below the trendline, would favor a corrective move back toward the 87,300 profit level marked on the chart. Momentum is improving but remains vulnerable around resistance, making this a pivotal area for trend confirmation.

$BTCUSD - #Bitcoin cycle analysisHi guys! 👋🏻
🔔I'd like to share with you my current Bitcoin BTCUSD analysis here.
🔔 The last correction is taking an impulse 5-wave structure, it seeems like we are about to complete the 5th wave of the Intermediate A, bounce back to $102K to complete the B and drop back to the levels near $70K - 64K to complete the correction.
🔔 I know it sounds disappointing but we need a correction to regain power. Now, before throwing tomatoes, please see cycle charts below. And never underestimate the power and rules of cycles in the market.
🔔 Why channels always matter
🔔Wave paths
🔔Fibo
🔔 Path to $150K shall look like this
🔔Concetration of Supports and Resistances
Sharing for educational purposes!
✊🏻 Good luck with your trades! ✊🏻
If you like the idea hit the 👍🏻 button, follow me for more ideas.

BITCOIN FREE SIGNAL|SHORT|
✅BTCUSD price is approaching the mitigation block after sweeping liquidity inside the premium zone. If the retest confirms displacement, a drawdown into the target imbalance becomes likely.
—————————
Entry: 92,246$
Stop Loss: 93,200$
Take Profit: 90,000$
Time Frame: 4H
—————————
SHORT🔥
✅Like and subscribe to never miss a new idea!✅

$BTC — WEEK 49 TREND REPORTBTC — WEEK 49 TREND REPORT
Ticker: BITSTAMP:BTCUSD — 12/02/2025 @ 90,800
Timeframe: WEEKLY
This is a reactive structural classification of BTCUSD based on the weekly chart as of this timestamp. Price conditions are evaluated as they stand — nothing here is predictive or forward-assumptive.
⸻
1) Current Trend Condition
• Trend Duration: +9 weeks (bearish)
• Trend Reversal Level (Bullish): 103404.5$
• Trend Reversal Level (Bullish)( Confirmation ): 103405$
• Pullback Support: 100,074$
• Correction Support: 79,507$
⸻
2) Structure Health
• Retracement Phase:
Correction (approaching 61.8%)
• Position Status:
Unstable (price below both structural layers)
⸻
3) Temperature:
• Cooling Phase
⸻
4) Momentum :
• Bearish
⸻
Author’s Note
This analysis is fully reactive, not predictive. Market conditions, trend structure, and behavior are classified as they appear in real time. The objective is to identify where directional shifts first occurred, where structural integrity remains intact, and where it would begin to weaken if key levels were breached.
Predictive analysis projects outcomes that do not exist yet. Without price confirmation, prediction is built on baseless assumptions. This framework avoids that entirely by responding only to verified structural changes and live conditions.
The levels shown simply identify where the current trend structure first shifted and where it would begin to lose integrity if breached. Recognizing these boundaries allows for clearer interpretation of market behavior without relying on forward guarantees, speculative projections, or unsupported assumptions.
⸻
Methodology Overview
This classification framework evaluates directional conditions using internal trend-interpretation logic that references price behavior relative to its structural layers. These relationships are used to identify when price movement aligns with the framework’s criteria for directional phases, transition points, or regime shifts. Visual elements or structural labels reflect these internal interpretations, rather than explicit trading signals or preset indicator crossovers. This framework is observational only and does not imply future outcomes.

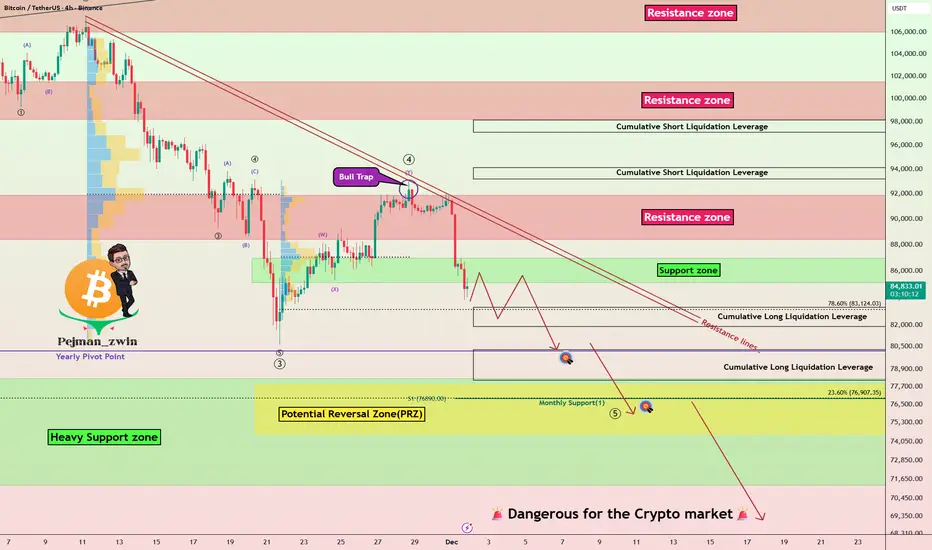
Bitcoin’s Worst November Ever — More Dump?In the past 24 hours, Bitcoin( BINANCE:BTCUSDT ) has dropped by more than -8%, marking its worst November performance ever, with a decline of about -17.67% this month alone.
Now, the question is whether Bitcoin will continue its downward trend or start to rebound. So, stay tuned!
At the moment, it seems that Bitcoin has successfully broken through the support zone($87,000-$85,130) and is moving toward the Cumulative Long Liquidation Leverage($83,273-$81,900).
From an Elliott Wave perspective, it appears that Bitcoin has completed its main wave 4, forming a bull trap, and is now in the process of completing the main wave 5.
On the fundamental side, we need to pay attention to a few key factors:
1-For one, the USDT.D% ( CRYPTOCAP:USDT.D ) is on the rise, and this could put downward pressure on the crypto market.
2-Another point is that the stock market is also trending upward, but unlike stocks, Bitcoin tends to react more negatively when the stock market declines.
3-The US 10-Year Government Bond Yield ( TVC:US10 ) also appears to be trending upward, causing riskier assets like stocks and Bitcoin to decline.
4-Additionally, geopolitical tensions, especially between the US and Venezuela over the past 72 hours, could also trigger further declines in Bitcoin if they escalate.
Considering all of this, I expect Bitcoin to continue its downward trend and test the heavy support zone($78,300-$71,280). The Potential Reversal Zone(PRZ) might serve as a rebound point for Bitcoin, but if the heavy support zone($78,300-$71,280) is broken, we could see a more severe sell-off in the crypto markets.
What do you think? Will Bitcoin drop below $70,000 or not? Let me know your thoughts!
Cumulative Short Liquidation Leverage: $97,100-$98,135
Cumulative Short Liquidation Leverage: $93,215-$94,130
Cumulative Long Liquidation Leverage: $80,263-$78,131
First Target: Cumulative Long Liquidation Leverage: $80,263-$78,131
Second Target: Potential Reversal Zone(PRZ)
Stop Loss(SL): $90,423
Points may shift as the market evolves
💡 Please respect each other's opinions and express agreement or disagreement politely.
📌Bitcoin Analysis (BTCUSDT), 4-hour time frame.
🛑 Always set a Stop Loss(SL) for every position you open.
✅ This is just my idea; I’d love to see your thoughts too!
🔥 If you find it helpful, please BOOST this post and share it with your friends.
BTC 2026 Outlook - Roadmap Speculation to $300KHello BTC Watchers.
Let's talk about BTC in the Logarithmic view.
I mapped out the date-ranges, as well as how far the price fell logarithmically after each top. You'll see the word "lines" on the chart. This simply indicates the amount of diagonal trendlines it has fallen. By using this pattern-dedicated approach, a commonality is found which may be useful in speculating a future price. Because if not for past history, how else would we speculate on the future?
It's interesting to note that the past 3 ATH's (all time high's) are each lower than the previous if you compare it not to price but to the "lines". Even the fifth high (the one coming next) will be on a lower click-line than the previous, and that estimate is already over 300k. This is a really helpful way to speculate a future high because usually on a regular-view chart, the zone above the ATH is uncharted territory. You could use a Fibonacci trend-based extension, but this is limited to the cycle that you're using for input points. Logarithmic chart + indicators factor in the entire history of the price.
This would mean the new peak could be in 2026 around USD 300k.
It's important to note that this ay not be a straight line up. As you'll see, although the price has been increasing exponentially, there have been periods of hard pullbacks or corrections. These are great times to enter the market, NOT when the price is close to the peak of the curve (in green).
So could it be that this is just another dip in the road towards a new ATH - despite the recent market liquidation?

Bitcoin Count to $55,000Need to get over 100k to turn bullish at this point. Think we are either finishing this move around 72,500 or going to continue down to around 55-60k
Not financial advice

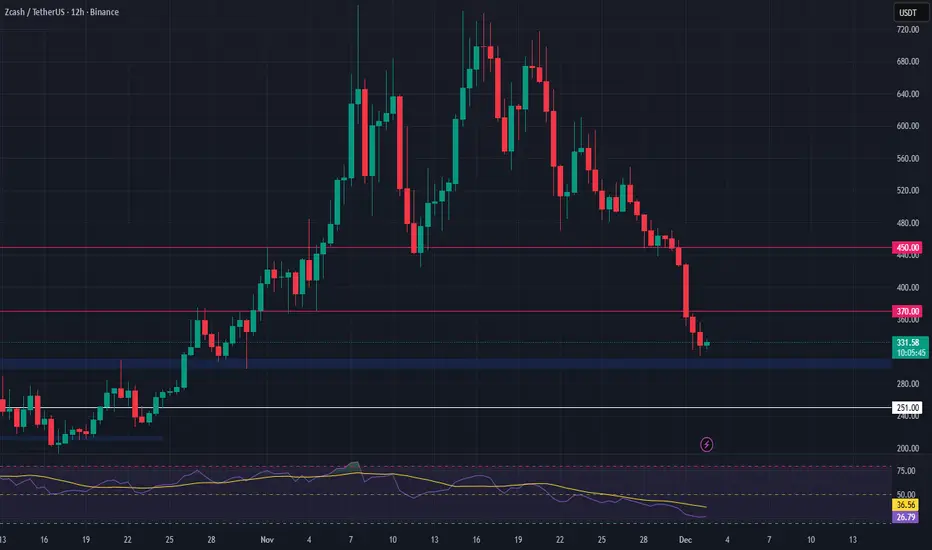
ZEC Breakdown or Bounce? Key Support in PlayAfter a strong multi-week rally, ZEC is now showing signs of exhaustion and appears to be breaking down from recent highs. Price is testing a critical support area, and how it reacts here could shape the next leg of the move.
We are watching the $300–$310 zone as a potential entry point if buyers step in. This area has previously acted as a consolidation range and could offer a clean bounce setup. If support holds, we could see continuation toward higher targets.
📈 Trade Setup:
Entry Zone: $300–$310
Take Profits: $370 / $450
Stop Loss: $251
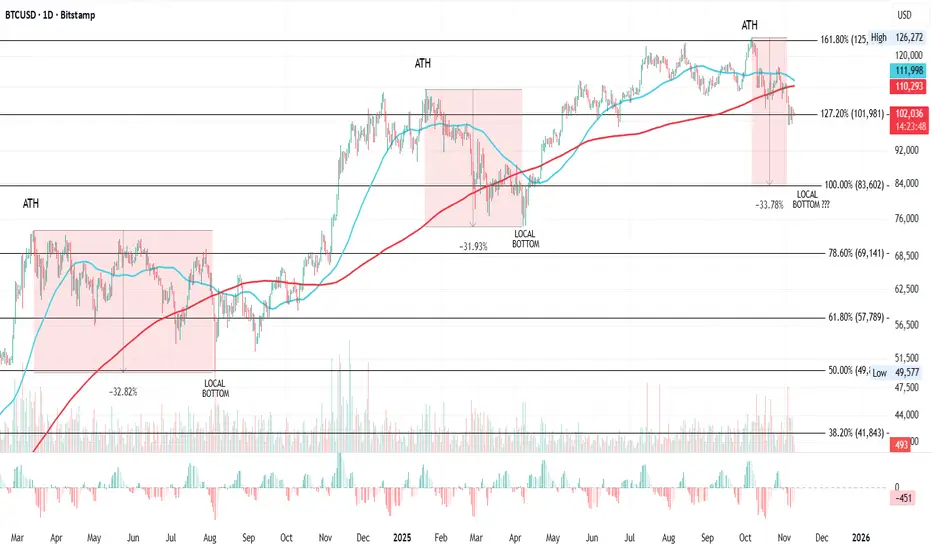
BTCUSD Daily: Watching for Post-ATH Correction Pattern to UnfoldPotential Local Bottom Ahead?
Overall Outlook: I'm tracking a recurring pattern in Bitcoin's price action following each all-time high (ATH), involving sharp drops, interactions with the 50-day and 200-day moving averages (MAs), and key Fibonacci levels. This has played out twice before in this cycle, and we're now in the midst of what could be the third iteration. The setup suggests a potential further drop of around 33.78% from the latest ATH, targeting the 100% Fib level for a local bottom, possibly timed near a death cross. If this holds true, it could signal a strong buying opportunity at the bottom, as price has historically reversed and rallied hard afterward. For now, the theory looks promising, but I'll update this idea as events unfold.
Key Pattern and Historical Observations: This analysis focuses on a consistent post-ATH correction structure that's emerged in Bitcoin's daily chart over the past couple of years. It typically involves: A new ATH breaking above a key Fib extension level.
A subsequent drop of 31-33%, crossing under the 50MA and 200MA.
Bottoming near a lower Fib level (often 2 levels below the ATH breakout point), with timing influenced by the death cross (50MA crossing under 200MA).
Post-bottom recovery: Choppy ups and downs, reclaiming MAs and Fib levels, leading to the next leg up.
Let's break it down by each ATH in the series: First ATH (March 2024): Peaked at $73,794, right above the 78.60% Fib level. This was followed by a 32.82% drop to a local bottom at $49,577. Price action dropped 2 Fib levels to land at the 50% Fib, after crossing under both the 50MA and 200MA. Notably, the local bottom formed just days before the death cross occurred, suggesting the cross could help time reversals. From there, recovery wasn't immediate, price pushed up, hit resistance at the 200MA, dropped, rallied again, and repeated this process. Eventually, it found support at the 50MA and pushed over the 200MA. This consolidation phase lasted from March to August 2024 before the uptrend resumed.
Second ATH (January 2025): Hit $109,356, breaking above the 127.20% Fib level. Similar to the first, it dropped 31.93% to a local bottom at $74,434 and again, 2 Fib levels lower, landing close to the 78.60% Fib (which was key in the prior ATH). This time, the bottom came shortly after the death cross, flipping the timing slightly from the previous instance (after vs. before). Post-bottom, price reclaimed the next Fib level and the 50MA, then crossed the 200MA and held strong without looking back, all the way until October 2025.
Third ATH (Early October 2025): Reached $126,272, just above the 161.80% Fib level. Following the pattern, but accelerating faster this time, price has already dropped under the 200MA and found at least temporary support at the 127.20% Fib level.
Current Setup and Open Questions: Based on the prior two ATHs, this third one raises two key questions that could define the next move: Will price drop to the next lower Fib level? That would mean targeting the 100% Fib, implying a total drop of around 33.78% from the $126,272 ATH (putting the local bottom somewhere near $83,600, give or take based on exact Fib anchoring).
Will a death cross mark the bottom? In the first case, the bottom was days before the cross; in the second, shortly after. Watching for an impending death cross could help time the reversal in real time.
If the pattern repeats, we're likely in the early stages of the correction, with more downside before the bottom forms. This setup has a good chance to play out given the historical parallels, offering a prime spot to buy the dip once the local bottom confirms. I'll keep this idea updated as price action develops, especially monitoring Fib interactions, MA crosses, and any signs of reversal. Potential Trade Considerations: Watch Zones: Resistance: 161.80% Fib ($126,272, prior ATH) and 200MA for any failed retests.
Support Targets: 127.20% Fib (current temp support), then 100% Fib for the potential local bottom (~33.78% drop zone).
Entry Idea: No aggressive positions yet, wait for signs of bottoming near the 100% Fib or around a death cross. If confirmed, long entry on reversal signals (e.g., bullish candle above 50MA).
Risk Management: Set stops below key Fib supports. Target post-recovery upside to prior ATH or higher Fib extensions.
Invalidation: A quick reclaim of the 200MA without further drop could break the pattern, shifting to bullish continuation.
External Factors:
While the technicals are strong, BTC in late 2025 is heavily influenced by US macros, which could amplify or disrupt this post-ATH drop pattern.
For instance: Ongoing Government Shutdown: The US federal government has been shut down since October 1, 2025, making this the longest shutdown in history (now at 39+ days as of Nov 9). It's causing widespread disruptions, including halted SNAP benefits for millions, delays in airport operations due to air traffic controller shortages, increased reliance on food pantries by military families, and broader economic strain like reduced tourism and spending ahead of Thanksgiving. Negotiations are stalled, with Senate Republicans pushing for votes to reopen but Democrats holding out for extensions on ACA tax credits. This uncertainty could weigh on risk assets like BTC, potentially accelerating the expected 33.78% drop if it drags on and hurts consumer confidence or triggers a recessionary vibe. On the flip side, a quick resolution might spark a relief rally, shortening the correction phase.
Fed's Stance on Rate Cuts: There's no FOMC meeting in November, so no rate cut then. For December, Fed Chair Powell emphasized after the October 29 quarter-point cut (bringing the fed funds rate to 3.75%-4%) that another reduction is "not a foregone conclusion" and depends on incoming data. Internal divisions are evident: some officials like Beth Hammack and Lorie Logan question further easing, citing a resilient economy and risks of reigniting inflation.
The shutdown is complicating this by blocking key data releases (e.g., jobs reports), which Powell likened to "driving in the fog." If no cut happens in December, it could pressure BTC lower in the short term by signalling tighter policy, aligning with a deeper Fib target. But if data softens dramatically (e.g., due to shutdown effects), a surprise cut might catalyze the bottom and reversal.
Ending QT and Potential QE Shift: The Fed announced it will end quantitative tightening (QT) on December 1, halting the balance sheet runoff and instead rolling over maturing Treasuries to hold holdings steady at around $6.6 trillion. This addresses tightening money markets and funding strains, but it's not yet quantitative easing (QE), it's more of a pause to maintain ample reserves rather than active expansion. Some analysts speculate this could pave the way for QE resumption if economic conditions worsen (e.g., prolonged shutdown or labour market cooling), potentially starting in December or early 2026. For BTC, ending QT removes a liquidity drain, which is bullish long-term and could support post-bottom rally. If QE kicks in sooner, it might act as rocket fuel, shortening the correction and pushing toward new ATHs faster, but watch for inflation risks that could prompt hawkish pushback.
If you like this idea, feel free to leave a comment, boost, or share your thoughts.
Remember, this is not financial advice; trade responsibly!
Always take profits and manage risk!
Interaction is welcome in the comments!
BITCOIN Can this Bear Cycle be mapped?Bitcoin (BTCUSD) is on its 3rd straight week of consolidation on its 1W MA100 (green trend-line) after marginally breaking below it (green circle). We've shown in previous analyses how the build up, including the Higher Lows trend-line (1W RSI Lower Highs Bearish Divergence) and the 1W MA50 (blue trend-line) rebound, of the 2025 Bull Cycle High, mirrors the 2021 peak formation.
Given the strong similarities, there are valid probabilities suggesting that those can expand into the Bear Cycle too. And this is what we attempt to do on today's post, mapping the new Bear Cycle based on the 2022 price action.
As you can see, we have classified the 2022 Bear Cycle into three phases. The key characteristic of those is MA contact. Phase 1 ends when the price hit the 1W MA100, Phase 2 when it hits the 1W MA200 (orange trend-line) and Phase 3 the 1W MA350 (red trend-line). So far the symmetry is also high on the time range between the 1W MA50 and 1W MA100 contacts among the two fractals (245 days vs 224 days).
If this holds for the whole duration of the 2026 Bear Cycle as well, we can expect it to roughly be 52 weeks (364 days) from the Bull Cycle Top to the Bear Cycle bottom, like the 2022 sequence.
The time Fibonacci levels help at maintaining a sense of positioning within the Bear Cycle, with the 0.236 Fib being just before Phase 1 ends and Fib 0.618 when Phase 2 makes contact with the 1W MA200.
Even though a straight up repeat of the -77.36% decline of the 2022 Bear Cycle would put the potential new bottom just below $30k, a Fibonacci extension symmetry suggests that Fib 1.0 was the Low we just made (1W MA100), Fib 1.5 ext around the time the price makes contact with the 1W MA200 and Fib 2.0 when the Cycle bottoms.
This indicates that $63900 is the first point of interest (and potentially start of buying) and $51000 the potential bottom.
Would you agree with this mapping? Feel free to let us know in the comments section below!
---
** Please LIKE 👍, FOLLOW ✅, SHARE 🙌 and COMMENT ✍ if you enjoy this idea! Also share your ideas and charts in the comments section below! This is best way to keep it relevant, support us, keep the content here free and allow the idea to reach as many people as possible. **
---
💸💸💸💸💸💸
👇 👇 👇 👇 👇 👇
