bitcoinThe chart speaks for itself. As you can see, after breaking down from the descending wedge, the price has dropped. Now it can be said that the ABC corrective waves are close to completion, with only the final wave — wave C — remaining. in my view, Bitcoin could rise to 130,000 dollars. Remember this: the sea erupts in a single moment, and nothing can stop it.
Bitcoin (Cryptocurrency)

BITCOIN - LONG - Value Holds While Leverage PanicsBitcoin 4H Analysis
Price is currently trading inside the Point of Control of the Jan 14 impulse up. This is a high participation area where both buyers and sellers have done the most business, making it a key decision zone.
As long as we hold this PoC, the market is accepting value. A clean acceptance and breakout from this range opens continuation toward Target 1 at ~80k (Zone 1), followed by Target 2 at ~92.5k (Zone 2), both aligned with higher timeframe liquidity and fib-based resistance clusters.
Order flow perspective
Spot CVD is showing a clear bullish divergence. While price went sideways to slightly lower, spot buyers continued to step in. This signals real demand absorbing sell pressure rather than chasing price.
Stablecoin-margined futures CVD remains firmly negative. Perp traders are still selling and pressing shorts without downside expansion. Coin-margined futures CVD confirms the same behavior, showing leverage positioned defensively.
Open interest across both stablecoin and coin-margined contracts continues to bleed. This suggests leverage is being flushed rather than new risk being added, which supports a basing structure.
Accumulation / Distribution
The A/D indicator is turning up after a sharp downside sweep. Despite the volatility, accumulation is increasing, which confirms that smart money is absorbing supply during consolidation rather than distributing into strength.
Coinbase spot flow
Coinbase Spot CVD is trending hard up. Large spot participants are aggressively accumulating while derivatives remain skewed short. This divergence historically favors upside resolution once price exits value.
Summary
We are trading at value. Spot is leading, accumulation is increasing, leverage is leaning the wrong way, and acceptance above the PoC sets the stage for continuation into ~80k first, then ~92.5k. Until value is lost, downside looks corrective rather than impulsive.

Bitcoin 2026- Simple chart : Trend corridor, RSI deeply oversold, Green Bubbles lead the way.
- Whether Bitcoin bottomed at 60k or dips to 50k or even 40k doesn’t really matter.
When it’s trading at 250k+, those differences fade into noise.
- Markets don’t reward perfection, they reward patience, risk management, and timing that’s good enough. If anyone had a magic trick to nail the perfect entry, we’d all be rich already.
- Now is the time to accumulate with discipline through DCA, not to amplify fear or noise.
- As traders, we adapts and executes a plan. We don’t panic over headlines or try to catch the exact bottom.
Happy Tr4Ding!

BTCUSDT Long: Descending Channel Breakout - Demand HoldingHello traders! Here’s a clear technical breakdown of BTCUSDT (2H) based on the current chart structure. Bitcoin previously traded within a well-defined consolidation range, where price moved sideways for an extended period. This ranging phase reflected a temporary balance between buyers and sellers and allowed liquidity to build above and below the range boundaries. Eventually, this equilibrium resolved to the downside, triggering a strong bearish impulse. After the range breakdown, BTC entered a clean descending channel, characterized by consistent lower highs and lower lows. Price respected both the upper and lower channel boundaries well, confirming controlled bearish pressure rather than emotional selling. This structured decline indicates that sellers remained in control while buyers were only able to generate short-lived pullbacks. The bearish move culminated at a clear pivot low, where selling momentum exhausted and aggressive buyers stepped in. From this pivot point, Bitcoin produced a sharp bullish reaction, breaking decisively above the descending channel, which marked a meaningful structural shift from bearish continuation to recovery. Following the breakout, price impulsively rallied and reclaimed key levels before reaching the Supply Zone around 71,700, where bullish momentum temporarily stalled. This level acted as a logical resistance, leading to a pullback.
Currently, BTC is consolidating above the Demand Zone and along the rising demand line, suggesting that the retracement is corrective rather than the start of a new bearish trend. Multiple reactions from this demand area indicate active buyer interest and defense of the level, reinforcing the idea of a developing higher-low structure. As long as price holds above the Demand Zone and respects the rising demand line, the broader bias remains cautiously bullish.
My primary scenario favors upside continuation after consolidation. A sustained hold from demand opens the door for a renewed push toward the 71,700 supply level (TP1), which represents the first major upside target and a logical area for partial profit-taking. A clean breakout and acceptance above this supply zone would confirm bullish continuation and signal potential expansion toward higher highs. Conversely, a decisive breakdown below the Demand Zone and loss of the rising demand line would invalidate the bullish recovery scenario and suggest a deeper corrective move. Until such confirmation appears, the current market structure points to balance with a bullish continuation bias from demand. Manage your risk!

Where Can Bitcoin Go? Part 10 – The ChartWhere Can Bitcoin Go? Part 10 – The Chart 📊🔥
Same structure.
Same levels.
Same battlefield.
This is the clean chart version following the video update:
“Where Can Bitcoin Go? Part 10 (Major Support)”
🎥 Video breakdown here:
Now let’s focus purely on the chart.
66,300 remains the key level.
This is the major support/resistance flip zone we’ve been tracking since 2023.
The yellow level worked before.
It acted as resistance.
It acted as support.
It defined structure.
And today — price is reacting from it again.
As long as 66,300 holds , the continuation scenario remains valid.
Lose it with acceptance below? I’m out of longs. Simple.
This is not emotion.
This is execution.
Hold support → expansion toward 70k and above
Lose support → risk management activates immediately
The beauty of structure is that it removes noise.
Perspective Shift 🔄
Most traders look for targets first.
Professionals define invalidation first.
It’s not about being right.
It’s about being protected.
Hope is expensive.
Structure is profitable.
Trade the level. Respect the level.
And let the market decide the rest. 📈
I’m just sharing wisdom, not instructions. No licenses, no guarantees — just years of trading scars and precision chartwork. Be smart, protect your capital, and don’t copy blindly.
One Love,
The FXPROFESSOR 💙

Bitcoin Breaks Major Support — Extreme Fear or Another Leg Down?Bitcoin ( BINANCE:BTCUSDT ), as I highlighted in my previous weekly idea , started its decline. The drop came with higher momentum than expected, surprising many, and it successfully broke the heavy support zone($78,260-$64,850).
Now, here are the fundamental reasons for Bitcoin’s movement in the last 24-48 hours, as well as the general context:
•Global Risk-Off Sentiment: Investors moved away from high-risk assets as global equity markets—especially tech stocks—came under heavy selling pressure.
•Lack of Strong Spot Demand: There was no meaningful inflow of fresh capital to absorb selling pressure at key support levels.
•Institutional Pressure & Unrealized Losses: Large BTC holders and public companies with Bitcoin on their balance sheets reported increased unrealized losses, weakening market confidence.
•Correlation With Traditional Markets: Bitcoin continued to trade as a risk asset, following the downside momentum of global financial markets.
•Forced Liquidations: High leverage across the market led to cascading liquidations, accelerating the downside move.
Bitcoin Fear & Greed Index is currently at 9 — marked as “Extreme Fear”.
This is the lowest reading since June 2022, when the market sentiment collapsed following major events like the Terra crash.
Historically, when the Fear & Greed Index dropped this low, Bitcoin experienced prolonged selling pressure and volatility, followed by eventual stabilization as fear subsided. Extreme Fear readings often coincide with market bottoms or oversold conditions, but they do not guarantee an immediate price reversal.
In short: Extreme fear can signal that market participants are overly pessimistic — possibly a contrarian buying environment — but confirmation from price action and other indicators is crucial before assuming a trend reversal.
Now, let’s take a quick look at Bitcoin’s 4-hour chart to assess the current situation.
It appears that Bitcoin, given its momentum, has successfully broken the heavy support zone($78,260-$64,850) and is currently pulling back toward that zone.
From an Elliott Wave perspective, it seems we are in the final stages of the main wave 4. After this pullback near Fibonacci levels, we anticipate another decline. Since the drop’s momentum has been strong, wave 5 could potentially be truncated.
I expect Bitcoin to resume its drop from one of the Fibonacci levels or Cumulative Short Liquidation Leverage($68,900-$67,200), targeting at least $64,123.
First Target: $64,123
Second Target: $62,103
Stop Loss(SL): $72,033
Points may shift as the market evolves
Cumulative Long Liquidation Leverage: $60,000-$58,000
CME Gap: $84,560-$79,660
CME Gap: $54,545-$52,980
💡 Please respect each other's opinions and express agreement or disagreement politely.
📌Bitcoin Analysis (BTCUSDT), 4-hour time frame.
🛑 Always set a Stop Loss(SL) for every position you open.
✅ This is just my idea; I’d love to see your thoughts too!
🔥 If you find it helpful, please BOOST this post and share it with your friends.

TradeCityPro | Bitcoin Daily Analysis #264👋 Welcome to TradeCity Pro!
Let’s move on to Bitcoin analysis. The market is still trading inside a ranging box.
⌛️ 1-Hour Timeframe
Yesterday, Bitcoin formed a support level around 68,586.
✨ After reacting to this area, price printed a lower high, and it has now returned to test the support again.
✔️ At the moment, Bitcoin is reacting to the 68,586 zone. If this level breaks, price could resume its bearish move, and we can look to open a short position.
🔔 The main trigger for Bitcoin right now is the break of 67,735. A break of this level would also be a valid short entry. So, 68,586 is a riskier trigger, while 67,735 is the more reliable one.
🔍 Since price has formed a lower high, the probability of breaking 67,735 is higher. However, if price moves up toward 71,616, we can also look for a long position on a breakout. That said, it’s better to wait for volume confirmation on long trades, as the dominant trend is still bearish.
🎲 Today, the market could offer both short and long opportunities, so stay alert and don’t miss the setups.
❌ Disclaimer ❌
Trading futures is highly risky and dangerous. If you're not an expert, these triggers may not be suitable for you. You should first learn risk and capital management. You can also use the educational content from this channel.
Finally, these triggers reflect my personal opinions on price action, and the market may move completely against this analysis. So, do your own research before opening any position.

Where Can Bitcoin Go? Part 10 (Major Support)Part 1, click on Play:
Where Can Bitcoin Go? Part 10 – The Sequel 🚀📈
Time for a major update today.
I’m back on my all-time big chart — the same framework I’ve been using since 2023 in the “Where Can Bitcoin Go?” series. And guess what?
The levels are the same.
And the chart? It worked.
Back in 2023, I marked the yellow level as both support and resistance. Price respected it. We hoped for continuation higher at the time — it didn’t happen — but the level itself? Flawless. 🎯
Fast forward to today.
66,300 is once again the battlefield.
A major support/resistance level that we must hold and master.
Right now, we are reacting from that zone, and that gives room for a calculated trade .
Let me be clear:
• This is a support/resistance flip zone.
• If 66,300 is lost with acceptance below, I’m out of longs. No ego. No hope.
• But as long as it holds? I’m loading long positions for very, very good reasons. 🔥
This is not gambling.
This is structure.
This is history repeating with precision.
The bigger chart still shows:
• Massive structural resistance from prior cycles
• Massive structural support underneath
• A clean technical framework that has worked across years
And now we’re sitting exactly where decisions are made.
Keep the level — continuation scenario opens.
Lose the level — risk management takes over.
Simple. Mechanical. Professional.
Trading Wisdom 📜
The market doesn’t reward prediction.
It rewards risk management .
Anyone can say “Bitcoin to 200K.”
Few can say: “If this level breaks, I’m out.”
That’s the difference between hope and structure.
Human traders survive because they adapt.
AI calculates. Humans decide. 🧠
Master your invalidation before you master your target.
Disclaimer
Nothing I post is financial advice. It's perspective. I’ve mastered the art of prognosis, but you are the one behind the trigger. Always know your levels, and respect your risk.
One Love,
The FXPROFESSOR 💙

XRP/USDT | More Bullish Move Ahead ? (READ THE CAPTION)By analyzing the #XRP chart on the weekly timeframe, we can see that after the initial dump toward the $1.12 level, price reacted strongly to demand and managed to recover up to $1.145. Currently, XRP is trading around the $1.41 area, which is a very important level from a structural perspective.
If price can stabilize and hold above the $1.40 level, this would confirm bullish continuation from the recent demand reaction, and we can expect further upside toward higher targets. As long as price remains above this key level, the probability shifts in favor of buyers despite the broader bearish context.
📈 Upside Targets :
• Target 1: $1.58
• Target 2: $1.82
• Target 3: $2.15
This chart will continue to be updated step by step as price moves.
Please support me with your likes and comments to motivate me to share more analysis with you and share your opinion about the possible trend of this chart with me !
Best Regards , Arman Shaban

Is Bitcoin About to Complete Wave C and Explode Upward?First of all, make sure to pay close attention to the timeframe — this analysis is based on the 1-day timeframe.
Bitcoin appears to be approaching the completion of wave C within the current corrective structure. If this count plays out as expected, we could see the end of the corrective phase soon, followed by a potential bullish reversal. The next upward move may develop either as a new impulsive wave to the upside or as an X wave within a larger corrective structure. In both scenarios, the probability of a bullish continuation increases once wave C is fully completed and confirmed.
On the chart, two key trendlines are marked in red. These trendlines are critical for short-term price direction. A confirmed breakout above the first trendline would be an early signal of strength and could open the path for price to move toward the second trendline. The second trendline acts as a higher-level dynamic resistance, and the reaction there will provide further confirmation of whether the market is transitioning into a stronger bullish phase.
A clearly defined support zone is also highlighted on the chart. This area represents a potential accumulation region. Rather than entering with a full position at once, a DCA (Dollar-Cost Averaging) strategy is recommended within this support range to manage risk more effectively and reduce the impact of short-term volatility.
Upside targets are specified on the chart as well. As part of proper risk management, it is advisable to secure the trade at the first target by moving the stop loss to breakeven. This approach allows traders to eliminate downside risk while keeping exposure for potential continuation toward higher targets.
As always, wait for confirmation, manage your risk carefully, and avoid overexposure in volatile conditions. This analysis is based on the current wave structure and trendline behavior, and it should be reassessed if the market invalidates the outlined scenario.
If you have a coin or altcoin you want analyzed, first hit the like button and then comment its name so I can review it for you.
This is not a trade setup, as it has no precise stop-loss, stop, or target. I do not publish my trade setups here.

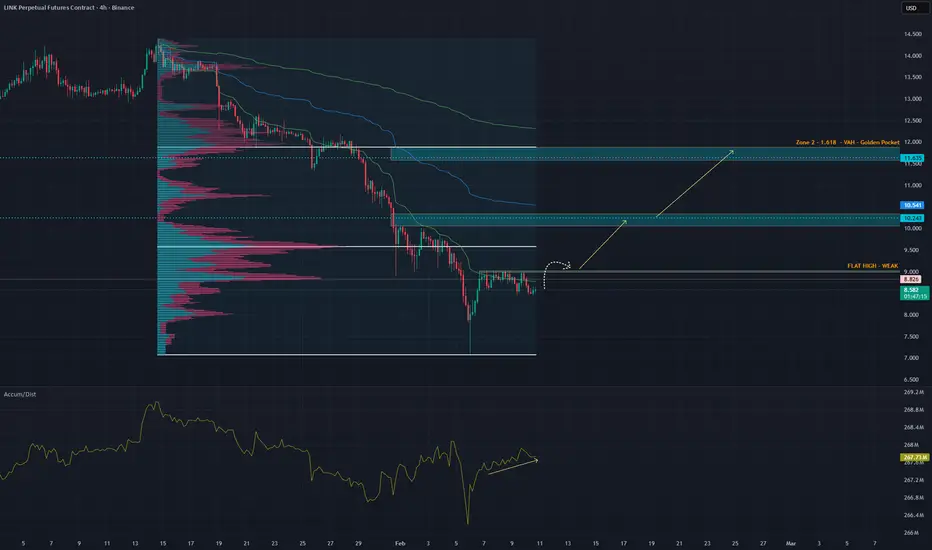
LINK - LONG - The Market Is Setting a Trap$CHAINLINK
Sometimes the market does not whisper.
It speaks clearly.
Both stablecoin-margined and coin-margined futures CVD are bleeding. Sellers are active across derivatives, yet price is barely moving. That tells you everything you need to know. Supply is being absorbed.
Today we saw a sharp increase in fresh leverage, and it is overwhelmingly shorts. Net shorts are up almost 4x since yesterday, but price refuses to break down. If this market wanted lower, it would already be there.
On the 4H Binance Perps, momentum is rolling over while price holds structure. A clean hidden bearish divergence, but with no downside follow-through. That is positioning fighting price, not price confirming positioning.
Now add the Accumulation / Distribution read.
After the downside sweep, A/D turns up and keeps rising while price consolidates. That means supply is being absorbed quietly. This is not distribution into strength. This is accumulation into fear. Smart money is active while volatility compresses.
Look at open interest.
OI is rising while price goes sideways. New positions are entering, not exits. Combine that with negative CVD and you get one thing. Aggressive short positioning into a market that is not accepting lower prices.
Now zoom out and look at the liquidation heatmap.
There are clear liquidation clusters stacked above current price. That is where short liquidations live. Liquidity does not block price. It pulls it.
Markets do not move because of opinions.
They move to resolve imbalance.
When shorts pile in, CVD bleeds, OI builds, and price refuses to break down, the path of least resistance often flips hard and fast. Those clusters are not resistance.
They are objectives.
This is not prediction.
This is structure, positioning, and liquidity aligning.
For me, this is an A++ asymmetric setup. Risk is clearly defined. Upside is driven by forced participation.
Targets:
10.20
11.50
Price does not care who is right.
It cares who is trapped.
Gitcoin in Danger Zone- currenty under the 200 week EMA
But on a brighter Note, this is usually the sign that we are entering the Bottom Area, as mentioned Previously..
I was hoping PA would remain above and it may go back by End of this week, by Candle close.
PA is oversold on may Timeframes but the 4 hour has reached up to Beutral and the Nulls may let this cool off before a continued Range..
We just have to wait and see BUT it does present EXCELLENT Buying oppertunities.
And again, as mentioned Previously, On Friday 13th ( snigger snigger ) We have the inflation figures being released in the USA..
THIS could be a signal for a movement.....We may just be waiting till then

TON/USDT | TON Holds the Line After Sharp Dump,Bulls Coming BackBy analyzing the LSE:TON chart on the weekly timeframe, we can see that after the strong bearish move toward the $1.11 level, price reacted to demand and has now recovered to the $1.34 area. This rebound shows that buyers are still present, but confirmation is still required.
The key condition for further upside is price stabilization above the $1.245 level. Only if TON manages to hold and consolidate above this zone can we expect a stronger mid-term bullish continuation. Below this level, price remains vulnerable to further volatility and consolidation.
📈 Potential Upside Targets
• Target 1: $1.55
• Target 2: $1.78
• Target 3: $2.05
As always, this chart will be updated step by step as price reacts to key levels.
Please support me with your likes and comments to motivate me to share more analysis with you and share your opinion about the possible trend of this chart with me !
Best Regards , Arman Shaban

If You Invested $1000 in BITCOIN vs GOLD vs SILVER in Dec 2017 !If You Invested $1,000 in BTC, Gold, and Silver in Dec 2017 – Performance Today!
Back in December 2017, Bitcoin was all the rage. Hitting nearly $20,000, it promised to be the ultimate “store of value” and the future of money. Fast forward to February 11, 2026, and the reality looks very different. Bitcoin, a technology now nearly two decades old, has failed to live up to that promise—not even as a reliable store of value.
Let’s break down what would have happened if you invested $1,000 in Bitcoin, gold, and silver on December 19, 2017:
Asset Investment Dec 2017 Value Feb 2026 Gain
Bitcoin (BTC) $1,000 $2,740 +274%
Gold (XAU) $1,000 $3,000 +300%
Silver (XAG) $1,000 $4,250 +425%
The numbers speak for themselves:
Bitcoin: Despite its hype, your $1,000 only grew to $2,734 - barely keeping pace with inflation over the past eight years.
Gold: The traditional safe haven performed slightly better, reaching $3,000, proving that stability and trust still matter.
Silver: Surprisingly, silver outperformed both Bitcoin and gold, turning $1,000 into $4,250 - an impressive 425% gain.
Bitcoin may have been exciting in 2017, but in terms of long-term wealth preservation and real returns, gold and silver have clearly delivered better results. Volatility and hype can create dramatic short-term gains, but over the long haul, proven assets still dominate.
In 2026, Bitcoin is no longer the revolutionary “digital gold” it once claimed to be.
Meanwhile, traditional metals like gold and silver continue to reward patience and prudence—sometimes more than the latest crypto craze!

Ethereum (ETHUSD) – Key Support Breakdown & Final Washout Ahead?Back to Ethereum this week as the crypto carnage continues and the infamous 4-year cycle unfolds right before our eyes.
ETH has now reversed back to levels not seen since May 2025, breaking down through multiple key technical zones. Here’s what’s unfolding:
📉 Key Technical Breakdown
✅ 2600–2800 zone – Former support, now turned resistance after last week’s breakdown.
⚠️ 2100–2200 zone – Also breaking down, reinforcing bearish momentum.
🔻 Potential washout target: 1650–1750 – ETH tagged the upper bound of this zone late last week.
🧠 Why This Matters
We could be entering the final phase of the drawdown—what many refer to as a "capitulation low." The 1650–1750 range will be critical.
If ETH holds this zone, we may be setting the stage for a major macro bottom, potentially creating one of the best long-term accumulation opportunities in years.
🧭 What to Watch
📌 Resistance: 2100–2200 (short-term), 2600–2800 (major reversal level)
🛑 Support: 1650–1750 – Key area to watch for reaction and volume pickup
🔄 Invalidation: Continued weakness below 1650 could signal deeper downside


BTCUSDT: Bullish Reclaim Opens Door to Higher LevelsHello everyone, here is my breakdown of the current BTCUSDT setup.
Market Analysis
BTCUSDT was previously trading within a well-defined downward channel, characterized by a clear sequence of lower highs and lower lows. This structure reflected controlled bearish pressure, where sellers remained in control but price action stayed orderly rather than impulsive. Each rally toward the channel resistance was consistently rejected, confirming the validity of the bearish trend and the dominance of supply at higher levels. As price approached the lower boundary of the descending channel, selling momentum began to weaken. BTC formed a base near the Support Zone around 69,700, where demand stepped in aggressively. This resulted in a sharp bullish reaction and a breakout below the channel followed by a quick reclaim, signaling a potential exhaustion of sellers. After this move, price successfully broke back above the key Support Zone, confirming acceptance above demand and shifting short-term market sentiment.
Currently, BTCUSDT is consolidating above the reclaimed support while respecting a rising triangle support line, indicating that buyers are gradually gaining control. This consolidation appears constructive rather than distributive, suggesting accumulation before the next directional move. The market is now transitioning from a bearish continuation phase into a corrective recovery structure.
My Scenario & Strategy
My primary scenario favors bullish continuation, as long as BTC remains above the Support Zone around 69,700 and continues to respect the rising triangle support line. The recent breakout and successful hold above support suggest that the move down was a fake breakdown rather than the start of a new bearish leg. From a structural perspective, the failure of sellers to push price back below support indicates weakening bearish momentum. The next key upside objective lies at the Resistance Zone around 73,000, which aligns with previous support-turned-resistance and the upper boundary of the prior structure. This level represents a logical TP1, where partial profits can be considered and where sellers may attempt to re-enter. A clean breakout and acceptance above 73,000 would confirm bullish continuation and open the door for further upside expansion.
However, if price fails to hold above the support zone and breaks decisively below the rising triangle support, the bullish scenario would be invalidated, and downside pressure could return. Until such a breakdown occurs, pullbacks toward support are viewed as corrective and potential buying opportunities rather than signals of renewed bearish continuation.
That’s the setup I’m tracking. Thank you for your attention, and always manage your risk.

BTC Elliott Wave IdeaSome nice fib interactions on BTC that make me think this move down is WXY
$80534 was the 1.618 extension for wave C in wave W
$97884 was the 0.382 retracement of wave W
The 1:1 extension for wave Y is at $52874 and there is a CME trading gap around $54000 from September 2024

Bitcoin Has a Reason to Jump to $80,000Bitcoin Has a Reason to Jump to $80,000
In previous posts we already discussed the $60,000 and $71,000 and $81,000 levels as key points for Bitcoin.
Clear support and resistance levels.
Now we see how Bitcoin after several drops has broken its initial downtrend and e stablished resistance at the $71,000 level. If it breaks to the upside we will likely head towards the $80k level to test that new resistance.
In the event of a breakout the Stop Loss must be very tight leaving a risk reward ratio of 3 to 4 times which is ideal.
Sometimes you do not need to overcomplicate things to trade.
👇 WANT MORE?
🚀 Hit the rocket, read my profile and follow so we can find each other again.

BTCUSD: 70K base breakout toward 80K🛠 Technical Analysis: On the H4 timeframe, BTCUSD remains in a broader bearish structure, but price is now stabilizing around the psychological 70,000 area. The chart shows consolidation in a tight range, suggesting sellers may be losing momentum after the sharp selloff. This 70K “fixation” acts as a short-term bullish factor, and the market is now building a base for a potential corrective rebound. The key trigger is a confirmed breakout above the upper consolidation boundary near 72,500–72,875, which would signal strength and open a move toward the next supply zone around 80,000–81,519. Keep in mind that the SMA 50/100/200 are still overhead, so this setup is treated as a recovery leg within a bearish trend. If price fails to hold the base and breaks below the local invalidation level, the probability of a deeper drop toward the next demand zone increases.
———————————————
❗️ Trade Parameters (BUY)
———————————————
➡️ Entry Point: 72,875.91 (buy on a confirmed breakout above 72,500)
🎯 Take Profit: 81,518.97
🔴 Stop Loss: 67,160.33
⚠️ Disclaimer: This is a potential trade idea based on current analysis; market conditions and price direction are subject to change based on news factors and volatility.

BTCUSD H1 Breakdown Risk | 68,600 Sell Toward 62,000 On the H1 timeframe, BTCUSD continues to show a bearish market structure. Although price briefly broke the short-term bearish trendline, the move failed to sustain. Price faced a clear rejection below the 200 DMA, confirming that higher levels are still being sold. The RSI around 37–40 indicates weak bullish momentum and supports the bearish continuation bias. Additionally, the Fixed Range Volume Profile (FRVP) high-volume area is being respected as a strong resistance zone, keeping selling pressure active.
Trade Setup
Sell Entry: 68,600
Stop Loss: 71,500 (Above 200 DMA and resistance zone)
Target: 62,000 (Previous demand zone / liquidity retest)
As long as price remains below the 200 DMA and FRVP resistance, the downside scenario remains valid, with a high probability of a retest toward the 62,000 level.
Disclaimer
This analysis is for educational and informational purposes only and does not constitute financial advice. Trading cryptocurrencies involves significant risk, and market conditions can change rapidly. Always conduct your own analysis and use proper risk management before entering any trade. The author is not responsible for any financial losses incurred.

Bitcoin - Starting the final -30% drop!🛟Bitcoin ( CRYPTO:BTCUSD ) is dropping another -30%:
🔎Analysis summary:
The underlying trend on Bitcoin remains clearly bullish. But following the unusual curve channel, Bitcoin perfectly rejected the upper resistance curve. Quite likely therefore that Bitcoin will now create another bullish break and retest and first drop -30%.
📝Levels to watch:
$55,000
SwingTraderPhil
SwingTrading.Simplified. | Investing.Simplified. | #LONGTERMVISION

BTCUSD — Structure FirstAfter the recent liquidation-driven sell-off, BITSTAMP:BTCUSD has entered a very different phase.
Momentum is gone, volatility has compressed, and price is no longer behaving like it did during the impulsive advance that preceded the correction.
From a structural point of view, this move looks less like the start of a new bearish trend and more like a reset within a broader cycle. Higher-timeframe supports are still holding, and instead of continuation to the downside, price has stabilized and begun to balance.
This type of behavior usually appears between phases, not at the beginning of a strong directional move.
From a fundamental perspective, the picture is equally mixed.
Liquidity conditions remain tight, rate expectations are still uncertain, and risk assets are highly sensitive to macro data and policy communication. At the same time, Bitcoin is no longer trading in isolation — ETF flows, institutional positioning, and broader market correlation are now part of the equation.
In this environment, extremes tend to be punished.
Price needs time to absorb information, reposition participants, and rebuild structure.
That is why, at this stage, structure matters more than narrative.
Key Levels
Major structural support: 65,000 – 68,000
This is the area that separates consolidation from continuation. As long as it holds, the broader structure remains constructive.
Current acceptance zone: ~70,000
Price is stabilizing here. Acceptance or rejection around this level will define the next leg.
First meaningful resistance: 78,000 – 80,000
A clear supply zone where reactions are likely.
Higher-timeframe supply: 90,000+
A reference level if the market successfully rebuilds bullish structure.
Trade Framework
Base case (balance / recovery):
Acceptance between 70k–72k favors a rotation toward 78k → 80k → 85k.
This scenario assumes continuation of consolidation and gradual structure rebuild.
Recovery continuation:
Sustained acceptance above 74k–75k opens the path toward 85k → 90k, suggesting renewed confidence and participation.
Bearish continuation:
A daily close below 68k would invalidate the balance and shift the focus toward 62k and 58k as next downside areas.
Bitcoin is not in a momentum phase right now.
It is in a decision-making phase, shaped by both technical structure and a complex macro backdrop.
The reaction around 68k, 70k, and 78k will be far more important than short-term headlines.
Until structure resolves, patience and level-based execution remain the edge.
Illyrian Finance — Trading structure, not predictions.
