BTC/USDT | Bitcoin Going Towards $94K or Will It Fall From Here?By analyzing the CRYPTOCAP:BTC chart on the daily timeframe, we can see that CRYPTOCAP:BTC followed our previous plan perfectly and after holding above the 81K demand zone it climbed back into the 91K area. The bullish structure remains fully intact and momentum is still on the buyers’ side. As long as BTC stays above the 81K to 85K support range I expect the next upside wave to target 94K first and then 97K and 102K in continuation.
Please support me with your likes and comments to motivate me to share more analysis with you and share your opinion about the possible trend of this chart with me !
Best Regards , Arman Shaban
Bitcoin (Cryptocurrency)

ETH/USDT | Ethereum Breaks 3000 and Momentum Still Points HigherCRYPTOCAP:ETH pushed all the way to 3000 and the bullish view is still fully intact. From the 2600 rebound to here the move has delivered more than 17 percent already and the structure still supports continuation. As long as ETH holds above the 2500 to 2700 demand zone the upside targets remain 3200, 3500, and 4000 in the next major leg. On the supply side the important zones sit at 3200 to 3300 and then 3500 to 3600 where price may slow down before the next breakout. For now momentum belongs to buyers.
Please support me with your likes and comments to motivate me to share more analysis with you and share your opinion about the possible trend of this chart with me !
Best Regards , Arman Shaban

BTC - Bulls Watching the Channel Support!📈Bitcoin remains overall bullish, trading cleanly inside its rising channel. Each dip toward the lower bound has acted as a strong springboard for the next impulsive move, showing clear demand from buyers.
⚔️As BTC approaches the lower trendline of the channel and the green demand zone, we will be looking for trend-following longs. This confluence area has held multiple times and continues to act as a key decision point for market structure.
🏹As long as BTC remains above this zone , the bullish scenario remains intact, and another push toward higher highs becomes the most likely outcome. Only a break below the demand zone would weaken the bullish outlook.
Now it’s all about the retest… will the bulls defend structure once again? 🤔
⚠️ Disclaimer: This is not financial advice. Always do your own research and manage risk properly.
📚 Stick to your trading plan regarding entries, risk, and management.
Good luck! 🍀
All Strategies Are Good; If Managed Properly!
~Richard Nasr

BTCUSDT (bitcoin) toward $91k?Hi!
BTC has finally broken its major descending trendline, signaling a shift in market sentiment after a long period of selling pressure. Following that break, price formed a clear inverse head and shoulders pattern, showing that buyers stepped in aggressively after the final liquidity sweep at the Head. Since then, BTC has been moving inside a well-defined ascending channel, consistently printing higher highs and higher lows, which confirms bullish momentum.
As long as price respects the lower boundary of this channel, the upside structure remains intact. The next significant resistance sits at 92,500–93,000, which also aligns with the previous breakdown zone you highlighted. This area is likely to attract sellers, making it a logical target for the current move.
Overall, the chart supports continued upside toward 93K, unless price breaks below channel support, which would weaken the bullish reversal setup.

BITcoin weekly bullish divergence emerges!Bitcoin has a 600%+ move since 2023. The crowd thinks Bitcoin doesn’t offer great returns anymore. Who wouldn’t want those returns? Expectations are broken. Wave 4 is underway.
Price is well within its normal volatility range, but bottoming signals are everywhere, though yet to be proven right. Wave (5) has a minimum target of the weekly R4 pivot at $233000.
Price is above the weekly 200EMA and tested the Pivot, which is bullish.
🎯 Terminal target for the business cycle could see prices $220000+
📈 Weekly RSI bearish divergence has played out, and now we have bullish divergence. Bitcoin RSI does not often reach oversold on the weekly.
👉 Analysis is invalidated below the weekly 200EMA- $66000
Safe trading

Understanding Discipline in TradingWelcome back everyone to another post. In today’s article we will dive deeper into the 3 keys of Trading success! As attached below.
Today we will be reviewing the Key “DISCIPLINE”
Just like risk management and Psychology this is also a difficult skill to maintain.
In the modern world it’s considered a skill now, because most of society doesn’t have any discipline in any field.
Let’s get started.
Definition:
When it comes to Trading Discipline. Trading Discipline means one user has the mental ability ( strength ) to follow their system. Their Trading Plan, risk management and maintain their psychology regardless of what events happen.
Trading Discipline separates profitable traders from the gamblers.
(Below I have attached the article Trader or Gambler as it relates to this post, make sure to give it a read!)
Discipline ensures that the user makes the right decisions based on strategy and logic instead of FOMO, ego and greed.
It is not just about following rules though. Discipline relates to the outside world of cultivating habits, mindsets and self-control too.
1) Understanding Trading Discipline
Firstly, you must truly grasp what it actually means. Most individual traders confuse it with stubbornness. They think it’s about holding on to trades or forcing a system. In reality, it’s only about consistency and self-control! Simple right?
Example:
Imagine, you have a system. A trading plan. It has the 1% rule where you don’t risk more than 1% of your account per trade. Understanding discipline means you must know why that rule is in place. It’s too protected your capital! Not breaking it after a few losses just to catch up.
Real Life Analogy:
A professional runner trains every day. They do it even when they are sad, tired, unhappy and unmotivated. This is discipline. Discipline drives long term results. Discipline is continuing it no matter what the current situation is.
2) Implementing Trading Discipline
The process of implementation is nothing complicated. It’s only turning knowledge into action. Knowing about it won’t do anything, you must maintain the effort of consistently applying it to each step in your system.
How to implement it:
- Follow your plan: Before each trading day starts, read out your system and tell yourself you will follow it. Even if no set ups appear, you will still succeed because you followed your plan.
- Set risk rules: Apply proper risk management and lot management so you don’t cave into fear. Apply the 1:3 Rule or 1:4 Rule.
- JOURNAL your TRADES Damn it: Record every trade, your reasoning, and whether you actually followed your rules. Don’t just add a screen shot and nothing else. YOU won’t succeed if you don’t journal your trades properly.
Example:
A novice trader may plan to place an entry when price is at $50 and exit at $55 with a 2% risk per trade. Even if it dips to price $48, they hold to the stop loss accepting the loss instead of moving it and hoping it “recovers”
Real Life analogy:
Think of it as budgeting every day, or for a holiday, or your next maccas run. You set a weekly budget plan and stick to it. Even when tempted by special deals, sticking to your budget allows for long term financial health to take place. Just like risk management but with real life.
3) Maintaining Trading Discipline
Discipline can’t act overnight, it’s the process of small steps working your way up to solid consistency over time. Even when feelings run high – discipline isn’t one time. It’s daily practice.
Some strategies are:
- Reviewing your previous trades daily or at the end of each week during a market close. Assess your wins and losses.
- Build up emotional awareness, be aware of what fear, greed and overconfident emotions take place.
- Reward yourself to the rules of your system, not just profitable outcomes.
If you reward yourself for not trading in one day because not a single set up appeared, you were still successful because you didn’t “force” a set up and take a gamble.
Example:
A trader might experience 3 losses in the first hour of the day, even if they were all A++ set ups. Instead of revenge trading, he sticks to his plan, accepts the L and leaves the charts for the rest of the day to reset mentally and gain a win in another field, eg – Gym.
Real-life analogy:
By maintaining a healthy lifestyle, you must apply the same approach. You don’t stop exercising after a few days off. Discipline keeps you aligned even when your motivation and mental strength fades.
4) Adapting without breaking your Discipline
Long story short, Markets move, Markets change, Markets can and WILL evolve.
Traders must adapt. Not just allows their system to adapt, but their psychological mindset of discipline.
Adapting can be confusing but it can be done by:
- Don’t switch up new strategies, adjust your current system slightly then back test and forward test it on demo accounts. Eg Paper trading.
- Update your trading system based on data and monthly results, not emotions.
- Avoid making sudden changes right after losses.
Example:
Let’s say a forex strat no longer works due to low volume and volatility. A strict trader tests adjustments in their demo accounts, then incorporates them into the plan after they have received positive data from tests.
Real-life analogy:
A chef might change his recipe based on a specific ingredient availability but will not ignore the core cooking principles. It’s about adapting strategically, not impulsively.
5) Reinforcing Discipline Through mindset and daily life.
Discipline in the trading field is just amplified by the discipline process outside of trading. It follows the exact same process. Daily habits and mindset directly impact one’s trading performance.
To reinforce discipline, you can:
- Maintain routines: Wake up at consistent times. Don’t wake up at 3:00am to “grind” if you do that, you’re stupid – you’ll burn yourself out and make the process harder.
Plan your day and review goals. Eg do a brain dump every morning, write down or type out all ideas, thoughts and emotions and sort it out.
- Practice mental training: People suggest doing personal journaling or meditation. Just go for a walk in the morning for 5 minutes. First thing in the morning, feel the fresh breeze, air, sunlight and nature. You simulate the mind and body in a natural way allowing for you to think clearly and train your mind.
- Change your environment: surround yourself with work dogs, people who are strict on routines, self-improvement, self-development, individuals who don’t slack off.
Example:
Traders who can control their time well, exercise, eat healthy can maintain their stress in trading better than one who does not focus on outside habits.
Real-life analogy:
A school student who studies consistently every day and night rather than squishing it all in before exams perform better. Just like a trader who can maintain structured habits inside and outside of the market.
Conclusion:
Trading discipline is more than following rules, it’s a mindset and a lifestyle, it relates to the world outside of trading. Just like psychology, if you can’t master it outside, you won’t master it inside.
It's about understanding your own weaknesses and adjusting the system to hold structured rules that will allow it to be more easily achievable for yourself.
Remember, trading is not sunshine and rainbows.
It’s about building a system and following it. It is the hardest way to make “ easy ” money.
To find out what the other 2 keys are, review the 3 posts below where I explain the 3 keys to trading success, and go deeper into each of them!

GBPAUD consolidating.GBPAUD taking a BUY position with confirmation from the bounce off SUPPORT and Price Action. It should keep rising going to NY session.

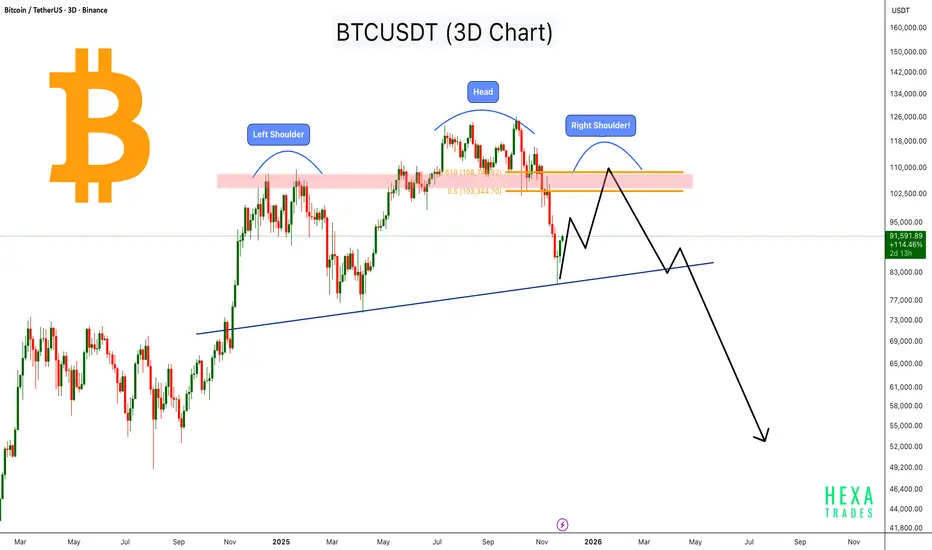
BTC Forming a Massive Head & Shoulders - Macro Reversal Ahead?Bitcoin is forming a large Head & Shoulders pattern on the 3-day chart, with the left shoulder and head already completed, and the right shoulder now developing within the major resistance zone around the 0.5–0.618 retracement (103,000–108,000).
Price recently bounced from the long-term ascending trendline, but the overall structure still suggests a potential macro reversal unless Bitcoin breaks above the resistance zone with strong momentum.
If the right shoulder completes and price rejects from the supply zone, BTC could retest the trendline again. A breakdown of this trendline may open the door for a deeper correction toward the lower demand zones.
This is a medium-term pattern and may take 1–3 months to validate fully.
Key Points:
- Left Shoulder, Head, and Right Shoulder zone highlighted
- Major resistance at $103,000–$108,000
- Price bouncing from long-term ascending trendline
- Breakdown below the trendline may trigger a strong downside move
- Right shoulder formation may take a few more weeks
Cheers
Hexa
Bitcoin is approaching an important support level (1D)Bitcoin has entered a strong bearish structure.
It is currently near an important origin zone that has broken significant highs (BOS). It is expected to make an upward reversal from this area.
It’s natural for this momentum to require some base-building, and since the movement is on the daily timeframe, the upward reversal may take some time.
The target range is 95K to 96K.
A daily candle closing below the invalidation level will invalidate this analysis
Do not enter the position without capital management and stop setting
Comment if you have any questions
thank you

BITCOIN BEARS ARE GAINING STRENGTH|SHORT
BITCOIN SIGNAL
Trade Direction: short
Entry Level: 91,634.79
Target Level: 81,942.62
Stop Loss: 98,078.49
RISK PROFILE
Risk level: medium
Suggested risk: 1%
Timeframe: 9h
Disclosure: I am part of Trade Nation's Influencer program and receive a monthly fee for using their TradingView charts in my analysis.
✅LIKE AND COMMENT MY IDEAS✅

BTCUSD: Buyers Preparing for a Move Toward $90,000Hello everyone, here is my breakdown of the current Bitcoin setup.
Market Analysis
BTCUSD continues to recover after a prolonged downtrend, where the market consistently respected the descending Trend Line and formed a series of Range structures. Each range acted as a consolidation phase inside the broader bearish movement, with multiple breakdowns continuing the trend to the downside. Despite occasional bullish breakouts, none of them were strong enough to reverse the bearish structure, leading to further declines. Eventually, price reached the Support Zone around $84,000–$85,000, where the market produced a fake breakdown, signaling initial buyer activity. This fake breakout formed a local bottom that became the base for a reversal attempt. Following this reaction, BTCUSD began forming an Upward Channel, marking a shift in market structure from bearish to early-stage bullish. Inside this channel, price has started to create higher highs and higher lows—an essential signal of growing bullish momentum. The structure remains clean and technical: every pullback respects the lower boundary of the channel, while short impulses are reaching toward the midline of the structure. Buyers are gradually gaining control.
Currently, BTCUSD is stabilizing above the Support Zone while trading near the lower half of the ascending channel. As long as price respects this channel structure, sentiment remains bullish. The key area ahead is the Resistance Zone around $90,000, which previously acted as a pivot point and rejected bullish attempts multiple times. A clean breakout above this zone would confirm broader bullish strength.
Scenario & Strategy
I expect BTCUSD to continue moving inside the Upward Channel, gradually approaching the $90,000 Resistance Zone. A retest of this area is the most probable outcome if buyers maintain control. Short-term corrections may occur as the price approaches resistance, but overall structure favors a bullish continuation. A confirmed breakout above $90,000 could trigger a stronger move toward higher targets, opening the way for a larger trend reversal. This level remains the key barrier for buyers in the short and medium term.
However, if BTCUSD breaks down from the Upward Channel and falls below the $84,000 Support Zone, the bullish scenario becomes invalid. Such a move would likely signal a deeper correction or a return to bearish conditions. For now, buying the dips within the channel remains the more favorable approach as long as the structure stays intact and buyers continue defending support.
That's the setup I'm tracking. Thank you for your attention, and always manage your risk.

WATCHING FOR BTC BEARISH MOMENTUM TRADESMorning folks,
As we said on Mon - we expect the bounce up to 91K area and here we are. Now, as daily downside momentum is rather strong, it is reasonably to suggest deep downside pullback, somewhere back to 84-85K area at least.
It could start either from 91K where we're now or 95K resistance. Chances are not bad. Since we're in the Holiday and coming to weekend, it is not needed to hurry up. Just sit on the hands and watch for signs. We need some bearish patterns around mentioned areas on intraday charts. Once we get it, we discuss bearish position taking.
Peace.

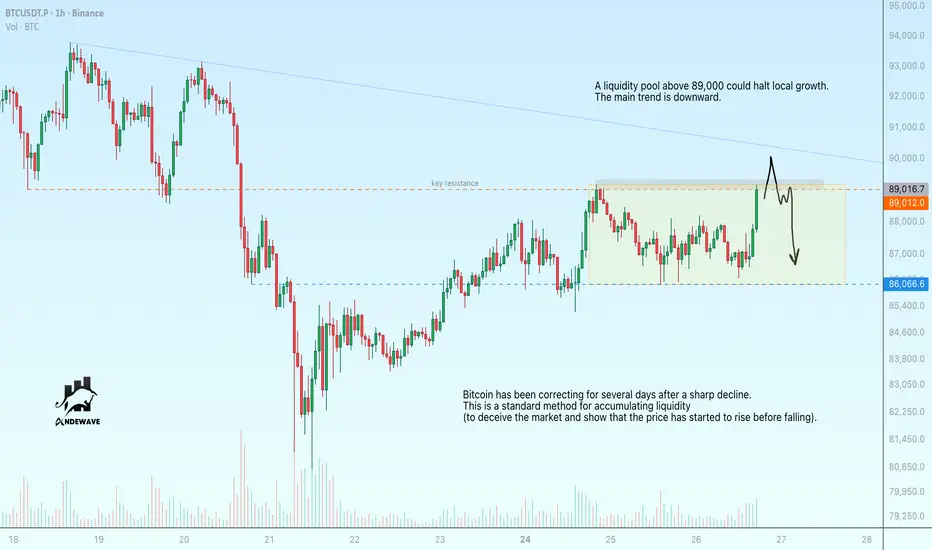
Bitcoin is testing 89,000. False breakout?Bitcoin is testing 89,000
A liquidity pool above 89,000 could halt local growth. The main trend is downward.
Bitcoin is undergoing a correction over several days after a sharp decline.
This is a standard tactic for accumulating liquidity (to deceive the market and show that the price has started to rise before falling).
A false breakout could reverse the local movement from upward to downward and send the price to 86K-83.5K
BTC Rebounds From 85K Support — Rally Toward 93K ResistanceHello traders! Let’s take a look at BTCUSD (Bitcoin). BTCUSD continues to trade within a broader corrective structure after a long bearish decline. Earlier, the market formed a large descending wedge, where price consistently respected both the Resistance Line and the Support Line. After the breakout from this wedge pattern, Bitcoin briefly turned bullish but soon entered a sideways Range, showing indecision and weakening momentum. The Range eventually broke to the downside, sending BTCUSD directly into the Seller Zone around $93,000, a key area that triggered several strong rejections in the past. A clean retest of this zone confirmed bearish pressure, leading to another impulsive drop. During the decline, price briefly pushed below the Support Zone near $85,000, creating a fake breakout, which trapped sellers and sparked a strong bullish reaction. From this point, buyers gained control and pushed price into a new ascending structure, supported by a rising Support Line shown on the chart. This indicates a shift in short-term momentum, with BTCUSD now forming higher highs and higher lows. Currently, Bitcoin is approaching the $93,000 Resistance Level, which aligns with the upper boundary of the previous Seller Zone. This is the key barrier for buyers. If price manages a clean breakout above this level, bullish continuation toward higher resistance zones becomes likely. As long as BTCUSD holds above the ascending Support Line and the $85,000 Support Area, the outlook remains bullish in the short term. From my perspective, BTCUSD is showing a short-term bullish continuation setup, supported by the ascending Support Line and the strong rejection from the $85,000 demand zone. If BTCUSD breaks back below $85,000, the bullish scenario becomes invalid, and a deeper correction could follow. For now, market structure supports a bullish recovery as long as buyers defend support and maintain the ascending trend. Please share this idea with your friends and click Boost 🚀

Is This the Beginning of a New Bull Cycle?Ladies and gentlemen, Bitcoin’s conditions have completely flipped, and if you don’t adapt to the new reality fast, you’re about to leave a lot of profit on the table.
In this analysis, we’re going to look at Bitcoin with zero bias, pure objectivity, and open positions together.
I’m Skeptic, founder of Skeptic Lab . If you want to take your long-term performance to the next level using real psychology, data, and strategy, you’re in the right place.
Let’s start with the daily timeframe 📉
it looks like the pullback is completing. Yesterday’s candle closed extremely bullish, and the odds of the next two daily candles also closing bullish are honestly pretty much. btw Anything upward from here on the daily is just lower highs and a pullback toward 100k. YES, the HWC (weekly) is still in an uptrend, but the daily IS NOT. That doesn’t mean we sit on our hands—we still take longs, but only in lower timeframes and with a completely different risk-management approach (explained below).
🔍 Drop to the 1H for the real triggers.
Yesterday our long trigger fired exactly as planned and gave us a clean +4.35% move (if you missed it, go check yesterday’s analysis). We’ve now reached 91,497.25 and the upper boundary of the 4H ascending channel. From here, two main scenarios: 📍
1. Break of support at 90,892.60 → continuation down to the channel midline, then retest of 88,118.70 support.
2. Break of resistance at 91,497.25 → entry into fresh bullish momentum that can carry us all the way to the next major resistance at 96,066.89 .
Key observation: LWC momentum is strongly bullish. Volume has spiked on the rise and dropped sharply on pullbacks and during consolidation, so the probability of breaking the top is higher right now.
Risk-management difference (this is critical):
- Longs are counter-trend to the daily MWC → we take profit faster and use tighter stops so we can reach target quickly before a single daily candle potentially wipes the whole move.
- Shorts would be with the MWC → we can afford wider risk and scale out with partials.
Volume is our final confirmation here: if we had rising price but decreasing volume on the push to the top → cancel orders. Same rule applies to shorts.
Yesterday, when price rose toward 88,118.70, volume exploded—that was our confirmation, and we entered long.
If this analysis helped you, I’d really appreciate a boost. It keeps the energy coming. 🩵
Now get outta here.

BTC Bounce Looks Corrective – Bottom Not In Yet1. Recap of My Last BTC Outlook (5 November)
In the 5th November analysis, I noted that the 106k support zone was under pressure, and if that level failed, the next meaningful target would be 90k — because 100k, despite being psychological, should not offer much after technical break.
That played out perfectly:
- 106k failed
- 100k offered nothing but a small rebound
- BTC dropped straight into the 90k zone
And then continued even deeper, almost touching 80k before rebounding
We’re now trading around 87,500, after a textbook corrective bounce.
2. Is the Bottom In?
➡️ In my opinion, no. Definitely not.
And here’s where I apply my usual contrarian filter:
Whenever I start hearing the same voices saying the same thing —
“Bitcoin bottom is in! Bitcoin up only!”
— I immediately become cautious.
These are the same people who never consider the other side of the market.
A broken compass can show the right direction once in a while, but it’s still broken.
3. Technical Picture – Nothing Bullish Here
- Yes, the bounce from 80k is normal and expected.
- Yes, BTC can easily retrace 10–15k after a large drop.
- But nothing in the current structure suggests a meaningful bottom.
What we have right now is:
- A classic corrective rebound
- Weak impulse
- No break back above of important resistance
- No reversal pattern
- No shift in market bias
It looks exactly like what price should do after a violent leg down — not like a new bull trend.
This is the type of rebound where retail screams “moon,” but professionals simply prepare for another sell.
4. My Outlook – Bearish Until BTC Reclaims 100k With Conviction
My plan is simple and level-driven:
Preferred Sell Zone:
- 92k → This is where I want to sell, ideally on a weak rally
Downside Targets:
- 80k → Recent low and first logical stop
- 75k → Major structural support and second target
Bearish outlook is invalidated ONLY if:
➡️ BTC reclaims 100k with conviction (not a wick, not a temporary spike)
Until that happens, every rally is a potential shorting opportunity.
5. Conclusion – Still Bearish, Despite the Bounce
BTC has done exactly what it was supposed to do:
- Drop to 90k
- Overshoot to 80k
- And bounce in a corrective manner
Nothing about this price action signals a bottom.
If anything, it signals more downside ahead — once the corrective rally into 92k completes.
Bias: Bearish
Approach: Sell rallies
Invalidation: Break and hold above 100k with conviction
Until then, the narrative “bitcoin up only” remains a meme, not analysis. ⚠️

Bitcoin Ready to Casually Liquidate $300MLadies and gentlemen, today is November 26. If you’re still alive in the market, let me be the first to congratulate you—because that means you actually use proper capital management and set stop losses.
In this analysis, we’re going to pinpoint Bitcoin’s next triggers together, get a crystal-clear picture of the current structure, conditions, and scenarios, and trade them side by side.
Hey, I’m Skeptic , and this is Skeptic Lab . If you want to level up your trading knowledge through data, psychology, and real strategy and actually become consistently profitable, you’ve come to the right place.
Let’s jump straight to the charts. 📉
In the daily timeframe , after that massive sell-off candle on November 21, Bitcoin immediately went into ranging mode. Volume dropped hard, and RSI bounced back above 30. After breaking 100k—as I’ve been saying for weeks—the MWC has officially turned bearish, so every bounce back to that zone is nothing more than a pullback. If this 4H correction we’ve started continues, it can easily reach 91,213.99 (the 0.5 Fib), so if you’re opening longs, your target should be exactly 91,213.99.
🔍Now let’s drop to the 4H timeframe to hunt for actual triggers.
In the 4H, we have a weak upward channel that’s really just the daily bearish correction. We’re ranging between two key levels:
- Resistance: 88,118.70
- Support: 86,224.62
Breaking either one is our long or short trigger.
But here’s the risk-management difference: 📍
For longs (which are counter-trend to the MWC), we use a very tight stop loss and take profit quickly.
For shorts, we can accept slightly higher risk and scale out with partial profits.
Important note: Throughout this entire range box, volume has been consistently dropping—this means the next move is getting closer and closer. Stay very alert inside this box.
If this analysis helped you, I’d really appreciate a boost—it gives me energy to keep going.🩵
Now get outta here.

BTCUSDT.P - November 27, 2025On the 15-minute chart for Bitcoin, price is in a strong short-term uptrend, marked by a steep series of higher highs and higher lows culminating in a parabolic push into local resistance around 91,800–92,300. The latest candles show upper wicks and a loss of follow-through, indicating fading bullish momentum and the risk of a pullback. A corrective move toward the nearest intraday support band around 89,700–90,100 would be a normal retracement within the broader advance, and aggressive longs may look to reduce risk while conservative traders wait for a reaction at that support zone before re-entering.

USDT.D: Smart Money Indicator for Bitcoin & Altcoin CyclesUSDT.D Dominance: The Hidden Cycle Behind Crypto Bull & Bear Markets (2021–2026)
The USDT.D dominance chart offers a clear window into the underlying market sentiment: when stablecoin dominance rises, the market tends to weaken, and when it falls, risk-on assets thrive.
From late 2021 , USDT.D saw a steady rise, signaling capital flowing out of risk assets . This climaxed in late 2022 , aligning with Bitcoin’s historic drop from $69k to $15k (~-74%).
Following this, USDT.D entered a downtrend and consolidated for over a year, a period that coincided with multiple altcoin bull runs , highlighting the inverse relationship between USDT.D and alt markets.
Recent months have shown breakout dynamics , as USDT.D reclaimed its long-term downtrend resistance. The market now faces a crucial retest around 5–5.1% , which could act as a springboard for the next major rally.
🔹 Market Implications:
Short-term: Bitcoin & Ethereum likely to see significant upward momentum during early 2026.
Mid-term: USDT.D may form a Bullish Cup & Handle , targeting 8–9% by late 2026 , signaling potential market corrections.
Key takeaway: Stablecoin dominance is a leading indicator —tracking its patterns can provide insight into market cycles, risk periods, and optimal entry/exit windows.
💡 Pro Tip: Always combine dominance analysis with price action and volume for better timing in crypto markets.

Bitcoin Extends Its Downward Pressure as Sellers Stay FirmBitcoin remains pinned under selling pressure as expectations for a potential Fed rate cut in December have yet to translate into real policy action. Although several Fed members have softened their tone, the current interest-rate environment continues to discourage capital inflows into risk assets, leaving BTC without a solid catalyst for a rebound.
Market liquidity is still weak, institutional flows show consistent outflows, and investor sentiment leans toward caution. With no strong driver to counter this defensive mood, Bitcoin continues to follow the broader risk-off trend.
Technically, the H4 chart preserves a bearish structure, defined by a sequence of lower highs and lower lows. Repeated red FVG zones overhead signal active selling pressure, while the Volume Profile reflects distribution rather than accumulation.
Given the alignment of macro signals and chart behavior, the downside remains the dominant scenario. The next key level is the 86,000 USD support area; a breakdown there would likely open the path toward 84,000 USD.

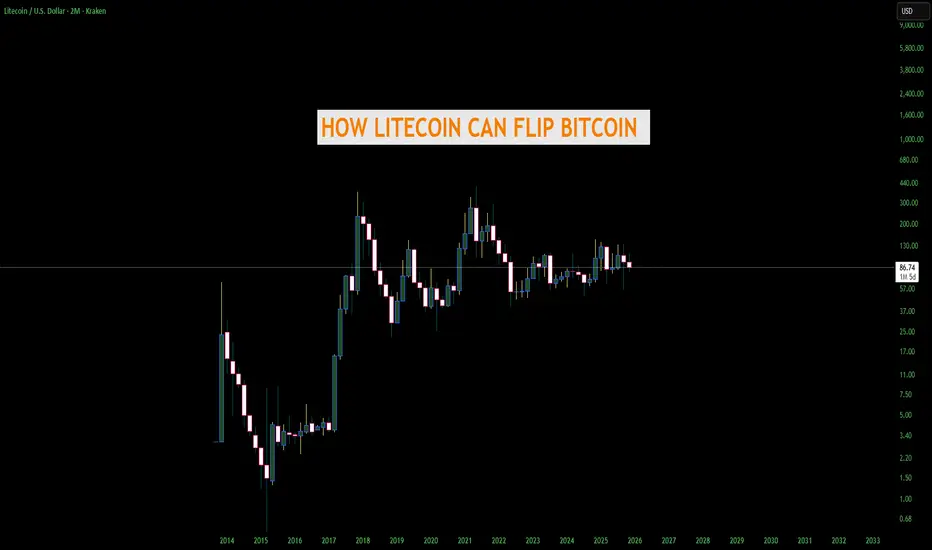
THE DAY LITECOIN FLIPS BITCOIN AND BECOMES #1 - AND HOWGrok helped me with this but regardless this is a great read. Not financial advice
1. Bitcoin fees explode again (> $50–$200 per transaction)
LTC stays under 5¢ and 4× faster → merchants & users flee to “digital silver” for actual payments
-Historical precedent: May 2017 & Dec 2017 fee madness → LTC pumped from $4 → $375 in weeks; repeated in May 2021 → $410 ATH
2. Bitcoin blocks stay full for months (Ordinals / Runes / BRC-20/ and now unlimited SPAM clog the chain again)
People rediscover Litecoin as the cheap, fast, on-chain alternative that actually works for daily spending
-Historical precedent: 2023–2024 Ordinals era → LTC quietly 3×–4× while BTC was practically unusable for small amounts
3. Major nation/state bans or heavily restricts Bitcoin mining or self-custody
LTC is smaller, less of a political target → miners add Scrypt rigs, capital rotates
-Historical precedent: China 2021 mining ban → Litecoin hashrate and price both spiked hard in the following months
4. A confirmed 51% attack or large double-spend actually happens on Bitcoin
Trust in BTC’s immutability shatters overnight → Litecoin (merged-mined with Dogecoin) suddenly has higher combined attack cost and looks safer
-Historical near-miss: 2018–2019 51% attack fears on smaller chains sent LTC up +150% in pure rotation plays
5. Credible quantum-break announcement or real progress scare (2026–2030 timeline moves up)
Litecoin’s MWEB addresses are already quantum-resistant + dev team can soft-fork faster than Bitcoin’s politics allow
-Historical precedent: 2023–2024 quantum FUD alone gave privacy coins and quantum-ready projects 3–10× pumps
6. Litecoin ETF (e.g., Canary Capital's) faces post-launch outflows or SEC-mandated tweaks due to BTC ETF dominance, while Bitcoin ETFs pull in record inflows
BTC ETFs become the unchallenged "institutional safe bet," capping BTC's retail upside → sidelined investors, retail traders, and altcoin funds rotate into the now-proven LTC ETF as the "next logical step" for legacy alts (with Canary/Grayscale already live and showing strong early volume)
-Historical precedent: ETH ETFs in 2024 saw initial outflows vs. BTC's inflows → ETH still 2–3×'ed on rotation; SOL's 2025 ETF launch pumped despite similar early teething issues
7. Lightning Network suffers major centralization scandals, hub failures, or routing collapses
People remember Charlie Lee’s original pitch: simple, fast, cheap, on-chain money with no layer-2 headaches
-Historical precedent: 2023–2025 Lightning UX complaints repeatedly drove spikes in LTC daily transaction volume and price
8. Bitcoin loses the “first-mover narrative” to a new nation-state adoption
Example: a major country (Brazil, Argentina, Indonesia, etc.) announces it will use Litecoin instead of Bitcoin for remittances or reserves because LTC is 4× faster and 100× cheaper.
-Precedent: El Salvador 2021 BTC adoption pumped Bitcoin; a “Litecoin country” would do the same or more for LTC.
9. PayPal, Venmo, Cash App, or Stripe re-activates Litecoin for instant zero-fee withdrawals/deposits
They all supported LTC years ago and dropped it only because of 2018 bear market. One click to flip it back on → instant 50–100 million new users.
-Precedent: PayPal adding BTC in 2020 → +300 % pump in weeks; LTC would explode harder because it’s actually usable on their rails.
10. Dogecoin merges fully with Litecoin (merged-mining → full auxiliary chain)
-Precedent: DOGE pumps in 2021 dragged LTC up 4–6× every single time. A real technical merger would be 10× stronger.
11. Major exchange or custodian loses billions in Bitcoin (think FTX 2.0 but only BTC exposed)
Users rush to self-custody the one big coin that still has sub-$0.01 fees and 2.5-minute confirmations → Litecoin.
-Precedent: FTX collapse 2022 → LTC was one of the only coins people could actually withdraw fast and cheap.
12. SEC or European regulator classifies Bitcoin as a “security” or “commodity with special rules” but explicitly says Litecoin is a commodity/currency
Institutions that were forced to sell BTC rotate the exact same thesis into LTC overnight.
-Precedent: XRP SEC case resolution in 2023 caused instant 3× pump; same mechanics.
13. Bitcoin Core development stalls or splits again (Blocksize Wars 2.0)
Big-blockers and users frustrated with ossification move money and hashrate to the chain that kept Charlie Lee’s original “faster, lighter” vision alive.
-Precedent: 2017 Bitcoin Cash hard fork → LTC price went parabolic as the “peaceful middle ground.”
14. Global remittance giants (Western Union, MoneyGram, Wise) quietly switch backend rails to Litecoin
They already tested LTC in 2017–2019. A single press release announcing “instant global transfers for pennies” using Litecoin would add billions in real volume.
-Precedent: Ripple/XRP partnerships in 2018 caused 10× pumps even when adoption was tiny. Real adoption would be insane for LTC.
Bulls Will Take BTC to 100k Then Become Leftover Turkey Dinner!Trading Fam,
First things first, Happy Thanksgiving to my U.S. followers. I hope your holiday is blessed as you enjoy time with friends and family.
Let's get to the chart.
As noted numerous times in previous posts, BTC is now in a longer-term bearish trend. There are many indicators that have shown us this.
Our first signs came when my indicator flashed a rare sell signal
This coincided with the third touch of our Pi Cycle Top Trendline
It also formed what I thought at the time might be the "spring" of our Wyckoff Market Cycle pattern
After these first three important indicators flashed, I waited for a drop below the support (RED descending TL) of our bearish megaphone pattern. That happened.
Finally, we almost synchronized that drop with the drop below our 350 SMA
I have a target down of 72-76k. We almost reached that but we were stopped by 80k support. That RED ascending TL prints on the weekly starting with one of our tops in April of 2021!
We bounced off of this trendline, using it as strong support. It should be and I expected this bounce! Now, I am expecting we should go to at least 100-102k. Even that is a very underwhelming target. I will NOT be impressed at all if the bulls should succeed at hitting it. This, at least, should be expected!
If we don't hit that target, I will be wrong about how bearish I should have been. Even the "Buy the Dip" Viagra being sold by all these whales as exit liquidity will not have worked for these bulls. What a disappointment they will have become! And my target of 72-76k will still be in play.
But you can all see that I have a question mark there. See, the thing is, what happens when Michael Saylor's Microstrategy goes underwater? Microstrategy owns nearly 650k BTC at an avg cost of 74.5k. Current strategy is: issue shares → raise debt → buy BTC → repeat. If BTC falls below 74.5k it could become: buy back shares → lower debt → sell BTC → repeat. If this occurs, BTC could drop even further. My next serious support is not found until around 46k! Therefore, we have to keep a serious eye on this area of 72-76k if we do in fact visit it.
Now, if bulls do beat 102k and then 110k after that, I think I can admit I was wrong. I missed my downside target by a whopping 4k! I will admit defeat even though I was a small fraction of a coin off. Honestly, I hope I am wrong. I hope the market is revived and Santa gives you all the profit you ever wanted for the Christmas season. But the grinch in me thinks not.
So, play this rally as you like. Personally, I think it's an early gift to some of you who were not expecting this or just didn't believe it would occur. You now have your second chance to exit. This is a contrarian view. I know. But think about who might be propagating the "Buy the Dip" memes. I alluded to it above. If I were a whale and wanted to exit without crashing the market how would I best do this? Ding, ding, ding. That's right. I'd market the hell out of "Buy the Dip". It would become the meme of the hour. Retail would buy it up and hopefully provide the exit liquidity I need. This might be my only way out if I were looking for it.
Something to think about.
✌️Stew

Bitcoin: Internal countermoveBitcoin currently appears to be forming an internal countermove within the ongoing orange wave a. Nevertheless, our primary outlook remains that this a-wave will ultimately extend into our green Target Zone, which ranges from $62,395 to $51,323. From this low, we expect another corrective move to the upside before the final downward leg of the wave (ii) correction—an overall pattern that has been developing since January—reaches completion.
