BTC at Double Channel Support — Next Impulse Loading?📉 BTC at Double Channel Support — Next Impulse Loading? 🎯
Bitcoin is currently testing a double channel confluence support near $100,211 , a level that’s been both technically and psychologically relevant across the 15m, 1H, and 4H views.
The left pane shows the descending red channel, where price just wicked below support and reclaimed — a signal we’ve seen in prior reversals.
The right pane highlights the broader blue/green support — creating a high-probability reaction zone.
🔹 Technical Support: $100,211
🔹 Local Resistance: $105,161 → $110,596
🔹 Major Target: $122,955 - $138,888 zone
The bullish case strengthens if BTC flips $105,161 on strong volume. But failure to hold $100K opens doors to $97,389 and $96,821 next.
Zooming out: this is a classic inflection zone — the reaction here could define BTC's next multi-thousand move.
🛠️ Smart traders aren't guessing — they’re preparing for both outcomes.
Trading Wisdom 📜
Inflection points > predictions.
In markets, it’s not about being right — it’s about being ready. If this is the bottom, let the chart prove it before the ego jumps in. 🎯
Disclaimer
Disclaimer: I’m just sharing wisdom, not instructions. No licenses, no guarantees — just years of trading scars and precision chartwork. Be smart, protect your capital, and don’t copy blindly. 138k remains my target for the year guys..let's see!
One Love,
The FXPROFESSOR 💙
A lot of people ask how I trade — truth is, it’s pretty simple. I have a daily budget, and I enjoy trading. I’ve moved away from getting married to altcoins, so you’ll notice I post less of them lately. But I still trade every day. I buy dips around key support/resistance levels and exit just below if invalidated. Sometimes it takes more than one attempt, but patience is part of the game. Yes, I use high leverage — that’s my style, and it keeps me engaged. The real secret? Take some profit when it works. That’s it. 💙
Bitcoin (Cryptocurrency)

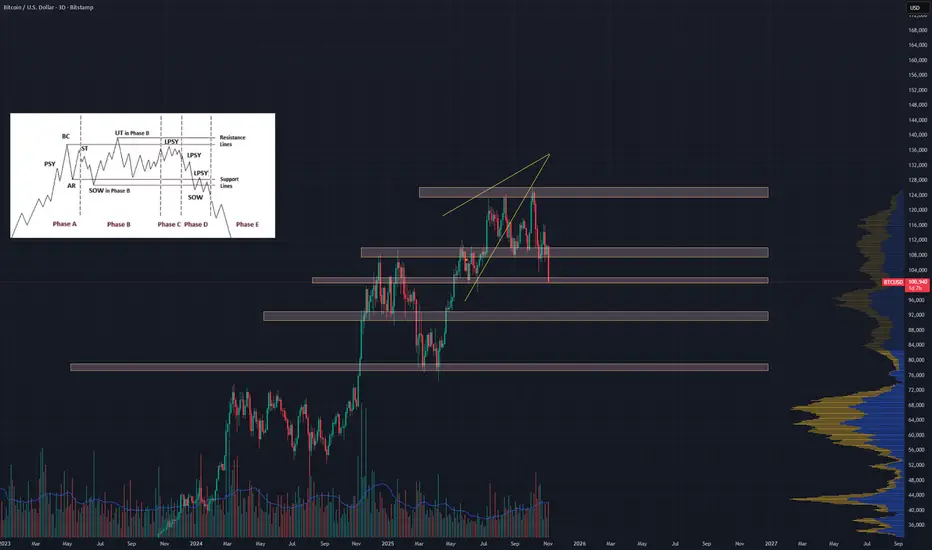
Another BTC Chart but created with PnF chartingThese drawings were made with a One Hour PnF chart for Bitcoin. Wyckoff distribution picture included for posterity.
Chart speaks for itself along with my last chart. Those Supply/Demand Zones will tell you a lot.
Bitcoin Tests $100K Support as Bearish Momentum AcceleratesBitcoin has come under renewed selling pressure, sliding sharply toward the key $100,000 psychological and structural support area. The price has now broken below the 50-day simple moving average (SMA) and is testing the 200-day SMA, signaling a significant test of trend integrity after months of consolidation between $100,000 and $123,000.
The 50-day SMA has turned lower, reflecting weakening medium-term momentum, while the 200-day SMA remains upward-sloping, maintaining the broader bullish framework. A daily close below the $100,000 support would represent a potential shift in long-term sentiment, whereas a rebound from this zone could keep Bitcoin within its established range.
Momentum indicators underscore the recent downside pressure: the MACD remains below its signal line, extending its bearish crossover, and the RSI has slipped to around 35, approaching oversold conditions last seen during earlier correction phases.
Overall, Bitcoin is at a pivotal juncture — the $100K region serves as both a technical and psychological inflection point that may determine whether the broader uptrend can reassert itself or give way to deeper consolidation.
-MW

BITCOIN (BTCUSD): Pullback From Key Support
Bitcoin is currently trading within a wide horizontal range on a daily.
We see a test of its support now.
There is a high chance that the price will bounce from that, following
a formation of a confirmed bullish imbalance candle.
Goal - 105170
❤️Please, support my work with like, thank you!❤️
I am part of Trade Nation's Influencer program and receive a monthly fee for using their TradingView charts in my analysis.

$BTC Probably nothing.CRYPTOCAP:BTC Probably nothing.
Bitcoin RSI is still above 50, which is a definite area for a reversal.
Furthermore, the MA25, VWMA and SMA 26 are still strongly supporting the price, just as they have in previous reversals.

TradeCityPro | Bitcoin Daily Analysis #210👋 Welcome to TradeCity Pro!
Let's dive into the Bitcoin analysis. The bearish movement of Bitcoin has begun, so it's best to analyze the market together.
⏳ 1-Hour Timeframe
On the 1-hour timeframe, Bitcoin is in a downtrend, and after breaking the 105,780 level yesterday, it continues its downward movement.
📈 The next low point the price reached was 104,488, which has also been broken, and the price is still moving downward.
💥 The RSI oscillator is at a very important support level around 30, and from both a momentum and candlestick perspective, we can say there is no weakness in the trend.
✨ Therefore, a break below the 30 level and into the oversold zone significantly increases the likelihood of a sharp downward move.
✔️ Currently, we don’t have a short trigger because the price has moved very sharply, and no specific trigger has been formed. However, once RSI enters the oversold zone, we can use candlestick setups for entries.
🎲 As long as the price doesn’t create a lower low and lower high below 104,488, I won’t consider the break of this level valid, and there’s a possibility of this bearish move being a fakeout.
🧮 If the price stabilizes above 105,780, it would confirm the fakeout. However, if the price stabilizes below 104,488, the next wave of the drop will begin.
❌ Disclaimer ❌
Trading futures is highly risky and dangerous. If you're not an expert, these triggers may not be suitable for you. You should first learn risk and capital management. You can also use the educational content from this channel.
Finally, these triggers reflect my personal opinions on price action, and the market may move completely against this analysis. So, do your own research before opening any position.

BITCOIN and stocks, 2021 vs 2025...Bitcoin (BTCUSD) could be entering a new Bear Cycle and as we've mentioned a few times recently, the 1W MA50 (blue trend-line) will play a big part at deciding that. This is basically the level that BTC is testing right now.
What may seem surprising to some, is that while Bitcoin has been correcting, the stock market (S&P500 illustrated by the black trend-line) has been rising making All Time High (ATH) after All Time High. This is not uncommon towards the end of Bull Cycles and has been particularly relevant during the Top of the previous (2021) Cycle.
As you can see, Bitcoin topped 7 weeks before stocks did, as we witnessed heavy profit taking and rotation of those (extraordinary) crypto gains towards stocks. Even the 1W RSI Lower Highs structure is similar between 2021 and 2025. The 4-year Cycle Theory in full confirmation (so far).
If the pattern plays out the exact same way time-wise as in 2021 (often it doesn't), we should be expecting stocks to top around the week of November 24. As for Bitcoin's trend after, following the 2022 blueprint wouldn't be unreasonable at all, as a 1W candle closing below the 1W MA50 would open the way to a 1W MA100 (green trend-line) test, multiple months of ranged price action between the two and then violent crash towards the 1M MA100 (red trend-line).
So do you think Bitcoin has topped and if yes, are stocks about to follow soon? Feel free to let us know in the comments section below!
-------------------------------------------------------------------------------
** Please LIKE 👍, FOLLOW ✅, SHARE 🙌 and COMMENT ✍ if you enjoy this idea! Also share your ideas and charts in the comments section below! This is best way to keep it relevant, support us, keep the content here free and allow the idea to reach as many people as possible. **
-------------------------------------------------------------------------------
💸💸💸💸💸💸
👇 👇 👇 👇 👇 👇

BTCUSD Long: Buyers Defend Demand Zone, Targeting $110,400 MoveHello traders! Bitcoin (BTCUSD) is currently trading within a key structural zone, showing signs of balance between demand and supply after a volatile move. Following the previous sell-off from the $116,000 Supply Area, the price found strong buying pressure near the $106,500 Demand Zone, which coincides with the ascending Demand Line that has been acting as dynamic support for several weeks.
After multiple rejections from the Supply Line, BTC has recently formed a fresh pivot low at the Demand Line — an area that has historically triggered bullish reactions. This reaction zone is particularly significant because it aligns with a confluence of horizontal and diagonal support, increasing the probability of a bounce scenario.
In the short term, I’m watching for a potential bullish rebound from the $106,500–$107,000 zone. A confirmed bounce with strong bullish candles could trigger a move toward the next pivot resistance around $110,400, which sits near the descending Supply Line. This would be the first major target for any short-term long positions.However, if buyers fail to sustain above the Demand Line, a breakdown below $106,000 would invalidate the bullish setup and potentially open the path for a deeper correction toward the next support levels. For now, the most probable scenario suggests a technical rebound toward $110,400, as long as the Demand Line continues to hold. I’ll be watching for confirmation signals such as higher lows or bullish breakouts to enter a long position. Manage your risk!

Bitcoin at the Brink: Breakdown or Breakout?Bitcoin is on the edge of a cliff . If this channel breaks downward, Bitcoin could fall below $100,000. But if the price respects this PRZ (Potential Reversal Zone), we can expect a solid rally toward $111,000, then $117,000, and eventually $125,000.
What do you think—will Bitcoin fall or rise?

USDT Dominance - Wyckoff AccumulationCRYPTOCAP:USDT.D could be mirroring Tesla’s 2022–2024 Wyckoff structure. From 2022 to late 2024, NASDAQ:TSLA formed a clear Wyckoff Accumulation on the weekly chart: a Selling Climax set the range, an Automatic Rally confirmed resistance, and a brief Spring in early 2023 shook out bears before prices recovered on strong volume. The stock then established a Last Point of Support, followed by a Sign of Strength breakout in late 2024, signaling institutional accumulation and the start of a new uptrend.

BTCUSD: A bullish channel might be formedHello Traders!
Considering the next few days, we might see a buy opportunity for the king of the Cryptos!
General long-term is bullish,
Mid-term is bearish,
we are around a zone,
a week bearish trend seen breakable.
We would trade the possible channel after reaching the activation line.
If SL hit before the activation line, we'll cancel the trade .

Solana, more down side to see? SOLUSDT / 1D
Hello Traders, welcome back to another market breakdown.
SOLANA is currently trading within a down trend, maintaining a bearish structure. I'll be looking for a short pull-back higher to get a position.
If the pullback holds and sell mode confirms, the next leg higher could target new lows.
Stay disciplined, wait for the market to come to you, and trade with confidence!
Trade safely,
Trader Leo.

BITCOIN Will Go Down! Sell!
Please, check our technical outlook for BITCOIN.
Time Frame: 3h
Current Trend: Bearish
Sentiment: Overbought (based on 7-period RSI)
Forecast: Bearish
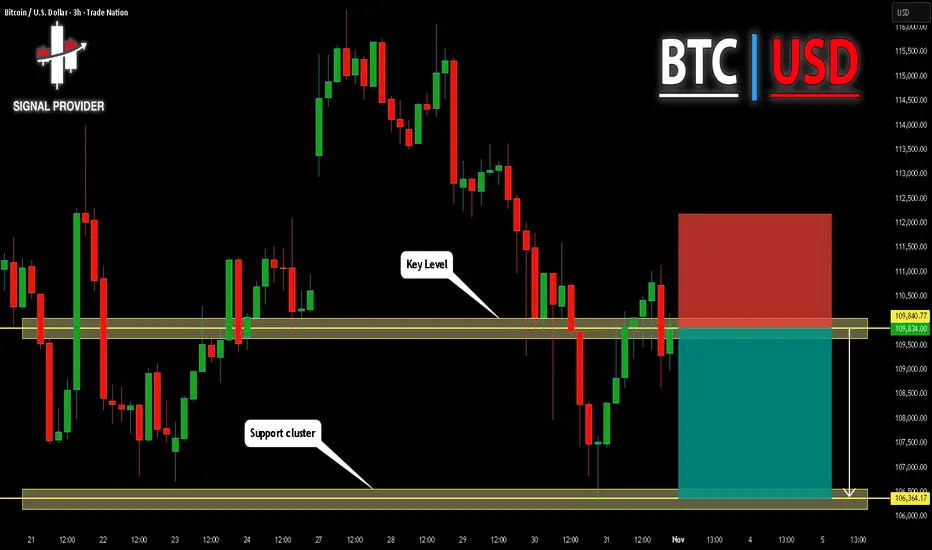
The market is trading around a solid horizontal structure 109,840.77.
The above observations make me that the market will inevitably achieve 106,364.17 level.
P.S
The term oversold refers to a condition where an asset has traded lower in price and has the potential for a price bounce.
Overbought refers to market scenarios where the instrument is traded considerably higher than its fair value. Overvaluation is caused by market sentiments when there is positive news.
Like and subscribe and comment my ideas if you enjoy them!

BTCUSD Q1 2026 Analysis: Bullish TrendBTCUSD potentially going down to USD 97,000 before going up to USD 149,000 on May 2026
by Jaysen Xavero
-Fibomic

Bitcoin BullishThis crypto has been bearish for the past few days, and has reached a POI, 1 H our demand Zone.
I anticipate a slight bullish pullback towards the 109 - 110k supply Zone.

Bitcoin’s price is at one of its most critical moments yet!👋🏻 Hey everyone! Hope you’re doing great! Welcome to SatoshiFrame channel.
✨ Today we’re diving into the 4-Hour Bitcoin analysis. Stay tuned and follow along!
👀 On the 1-hour timeframe of Bitcoin, we can observe that after failing to break above its key resistance zone, BTC moved toward the multi-timeframe lows. Losing those lows created a selling pressure, pushing the price to retest its fundamental support levels. Currently, I’ve identified two critical zones in my analysis — a breakout from either one could provide a solid trading opportunity.
⌛ Bitcoin’s volume shows a strong bias toward sell positions, to the point where buyers are barely preventing the higher timeframes from entering oversold conditions. However, if this selling pressure and volume persist, Bitcoin could break the lower boundary of its recent daily range and continue downward. Volume data gives us the best insight into market behavior, allowing us to build effective scenarios.
✍️ There are two potential scenarios for Bitcoin that I’ll briefly summarize below — both can be used as setups for positioning.
🟢 Long Scenario: If Bitcoin breaks above the resistance zone at $108,072, completes a pullback, and shows an increase in buying volume with momentum entering the market, we can open a long position. This setup looks somewhat risky, so it’s better to enter with a smaller position size. The best trigger for a long entry is located around $111,180.
🔴 Short Scenario: If Bitcoin breaks below the key support level at $105,732, it could offer a short position setup — provided that selling pressure and bearish momentum continue. After the breakdown, we’ll need to wait for a pullback before entering the trade.
❤️ Disclaimer : This analysis is purely based on my personal opinion and I only trade if the stated triggers are activated .

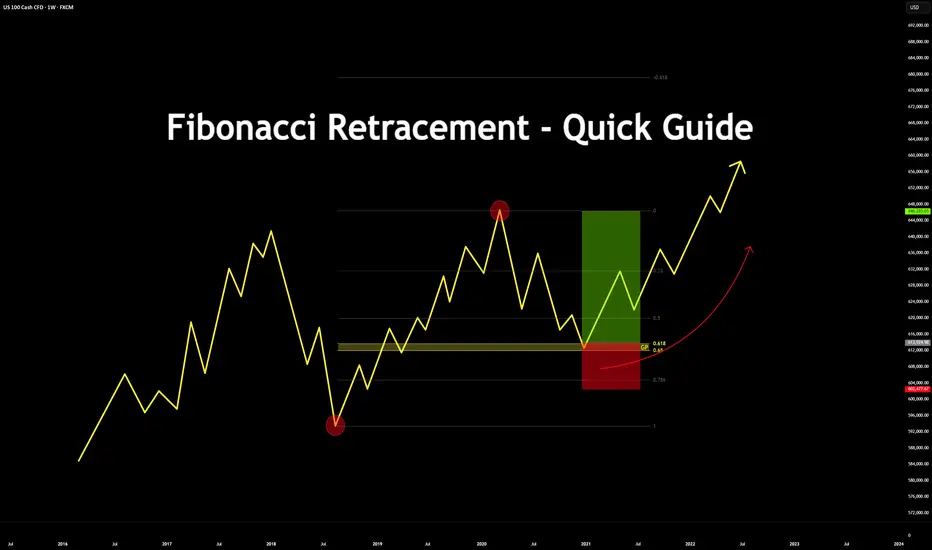
Fibonacci Retracement - Quick Guide in 5 StepsTrading the Fibonacci Retracement - Quick Guide in 5 Steps.
What is the Fibonacci tool?
The Fib Retracement Tool is a tool used widely across many charts. From crypto to stocks.
It assists in identifying the Golden Pocket, along with any potential Support and Resistance zones based on the sequence in Fibonacci.
Investors & Traders draw it from a previous high/low or low/high.
On a chart, each key level shows where price might pause or reverse during a pull back, before it continues the trend.
In this guide you will learn how to use the Fibonacci tool in 5 steps.
1. Configurations
Open up your Fib Retracement Tool's settings, apply the below configurations.
(You can change the color to your choice)
2. Identify High/Low's
Identify, recent highs and lows of your current chart/pair.
3. Applying Fib Retracement
Select your Fib Retracement tool. Place it on your chart starting from the swing low to the swing high.
4. Once completed
Highlight the Golden Pocket Field in the zone (0.65-0.618)
5. Review Entry
Price will eventually make it's way back down to the Golden Pocket to retest and reverse.
SL Placement would be on a previous low or key level, TP placement would be at a previous high or key level.
Bonus:
See the real time example below:
Please like, comment and follow if this guide was useful to you.
If you have any requests on analysis or tutorial requests, let me know and I'll be happy to make one!
Bitcoin Peaked Oct 6th, 2025Here is another perspective to add to my last publishing. The MACD is Diverging in a downward trend in comparison with the current Bitcoin upward price trend. As a long term Bitcoin investor I do not like the way things are lining up with Bitcoin. We are looking at another 2014 style crash in Bitcoin. Expect a 75-90% drop extending into 2026. Short positions are the play in the coming weeks/months and eventually look at cost averaging long positions again sometime in 2026/2027 for the next waves higher.

Bitcoin Peaked Oct 6th 2025My opinion only. I believe Bitcoin has made its final peak Oct 6th. Get ready for a massive drop leading into 2026.

$BTC BEARISH CROSS on the 20 / 200 DMA We had a similar setup at the end of September of 2021 where CRYPTOCAP:BTC then rallied a week later ~75% over the next few weeks.
However, every other time this bearish cross occurred in the past, ₿itcoin has spent at least a couple months trying to reclaim the 200DMA.
Currently PA has closed the Day below the 200DMA.
Bulls CANNOT afford a Weekly close below $106k, which is well outside the DANGER ZONE and .382 Fib
GOOD NEWS: An Inverse Head & Shoulders pattern has formed.
Bulls need some big volume days to come reverse the localized downtrend ASAP.
If not, the 50WMA will be tested ~$103k.
If that happens, Bulls must not show any weakness nor allow Weekly Closes below it.

Example of a Trading Style
Hello?
Hello, fellow traders.
Follow me to get the latest information quickly.
Have a great day.
-------------------------------------
While it's ideal to always close a trade in profit, this isn't always the case.
Therefore, you should maintain your trade by locking in profits through fractional trading.
Based on the trading information provided by the exchange, once a trade has turned into a loss, it's likely to take a considerable amount of time to turn into a profit again.
Therefore, you should trade at different buy and sell prices.
However, this is a rather tedious process, so it's not usually done that way.
-
If you were to buy near the area shown on the chart, the estimated average purchase price would be significantly higher than the current price.
Therefore, you wouldn't be able to proceed with the trade.
Therefore, we must trade by purchase price.
The purchase prices for positions 1 and 2 are quite high, so we don't pay attention to them.
Since the current price is near the purchase price for position 3, if it turns into a profit, you can sell the amount you purchased near position 3 to lock in the profit.
By subtracting this profit from the purchase price for positions 1 and 2, you can minimize your losses.
This trading method is possible because the coin market allows trading in decimals.
The key here is to trade by purchase price.
You should not trade in units of the number of coins you purchased.
For example, if you purchased $100 at point 3 (106431.68), you should sell $100 when the price rises.
Trading this way will allow you to quickly recover from losses and even generate profits even during losses.
-
You can profit whenever volatility occurs, regardless of whether the asset (coin or token) you're trading is in a loss or a profit.
You should avoid increasing the number of assets (coins or tokens) you're trading without managing them.
------------------------------------------------
To do this,
1. Mark support and resistance points on the 1M, 1W, and 1D charts.
2. Develop a basic trading strategy using these support and resistance points.
3. Avoid greed and execute split trades according to your trading strategy.
-
Thank you for reading to the end. I wish you successful trading.
--------------------------------------------------

Volatility Period: Up to November 10th
Hello, traders!
Follow us to get the latest information quickly.
Have a great day!
-------------------------------------
(BTCUSDT 1D chart)
This volatility period is expected to last from November 3rd to 9th.
First, we need to check the movement between November 3rd and 5th.
While the key question is whether the price can rise after finding support at the important support and resistance level of 104463.99-108353.0, it's crucial to check for support around 106431.68 within that range.
This is because the 106431.68 point is the DOM(-60) level.
-
The DOM indicator is a comprehensive evaluation of the DMI, OBV, and MOMENTUM indicators.
DOM(-60) indicates that all three indicators have reached their lows.
Therefore, support is necessary to confirm the possibility of a bullish reversal.
If the price rises after the DOM(-60) indicator first appears and then touches the DOM(-60) indicator again, it is highly likely that the price will fall without finding support.
If the price rises after finding support at the DOM(-60) indicator, it should follow a period of sideways movement to confirm support.
-
Therefore, what we can do now is take the time to determine which direction the price deviates from the 106431.68-108353.0 range and where it encounters support and resistance.
You need your own basic trading strategy to execute your trades.
No one else can do this for you.
This is because you need to tailor your trading strategy to your investment style to avoid regrets.
My basic trading strategy is to buy in the DOM(-60) ~ HA-Low range and sell in the HA-High ~ DOM(60) range.
However, if the price rises in the HA-High ~ DOM(60) range, a step-up trend is likely, while if the price falls in the DOM(-60) ~ HA-Low range, a step-down trend is likely.
Therefore, a split trading strategy is required.
-
The formation of the DOM(-60) indicator indicates a buying opportunity. However, as previously mentioned, this is the second time the indicator has fallen below the DOM(-60) level since its formation, increasing the likelihood of further declines.
If the price falls below 104463.99 and continues to decline, it is expected to meet the M-Signal indicator on the 1M chart and re-establish the trend.
At this point, the key area to consider is support, particularly around the left Fibonacci level of 2.618 (87814.27) to the left Fibonacci level of 3.14 (93570.28).
If the price declines and a new HA-Low indicator is formed, support around that level is crucial.
-
You can profit by trading whether the price is in an uptrend or a downtrend.
However, the trading period may vary depending on the trend.
Therefore, you should check the flow of funds and determine whether trading is possible based on the support and resistance levels currently established.
To continue the uptrend by breaking above a key point or range,
1. The StochRSI indicator must be trending upward. If possible, it should not have entered an overbought zone.
2. The TC (Trend Check) indicator must be trending upward. If possible, it should remain above the zero level.
3. The On-By-Sign-Operative (OBV) indicator must be trending upward. If possible, it should remain above the High Line.
When all three indicators above are met, an uptrend is highly likely.
Currently, the On-By-Sign-Operative (OBV) indicator is located near the Low Line, following the EMA 3 > EMA 2 > EMA 1 > OBV.
Therefore, we can see that selling pressure is dominant.
However, since it's located near the HA-Low indicator, you should pay close attention to the situation.
If it finds support in the DOM(-60) ~ HA-Low range according to the basic trading strategy, it's a good time to buy.
-
Thank you for reading to the end.
I wish you successful trading.
--------------------------------------------------
- Here's an explanation of the big picture.
(3-year bull market, 1-year bear market pattern)
I'll explain more in detail when the bear market begins.
------------------------------------------------------
