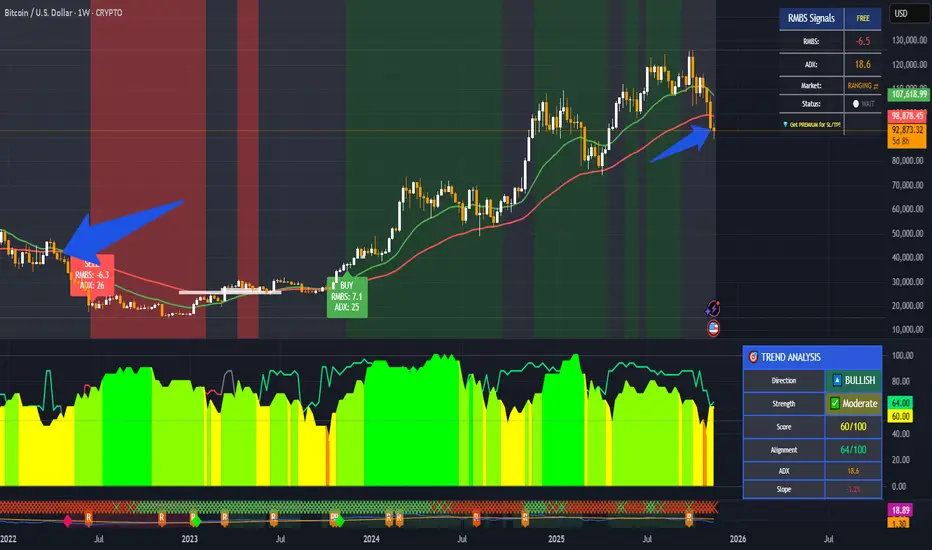
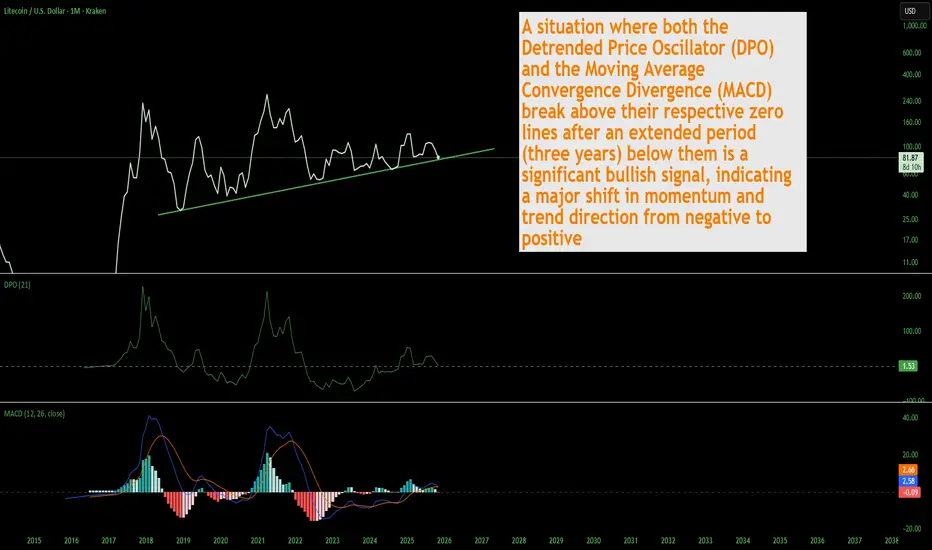
LTC Litecoin Poised For Something Big Macro Style I still see lots of people selling and capitulating. Thats ok that cant be prevented, most have no idea how markets work and those same people are afraid of their own shadow. The capitulation is almost over. I just want to point out the confluence of various indicators on the macro long term time frame pointing to a massive bull run for Litecoin. This is not financial advice just my opinion. Like and follow for more updates.
Bitcoin (Cryptocurrency)
BTCUSDT Market Analysis UpdateHi everyone, I hope you are doing well and I have put my opinion in Bitcoin price on the chart for you. and hope this helps you! Simple, concise, useful
BTC is still trading within a clear bullish market structure, supported by strong HL formations and trendline confluence. At the moment, my main focus is on the Fair Value Gap (FVG) below current price. I expect BTC to revisit this imbalance before continuing the move upward.
The liquidity pool around 82,490 is also important. Personally, I don’t expect price to sweep that level immediately. However, if it does get taken, in my view it would likely serve as the final liquidity grab before resuming the broader uptrend. This makes 82,490 a key level to watch — either it remains untouched while we push higher, or if price sweeps it, the move could act as fuel for the next bullish leg.
From a higher timeframe perspective, the market remains bullish. The structure is intact, RSI is holding mid-range without major bearish divergence, and trendline support has not been broken. Volume also supports this idea — it’s decreasing and showing divergence, but this doesn’t signal a reversal, only a healthy consolidation while holding the bullish trend.
In summary:
Main target: fill the nearby FVG before continuation.
Key liquidity zone: 82,490 (less likely to be taken now, but if it happens, I consider it the last liquidity grab).
Bias: still bullish, expecting higher levels once short-term imbalances are resolved.
Weekly:
As long as BTC holds its HLs and respect the FVG zone, I continue to look for upside continuation — potentially well beyond current levels.
That’s my current view on BTC. Let me know your opinion below 👇
Best regards

Saylor’s Master Plan at Risk? MSCI Drops the HammerMSCI May Exclude Crypto-Heavy Companies: What It Means for MicroStrategy and the Market
MSCI recently published a proposal that could dramatically reshape how global indices treat companies with large crypto exposure.
According to the framework, companies holding more than 50% of their market capitalization in digital assets may be excluded from national and international indices.
This sounds technical - but the consequences are huge.
What This Means in Practice
If the rule is implemented, companies like MicroStrategy, Bitfarms, Marathon, Hut8, Coinbase, or any firm holding a large percentage of crypto on their balance sheet, may:
be excluded from major indices,
lose exposure to institutional investors,
be off-limits for pension funds, insurers and conservative hedge funds,
face reduced liquidity and forced selling.
This is not a small development.
This is a structural shift.
🧩 Why MicroStrategy Is the Most Exposed
MicroStrategy’s business model has been extremely straightforward:
issue new shares
raise debt (including convertible notes)
use the proceeds to buy Bitcoin
rising BTC → rising MSTR
rising MSTR → more borrowing capacity
A perpetual loop.
But if MSTR gets excluded from key indices, the loop breaks:
passive funds must sell
institutional investors face compliance risk
liquidity dries up
volatility increases
borrowing costs rise
And remember:
MicroStrategy currently trades below the fair value of its Bitcoin holdings.
A forced outflow amplifies the structural imbalance.
⚠️ Why Institutions Bought MicroStrategy Instead of Bitcoin
Many funds legally cannot buy Bitcoin.
They also cannot buy high-risk crypto exchange stocks like Coinbase.
But they can buy:
reputable corporate debt
convertible notes
equity from a listed U.S. corporation
Michael Saylor gave them a regulatory loophole:
“Want Bitcoin exposure? Buy my convertible debt.
If BTC rises, convert the notes into shares.”
This workaround is now cracking.
Convertible Debt Holders Are in a Tough Spot
If MSTR is excluded from indices:
index funds sell → share price drops
falling price → convertible notes lose value
institutions holding the debt face losses
the balance sheet risk increases
This is why regulatory decisions matter so much.
Insider Selling: VP of Bitcoin at MicroStrategy Sells ~$19.7M Worth of Stock
The timing is… interesting.
Started selling on September 18
Sold options-based shares in multiple lots
Continued selling until November 14
Total realized profit: ~$19.69M
Selling into regulatory uncertainty is not random behavior.
It’s a signal.
Key Takeaways
1. MSCI’s proposal changes the rules:
companies with >50% crypto exposure may become “non-indexable”.
2. MicroStrategy’s core model—borrowing to buy BTC—depends on institutional inflows.
Index exclusion disrupts it.
3. Convertible note investors may face severe pressure.
4. Insider selling suggests internal awareness of structural risk.
5. If MSTR is removed from indices, forced selling could create significant downside pressure.
📉 Conclusion
MicroStrategy has long been a “Bitcoin ETF before ETFs existed”.
Institutions bought MSTR because they couldn’t buy BTC directly.
But now:
Bitcoin ETFs exist,
regulations are tightening,
index providers are updating risk frameworks.
MicroStrategy may become a victim of its own success strategy.
Best regards EXCAVO

The final stage for BTC Just what if....hard to adjust by timing! Because macro to much affect the sp500/ gold and crypto. But just an idea
Probably global plan about 139k like a top for Bitcoin still relevant in October / November BYBIT:BTCUSDT.P

BTC Monthly MACD Turns Bearish - Major Correction Ahead?Bitcoin has printed a bearish MACD crossover on the monthly timeframe, a signal that has historically aligned with the start of major market corrections. This pattern appeared during the 2018 top, again near the 2022 macro peak, and the chart now shows a similar bearish crossover forming once more.
Each previous monthly MACD bearish crossover occurred after a prolonged rally and was followed by a multi-month downtrend. The current crossover resembles those same market conditions, suggesting that BTC may be entering a deeper corrective phase if history repeats.
Key Highlights
- Monthly MACD bearish crossover, historically signals macro trend reversals.
-Similar crossovers occurred before the 2018 and 2022 bear markets.
-Strong rejection candle near major resistance aligns with previous cycle tops.
- Momentum weakening after an extended rally suggests potential for further downside.
- Monthly timeframe signals carry high weight and can drive long-term market direction.
Cheers
Hexa

Bitcoin Toxic Flows! We need to find balance. After the violent & toxic order flow selling this week on CRYPTOCAP:BTC spot holders in pain, but as traders we have a few key levels to observe. READ PREVIOUS POST ^ for dates & timing. We have major weekly level at 75k & yOPEN 93.5k.
The cleanest outcome is to auction price with organic flows, how does the market find balance? We range. This can come from a squeeze up 1st to test the 93.5k supply or rip the band aid off & give us 75k test. From there? we simply need to observe all flows with zero bias as mercenary sharp shooting traders.
80K is well supported for now. 1.49billion aggregated. But as we have seen this week, key levels breaking one after another. Either way, I would enjoy a range here, why? it simply makes for better trading.
Have a great weekend all!
A new look at previous logarithmic channelWith the trendlines of this channel slightly shifted we can see that it is possible that priceaction has already tested the top trendline of the channel. However in my previous version of this idea which I will try to post below it hasn’t connected with the top trendline yet. Would make more sense for it to be having the rejection it is having if it has already retested this top trendline though so I decided to post this version of the chart too so I can keep an eye on both. Even if somehow this does signal some sort of top it looks like we have very strong support on the next trendline just below the current one which should have the monthly 50ma double reinforcing its support in the very near future. SOo in that case that 50k zone there should hold strong support,but hopefully this is So another correction and not the top in which case the current trendline we have just retested will hold support. *not financial advice*
BITCOIN BULLISH BIAS RIGHT NOW| LONG
BITCOIN SIGNAL
Trade Direction: long
Entry Level: 84,546.32
Target Level: 101,066.22
Stop Loss: 73,559.02
RISK PROFILE
Risk level: medium
Suggested risk: 1%
Timeframe: 1D
Disclosure: I am part of Trade Nation's Influencer program and receive a monthly fee for using their TradingView charts in my analysis.
✅LIKE AND COMMENT MY IDEAS✅

Ethereum Slides Deeper as Price Moves Toward 2,750 SupportHello everyone, Ethereum is facing a rather uncomfortable decline after its attempt to recover from the 3,000 USD region failed completely. The price is now hovering around 2,790 USD — the lowest level in over 10 days — and is trading firmly below the Ichimoku cloud, a familiar signal that sellers are still dominating the market.
Observing the price structure on the 4H chart, I see ETH repeatedly leaving red FVGs above, stretching from the 3,000 to 3,200 USD zone. This clearly shows one thing: every recent bounce has been quickly sold off. The market is showing a clear “sell the rally” sentiment, making the short-term downtrend smooth and consistent.
Ethereum is now sliding toward the 2,750 USD zone — a key support area that held price quite well in early November. This is also where liquidity thickens, a region where the market often reacts. But if this level is broken cleanly, the decline could extend toward 2,700–2,650 USD, right at the high-liquidity region and strong support on the D1 timeframe.
News flow also isn’t helping crypto at the moment. The USD is strengthening after September’s jobs report came in far above expectations, raising concerns that the Fed may not cut rates anytime soon. When the dollar becomes more attractive, capital tends to move away from risk assets — and crypto feels the pressure directly. Meanwhile, US equities are recovering strongly thanks to Big Tech and AI stocks, drawing speculative flows away from major coins like ETH.
From my perspective, the highest-probability scenario is that Ethereum continues dropping toward 2,750 USD to test demand. If this area fails to generate a strong enough reaction, price could easily extend lower toward 2,700 USD — a zone where technical buyers may become more active.
What do you think — will Ethereum defend 2,750 USD successfully, or will it need to drop further before recovering?

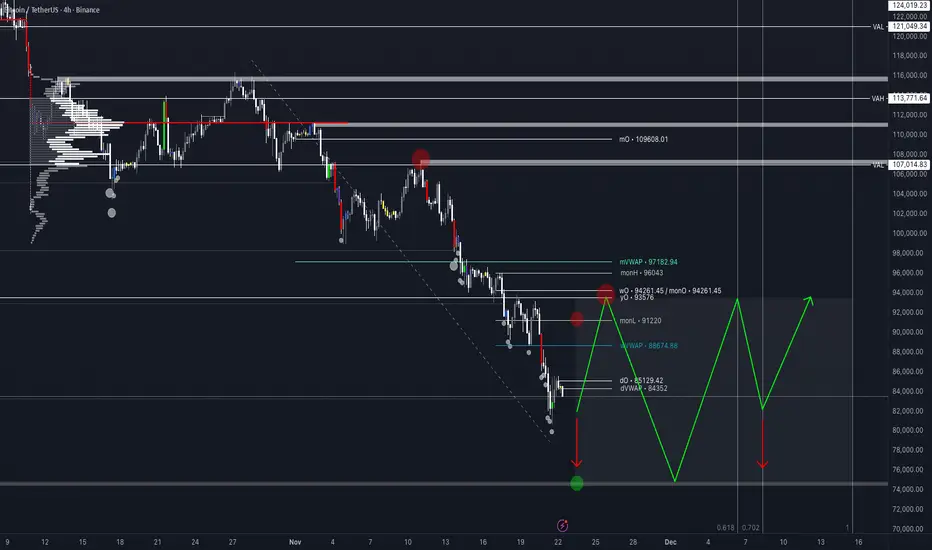
BTC Outlook: 90K Zone Retest PossibleBTC Outlook: 90K Zone Retest Possible
BTC has entered a strong reaction zone around 82–85K, which historically acts as a demand block. The initial bounce from this area suggests buyers are stepping in again.
Key Reasons a Move Back to 90K Is Possible:
1. Strong Demand Zone (82–85K)
BTC is showing clear absorption of selling pressure. This is typically the first step before a reversal toward higher resistance levels.
2. Market Structure Reversal Pattern
Your chart indicates a potential W-bottom / reclamation setup. Once BTC holds above 85.6K, momentum usually shifts bullish.
3. Liquidity Above (88–90K)
There’s a large cluster of untapped liquidity at 88–90K where previous breakdowns occurred.
Market makers are incentivized to push price back up to that zone.
4. 90.3K = First Major Resistance Target
The yellow line at 90,370 aligns with:
HTF resistance
Former support flip
Liquidity target
Perfect location for a retest.
Scenario Path (Matches Your Green Projection):
Bounce from 82–85K
Break above 85.6K reclaim
First target → 87K
Pullback / consolidation
Final push → 89.5K–90.3K

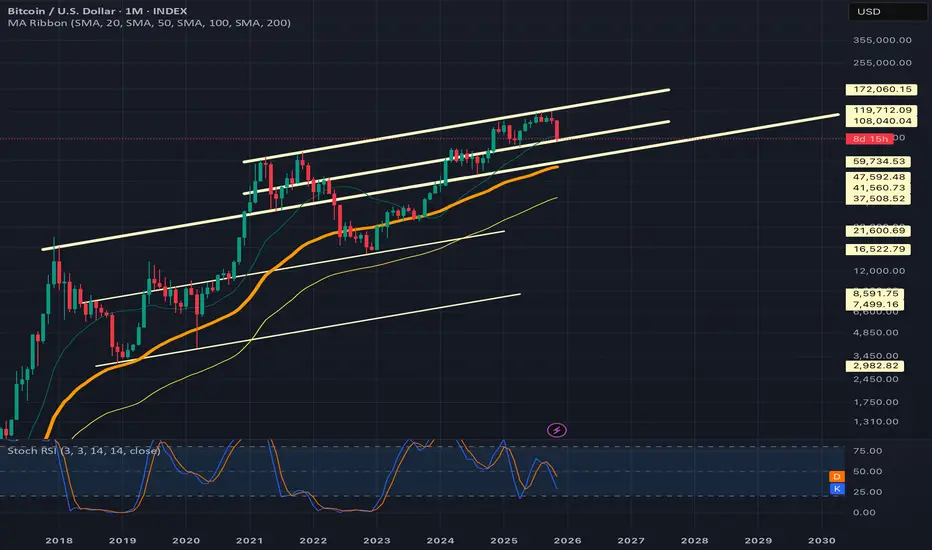
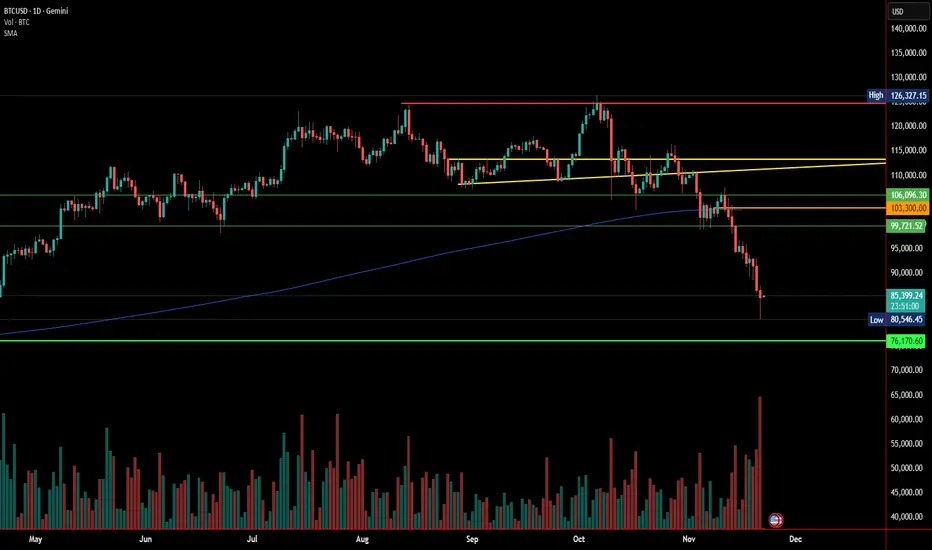
Bitcoin Breakdown: Macro Trend Under PressureBitcoin’s climb to 126,327.15 now reads like the last breath of a fading trend. That high wasn’t just a price point it was the last surge of bullish confidence before the chart quietly and consistently began breaking down.
Lower highs formed, momentum weakened, and what looked like healthy consolidation slowly revealed itself as exhaustion. The rising triangle that once hinted at continuation eventually failed. Buyers couldn’t break the ceiling, sellers kept pressing the floor, and the entire formation finally snapped.
When Bitcoin fell out of that triangle, it didn’t stumble it collapsed. The real damage came when price cut straight through the 50-week SMA , the line that separates long-term strength from long-term weakness. This weekly moving average has defined every Bitcoin cycle since Bitcoin’s inception. Staying above it signals a healthy macro trend; falling below it signals a corrective phase.
The break this time wasn’t subtle. A heavy red candle with the largest sell volume on the chart sliced through the 50-week SMA. That’s what capitulation looks like.
Currently, Bitcoin sits below the 50-week SMA . For BTC to turn bullish again, it must reclaim that line no exceptions, no shortcuts. Anyone talking about $200,000 Bitcoin should note that until BTC gets back above $ 103,300 , the macro bullish thesis is paused.
Michael Saylor has been a prominent figure in the Bitcoin narrative, often associated with large-scale accumulation through corporate channels. As the market adjusts, we may soon see Bitcoin’s price reflect its true, organic strength or weakness, independent of corporate sentiment.
Nothing has changed since my last view. My targets remain:
$89,000 – initial support, now under pressure
$83,000 – major demand zone
$76,000 – deeper correction territory
$58,000 – full cycle flush if panic accelerates
Until Bitcoin reclaims the 50-week SMA and rises above 103,300 , the macro trend remains tilted downward. The market is approaching a moment where Bitcoin stands fully on its own without corporate lifelines or narrative amplification.
Form my last post, my views still stand for price TR.
BTC Wyckoff (pt. III), Pi Cycle Top, 350 SMA, and SPY Is A SELL!Trading Fam,
Was this the top? Where is Bitcoin going? Where are stocks going? Will the selling continue? How long? Can we find some targets? Where should we look to start DCA'ing back in? These are hard questions. Let's take a look at what my charts are showing us.
✌️Stew

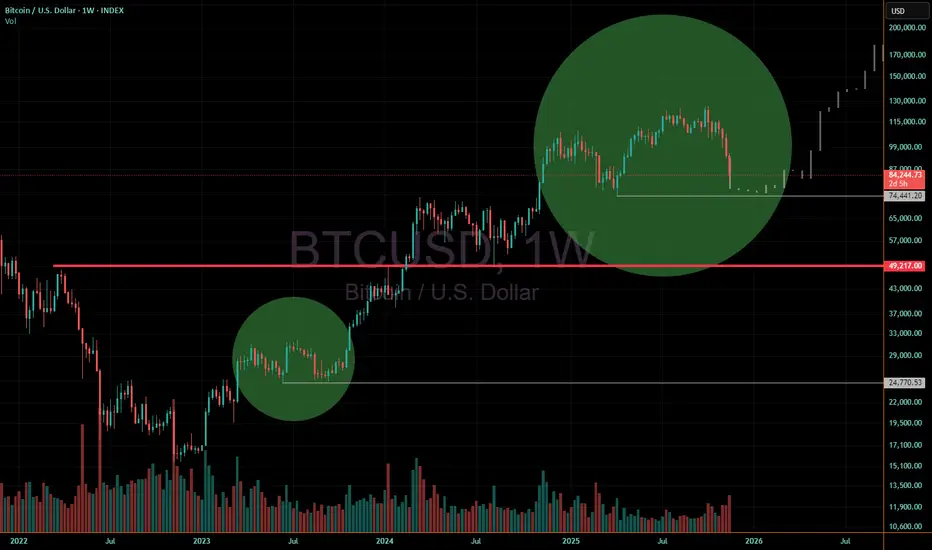
Previous pattern repeating?Possible repeating pattern in Bitcoin here.
If so, a possible stop near the upper white line as it did previously with a very slightly higher 2nd low, then start moving up slowly after finding its lows, and finally spike up and find a new high.
Must not lose the thick red line around 49k if we make a lower low.
Volume needs to come back in and start flipping green vs the present rising red volume being seen on weekly chart now.
This could take upwards of 6 months or longer to play out.
The coming collapse of the carry trade part 2I have held off for a few weeks now to post this chart . Reason the timing I think now this should be seen as i called a top at 161.8 last year . we are now approaching the ABC targets in a double zig zag up to form a major top in Liquidity as we started to see by the crashing of BITCON in Bitcoin I am only looking for an wave A up to 96 and then down and then Up to peak at 106 zone to complete The head n shoulder top . best of trades Wavetimer

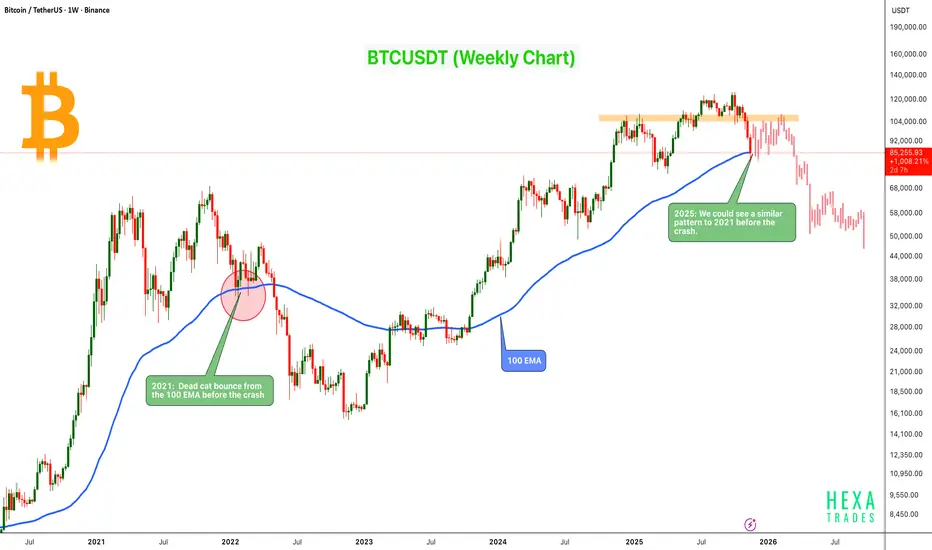
2021 vs 2025: Bitcoin Showing a Similar Macro StructureBitcoin is showing a price structure very similar to the 2021 macro top, where BTC formed a dead-cat bounce from the 100 EMA before beginning a major correction.
On the current cycle, BTC is once again testing the 100 EMA, and the price reaction looks very similar to the 2021 pattern: a brief bounce followed by continued downside pressure.
Key Points:
- 2021 Pattern: BTC bounced from the 100 EMA before the macro crash.
- 2025 Price Action: Showing a similar bounce and reject structure at the same weekly EMA.
- Major Weekly Resistance: Market showing exhaustion and lower-high structure, just like previous cycle tops.
- Potential Dead-Cat Bounce: We could see a bounce toward the $100K–$107K zone before the downtrend continues.
- Possible Repeat Scenario: If BTC fails to hold above the 100 EMA, history suggests a deeper correction may follow.
Cheers
Hexa
BTCUSDT.P - November 22, 2025Bitcoin is in a pronounced downtrend, with price action consistently making lower highs under the descending trendline and currently trading below both resistance levels at 86,313 and 88,214. Recent momentum remains bearish, with sellers actively defending rallies and price targeting the marked support band near 78,800–79,000; unless price recovers above 86,313 resistance, expect further weakness and trend continuation.

Will this date come true?This is not fundamentally unbelievable, especially with the manipulation of governments in the crypto market
What is completely clear to us activists is the manipulation of absurd markets with great temptation by the yellow-haired doll and the child politicians and child killers around him.
Although I am not active in this market, I feel sorry for you, despite this cesspool soaked in the blood and hearts of the people of the world!
These numbers may not be realized, but the much blood that has been spilled on the ground will rise and the consequences will drown it.
The freedmen will definitely win.
And I must say, this analysis may expire after a while:
Good luck
MJ.REZAEI

185kthis is the last post i will ever make on this account. after today, i will be discontinuing the usage of this account in perpetuity. it will remain a relic of sorts.
---
gm,
many of you remember me as eloquent trades, or elo. i come today with one final post for you before i disappear onto the dark side of the moon.
---
i predict the bitcoin rally is not yet finished,
i believe we have one final leg up to go
my upside target sits at $185k this cycle.
---
once 185k has been attained, i predict a crash like we've never seen before, one that defies logic, one that takes everything away, from anyone associated with this market.
---
ps. this is not financial advice, this is merely a theory-craft, the final one on this account.
farewell
🌙

BTCUSDTHi
CRYPTOCAP:BTC is correction from ATH but if couldn't keep level (110.000$) we see more downtrend and I think deep bear-trend to 80.000$.

Bitcoin’s Drop From $125K: A Healthy Correction?The recent decline is largely a correction after BTC’s massive rally from $17K (Oct 2023).
Based on Fibonacci levels, the next key supports sit at $85K, $70K, and $60K — with $70K looking especially strong to me.
And yes… Bitcoin is officially 4-digit again.
#Bitcoin #BTC #CryptoAnalysis #Fibonacci #CryptoMarket

BTC Bitcoin Bear Market If you haven`t bought BTC before the recent rally:
Historically, Bitcoin has shown a tendency to retrace in December before starting a recovery around March. This pattern could repeat this season, with BTC facing selling pressure as year-end portfolio rebalancing and macro uncertainties weigh on the market.
While a brief Santa Claus rally might provide temporary relief, the bearish trend is expected to dominate until March. By then, BTC could trade below $84K before regaining momentum, aligning with its historical recovery trend as market conditions stabilize in spring.

A 30% Crash: Bitcoin Falls Deeper Into Macro RealityThat’s a 30% drop from the top — a serious correction.
Fears of a U.S. stock market decline, especially in high-tech, along with expectations of further rate cuts, have pushed heavy risk-off sentiment into crypto.
The truth is clear:
Crypto has never been fully independent from central banks, governments, or macroeconomic cycles — despite all the slogans.

Bitcoin Below Weekly EMA-55 After 188 Weeks🔴 The last time Bitcoin closed below the 55-EMA on the weekly timeframe, it crashed more than 60%.
It’s been 188 weeks since that happened — is history about to repeat itself?