BTC $115,200 TARGET BREAKOUT: The Ultimate Long SignalThe Logic Behind $115,200: This analysis pinpoints the critical multi-year resistance/supply zone at $115,200. A confirmed close above this level is the ultimate trigger for the next parabolic leg up in the Bitcoin cycle. Our proprietary provides a filtered, no-noise signal specifically for this major breakout level. Key Features: * Precision Entry: Alerts only on the confirmed breach of the 115,200 supply * Risk Management: Includes projected Take Profit 1 & 2 targets * Filtered Noise: Uses to validate the move Action: Set your alerts and prepare for liftoff! The market structure dictates that this level is make-or-break for a new All-Time High pursuit.
Bitcoin (Cryptocurrency)

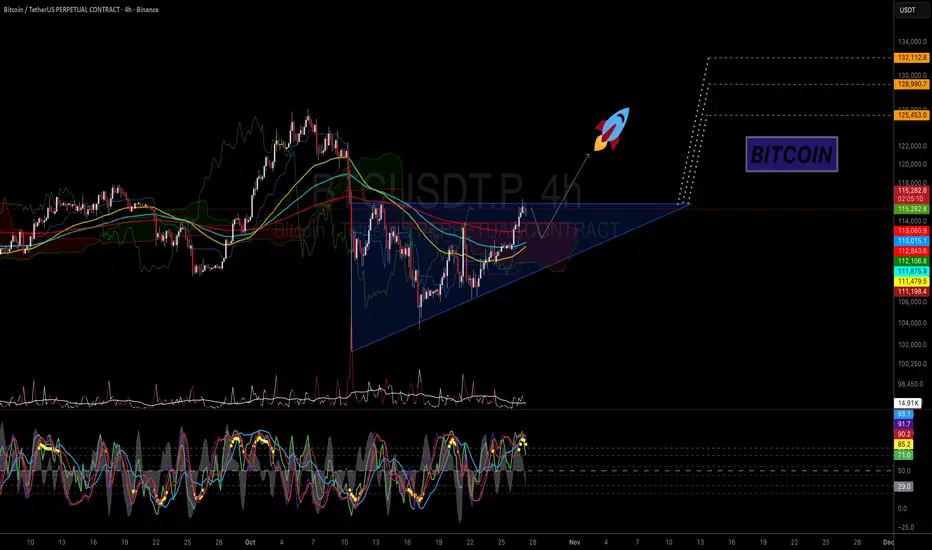
BTC - Ascending Triangle in PlayMorning fellas,
Halloween coming up and trust me, we gonna get that pump and one more leg up to ATH.
Obv you do you, its your money so its up to you the risk you take, but I am riding this like a biker riding a harley over a sunset.
Trade thirsty, my friends!
Will Bitcoin on 4H Push Higher or Take a Breath? | BTC 11👋🏻 Hey everyone! Hope you’re doing great! Welcome to SatoshiFrame channel.
✨ Today we’re diving into the 4-Hour Bitcoin analysis. Stay tuned and follow along!
👀 Looking at Bitcoin on the 4-hour timeframe, we can see that after breaking its multi-timeframe resistances, it is currently located near the price resistance of $115,793. If Bitcoin breaks this area, it can move toward its next resistance at $121,000.
🧮 Observing the RSI oscillator, we can see that it is currently in its OverBuy zone, and the important point here is to wait for it to exit the overbought area and form a new oscillation structure.
🎇 Pay attention to Bitcoin’s volume, which has been increasing up to this point. Even as it reaches the current resistance, buying volume is still rising and buyers are trying to push prices higher. But since there’s potential for selling pressure, we wait for volume to decrease a bit and allow the market to rest.
✍️ The scenario ahead for Bitcoin is independent of any trade or position, but we can use it to better understand Bitcoin’s corrective or resting behavior.
🛡 Bitcoin has just experienced a beautiful bullish leg across multi-timeframes, and the effects of this upward wave have also extended into higher timeframes such as the 4-hour and daily charts. Price, in a multi-timeframe structure, now requires a short-term correction and a pullback to fill lower buy orders. Keep in mind that traders typically take profit in such zones.
❤️ Disclaimer : This analysis is purely based on my personal opinion and I only trade if the stated triggers are activated .

BITCOIN – THE LAST DANCE AT THE BORDER OF DEATHTraders,
I believe Bitcoin is potentially setting up for a swing fail pattern around 117.500.
A swing fail pattern, very simply, is when price runs the previous high, takes out the liquidity sitting above it, and then fails to hold above that level. In other words, it clears the stops, shows strength for a moment, and then turns. It is the market taking a breath before it bites.
Here is how I see it and why I am positioned for shorts, not longs.
1. Structure into 117.500
The zone around 117.000 to 117.500 is, for me, the kill zone.
Why?
There is a clean previous high that has not been taken yet
There is visible imbalance from the last fast drop sitting in that band
We have London morning wick liquidity above us that I believe price still wants to clean
The math and harmonics I am running line up in the same area
When I say the math lines up I am talking about measured extensions and harmonics off the leg that started around 103k to 104k and impulsed higher. My 1.618 extension clusters around 116.7 to 117.5. The 1.272 and 1.414 levels already got respected on the way up. This last one is usually where you get the overextension and the last grab. On top of this, the 1.618 extension confluences with the HTF Golden Pocket.
We also sit right on top of what I call the border of death. Above 117.500 I do not want to see Bitcoin hold. If it does hold and build acceptance up there then this entire idea is invalidated and I will adapt. I am not married to bias. I am married to data.
2. Order flow and participation
Let us talk about what is behind this move, not just what it looks like.
Spot CVD is still depressed compared to the beginning of the run. That means real buyers paying cash are not the ones driving price higher. This is not a classic spot accumulation bid. This is not strong hands owning the level.
Stablecoin margined CVD and coin margined CVD both curled up into the most recent leg. So who is lifting price It is perps. Not investors, not patient buyers, just leverage.
Open Interest is also telling us a story.
Stablecoin margined OI is grinding back up into the highs.
Coin margined OI is starting to climb again.
That means people are adding new exposure on the way up. They are not just covering shorts anymore, they are now chasing longs into the high. This is where positioning gets fragile. The crowd thinks we are going to keep going. I start thinking about harvesting that belief.
The floor under us is not built by conviction. It is built by leverage.
We have seen this before. The desert looks quiet before the sandstorm picks up.
3. What I am expecting
I am expecting a sweep of the high into roughly 117.500.
Clean the liquidity. Fill the imbalance. Tap the last little pocket of inefficiency that is still sitting there. Show strength on the surface.
Then reject.
That rejection is the tell for me. If we push above the high and then snap back below it on force, that confirms the swing fail for me.
From there I am looking for rotation much lower.
4. The target zone if this plays out
If this plays out the way I think it can, I am looking toward 98k.
This is not a random number. That is basically the next meaningful pocket of imbalance below. That is the next unfair area that never got re tested. Price likes to rebalance. The market eventually revisits the places it skipped when it was moving too fast. We call it inefficiency but it is really just unfinished business.
Will it instantly teleport there No. This is a path idea, not a straight line prediction. But 98k is where I think equilibrium lives if this whole run unwinds.
5. Risk management and positioning
Because of this view I have adjusted.
My earlier thesis from October 16 is, in my eyes, no longer valid in its original form. Never say never, but I am not trading that idea anymore.
I have closed all long positions. I am no longer here to squeeze the upside. I am here to stalk shorts.
Does that mean I am instantly full size short here No.
I am not interested in guessing tops. I am interested in letting the market reach for the level I want, and only then taking the trade with data behind it.
If Bitcoin breaks through 117.500 and starts holding acceptance above that level, I will back off this idea. No ego. No stubbornness. I am here to survive. Survival is the only way you ever get to mastery.
6. Summary
I believe Bitcoin is setting up for a classic swing fail pattern at around 117.500. I think price will hunt that liquidity, stop out shorts, convince late longs they are right, and then turn. I think the next meaningful re balance sits much lower, around 98k.
This is not guaranteed. Nothing in trading is guaranteed. Trading is probability, not fantasy.
But right now the flow, the harmonics, the imbalance, the extensions, and the psychology of the crowd all rhyme in the same place.
And when the market whispers in the same tone across different tools, I listen. I am ThetaNomad.

27/10/25 Weekly OutlookLast weeks high: $115,481.36
Last weeks low: $106,688.94
Midpoint: $111,085.15
It's FOMC week again and with it comes speculation and volatility. With the Fed forecast to cut rates another 0.25% where does this leave Bitcoin?
After weeks of consolidation between $106,000 - $111,000 BTC broke above $112,000 resistance level suggesting that sellers have largely been absorbed and momentum is returning to the upside. Trading volume surged as BTC crossed the $112,000 threshold, indicating strong conviction from both institutional and retail participants.
Short-term volatility is expected around the FOMC announcement, I would not rule out a $112,000 retest, it would be a good indicator of just how strong this breakout move is. Macro conditions continue to favor Bitcoin’s long-term bullish case particularly if the Fed signals an eventual shift toward easing in 2026 which is already being discussed.
The next major test lies around $120,000 if weekly high resistance is flipped, but a decisive close above this threshold would likely trigger another wave of momentum buying toward $125K and beyond.
For the bear case a loss of $112,000 would mean a revisit of the same $106,000 - $111,000 range and an increasing loss of momentum for the bull run.
Good luck this week everybody!

BTCUSD — Coiled Energy vs Dollar | Volume Flow Meets Patience🧭 Context
Bitcoin started the week on the front foot, pressing toward the Flat TPO Top at 116 077.
Meanwhile, the U.S. Dollar Index (DXY) notched its fourth consecutive inside week, boxed between 97.56 and 99.19 — a quiet coil ahead of the Fed.
Crypto stretches while fiat meditates — a calm standoff where market psychology meets structure geometry.
📐 Technical Map
BTCUSD trades inside a bearish weekly range, yet buyers defend every dip.
Volume confirms accumulation from imbalance lows.
Key zones: 112.845 low → 116 077 high — measured-move corridor + prior TPO distribution shelf. A wick through 116 077 completes this week’s 10 % rotation
🌐 Fundamental Pulse
DXY strength = tightening risk appetite.
Fed decision mid-week sets November’s flow regime.
Until then, Bitcoin trades inversely: Dollar up → Crypto breathes out.
📊 Volume & Order Flow Map
Professional suite: Bookmap
Tracking bid/ask delta pressure around 112 845 and 116 077.
Liquidity depth shows absorption below range highs.
Volume clusters reveal short-covering rotations — not new conviction (yet).
Institutional footprint signals patience, not chase.
🎯 Plan
Full bias shift only if BTC closes above 116 077 with confirmed volume expansion.
If not, we reassess lower — control risk, collect flow, and stay structured.
“The Market Therapist”
Every trader thinks the market is emotional.
It’s not. You are.
The market doesn’t care about your caffeine, your new monitor, or your conviction.
It only respects structure, flow, and timing — and it punishes anyone who confuses belief with evidence.
So if Bitcoin grinds higher while the Dollar sleeps in a coil — breathe.
Nothing’s changed yet.
Pros wait. Amateurs anticipate. Only one gets paid.

BITCOIN This is what separates 128k from 104k.Bitcoin (BTCUSD) just broke above its 1D MA50 (blue trend-line) for the first time in 2 weeks and only days after it got rejected there. A 1D candle closing above it will be a strong bullish signal.
As BTC has been trading within a Megaphone pattern similar to the December 2024 - April 2025 one, a closing above the 1D MA50 might put the structure in a similar situation as April 17. As you can see that Megaphone also had a 1D MA50 rejection preceding the break-out and before that also, two Lower Lows near the 1W MA0 (red trend-line).
What it hasn't had (so far?) is a clear touch of the 1W MA50 (as on April 07) and a 1D MACD Higher Lows Bullish Divergence.
As a result, both scenarios are open for now. Until it closes above the 1D MA50, a 1W MA50 test remains possible around $104000. A closing above the 1D MA50 though strengthens the probability of a 1.1 Fibonacci extension rally at $128000.
What do you think is more likely to happen? Feel free to let us know in the comments section below!
-------------------------------------------------------------------------------
** Please LIKE 👍, FOLLOW ✅, SHARE 🙌 and COMMENT ✍ if you enjoy this idea! Also share your ideas and charts in the comments section below! This is best way to keep it relevant, support us, keep the content here free and allow the idea to reach as many people as possible. **
-------------------------------------------------------------------------------
💸💸💸💸💸💸
👇 👇 👇 👇 👇 👇

$SOL - LONG - ABOUT TO POP?Analysis:
Following up on my Oct 14th BTC note — “Wait for arbitrage to balance spot markets” — we’re now nearing that blue box. As BTC approaches equilibrium, I’m eyeing CRYPTOCAP:SOL for a clean long setup.
Here’s why 👇
AVWAP Confluence Zone:
We’ve got the lower band of a HTF auction colliding with the VWAP line from another HTF auction — strong mean reversion and liquidity overlap. (Didn’t draw them out to keep the chart clean.)
Fibonacci Confluence:
A completed AB=CD right at 175.0, perfectly inside the HTF golden pocket (0.618). That’s a key structural retrace aligning with measured move completion.
Bullish Harmonic (4H):
A textbook bull harmonic forming — early signs of reversal pressure building.
No position yet. Waiting for SOL (CME) to close the gap at ~174.7 — that’s my trigger to go long.
🎯 Target: 223 — with a possible sweep of the 229–230 zone where shorts are stacked. Expecting a short squeeze flush through that region.
Seeing solid order flow confluence across the board.
Will update this post as things unfold.

BITCOIN - PUMP BEFORE THE DUMP?Traders,
Last time I talked about arbitrage inefficiencies between spot and perps. I expected a dip first, then a corrective move up. That view still stands — but I also expected a sweep up before the bigger move down.
In my earlier notes I called for a sweep to clean the Sunday low, followed by a move back toward 120–122k with a short squeeze.
That scenario is now in play.
I planned to long near 109.350, after the sweep, and only if the data aligned with my thesis.
What I projected vs what happened
Sweep the Sunday lows, then squeeze up.
Wait for the sweep and only enter if the data confirms around 109.550. Entered 109.550 once multiple signals lined up.
Why I entered at 109.550
Stablecoin-margined CVD
First pass: Stablecoin Margined CVD made a lower low while price made a higher low → hidden bullish divergence. Aggressive sellers were getting absorbed by resting bids.
Second pass: Stablecoin Margined CVD made a higher low while price made a lower low → selling pressure fading, buyers absorbing again.
Coin-margined CVD
Coin Margined CVD kept making lower lows while price refused to follow → another hidden bull div. Shorts were leaning in, but passive buying held firm.
Spot CVD
Lower lows on CVD while price held flat or slightly higher → trapped aggressive sellers, absorbed by steady passive spot buyers.
On Binance Perp Order Flow we could also see a regular bullish divergence into a smaller hidden bull div at the sweep — a clean reversal setup.
Open Interest read
Here’s where many traders miss the nuance. There are two main perp types on Binance and most major exchanges:
Coin-margined contracts: collateralized with the underlying asset (e.g., BTC). Profits and losses are settled in BTC. Stablecoin-margined contracts: collateralized with a stable asset (e.g., USDT or USDC). Profits and losses are settled in dollars.
This matters because the behavior and risk exposure of traders differ between the two:
When coin-margined OI goes down, it usually means BTC-collateral traders are closing positions or getting liquidated. They’re forced to sell BTC to cover margin, which can create short-term downside pressure.
When stablecoin-margined OI goes up at the same time, it often means new traders are entering positions with USDT collateral. That capital rotation usually signals fresh directional bets, often late shorts piling in after a move down.
So when price stops making new lows while stablecoin OI keeps climbing, it’s a clear sign the market is loading up on shorts, but without continuation. That mismatch is short-squeeze fuel. Combine that with the CVD divergences above and it paints a strong case for a move back into overhead liquidity.
Supplementary edge
1H RSI bullish divergence: RSI makes higher lows while price makes lower lows → loss of downside momentum, suggesting sellers are tiring.
USDC.D and USDT.D bearish divergences: Stablecoin dominance charts make higher highs while RSI trends lower → stablecoin demand weakening. When that happens, capital tends to rotate back into BTC and risk assets, reinforcing the long bias.
Broke above daily VWAP
Together, these add extra confluence to the squeeze setup.
Plan, target, invalidation
Target: 122 area (blue box).
At target: watching for rising price with fading delta, sell imbalances near highs, and absorption signals — that’s where I’ll start hunting shorts and let the market cool off. Invalidation: acceptance back below the Sunday sweep low with expanding negative delta and rising OI on the breakdown. That would kill the squeeze thesis.
Summary:
A clean sweep → multi-CVD bullish divergences → absorption → rising OI imbalance → RSI & VWAP confluence. All aligning for a controlled short squeeze toward 122k, before the market potentially resumes its broader corrective path.
Does this mean we 100% go up? No. Markets don’t promise: they whisper. You listen, you align, and you risk what you can afford to be wrong about.

Bitcoin (update)As mentioned, Bitcoin has reached $115,000.
However, the key point is this: as long as BTC fails to break and hold above the $117500 level, the risk of a bearish reversal remains.
Until Bitcoin stabilizes within the highlighted yellow zone, we cannot expect a move toward the $121000 target.
previous analysis

BTC correction complete?BTC is heading to the top of the channel once more after testing support High Volume Node, swinging below the macro trend-line and daily 200EMA before recovering.
FEAR was in hold of social media. Cycle top nonsense is a poison narrative to success
Price is above the daily pivot and 200EMA in a bull structure. RSI crossed bullishly.
Safe trading

BTC - BACK TO H&S PATTERN AND 110.3-111.50K Morning folks,
In last two weeks we prefer to stay aside as market was forming contradictive signals, although we have a theory of mid term price shape. In a recent few sessions BTC starts looking more bullish, cancelled potential 3-Drive scenario and is returning back to the shape of H&S pattern.
Now price is completing AB=CD target and comes to 5/8 Fib resistance level, which is also the neckline of the pattern. Thus, if everything will go with the plan, 110.3-111.5K seems the first area where there right arm might be formed. So let's keep looking over it.

BTCUSDT – When the Bullish Wave ReturnsBitcoin is showing a notable recovery phase after a series of previous corrections. On the daily timeframe, price continues to move within an ascending channel that has been forming since the beginning of Q3.
Currently, BTC is approaching the midline of the channel around 115,000–116,000 USD , with key support at 106,700 USD and upper resistance near 127,700 USD.
If the price retests the 112,000–113,000 USD zone and holds, this could become a perfect “launchpad” for the next bullish move.
From a fundamental perspective, expectations of a Fed rate cut and South Korea’s more open stance toward crypto are providing positive momentum for risk assets like Bitcoin. However, signals from the options market and investor sentiment still show some caution, meaning the upward move may be gradual and range-bound rather than explosive.
Overall, BTC remains under bullish control , and as long as the price holds above the 106,000–107,000 USD zone, the gradual climb toward 127,000 USD remains the most likely scenario.

Bitcoin back above 20MA WEEKLYAfter the strong press to the downside and bitcoin dropped about 16% , did test the 34MA on WEEKLY but now could closed the weekly candle above 20MA again last night which is a bullish sign

Bitcoin No Math — Lover’s Pulse (BTC/WM1NS):the trend line fits like a vein, not a ruler. Bitcoin’s fractal feels like it breathes hugging the trend line like a lover.

GOLD rise?GOLD is consolidating. Making it's way to the RESISTANCE zone and then we will see if it will continue ranging or BreakOut going to the London and NY session.

$BTC Reclaims 20WMA and .236 Fib on Weekly CloseSAVED BY THE BELL 🛎️
₿itcoin avoided forming a 3 Black Crowes pattern and has now reclaimed the 20WMA along with the .236 Fib, closing above the Danger Zone ⚠️
CRYPTOCAP:BTC now needs some decisive Weekly Closes above these key levels in order for the next leg up.
Don’t F this up Bulls!

Bitcoin Macro Map for 27 to 31 Oct 2025Macro map for 27 to 31 Oct 2025
Concentration of policy and inflation prints means policy expectations and real yields will drive the United States dollar, global equities, bitcoin, and gold. The hinge events are Wednesday FOMC, Thursday US GDP advance and German data, Friday US Core PCE and Chicago PMI. Secondary drivers are BoJ policy guidance and ECB tone, plus BoC.
Watch list
Real ten year yield and the DXY dollar index after FOMC and PCE
EUR front end versus USD front end after ECB and FOMC
VIX around the FOMC window and into PCE
US liquidity windows around 14:00 Eastern on Wednesday and 08:30 Eastern on Thursday and Friday
Bitcoin outlook for next week
Set up
At the weekly horizon bitcoin is still a beta expression on global liquidity and real yields rather than a pure inflation hedge. It reacts first to dollar and rates shifts that change marginal risk appetite. The FOMC and PCE prints therefore matter for direction even without a direct link to on chain activity. Weekday flow is led by United States hours while Asia sets the early tone on Monday.
Baseline view
If the policy path looks patient and Core PCE continues to glide lower, real yields edge down and the dollar eases. That mix opens the door for crypto beta to catch a bid. A hawkish tilt or a hot PCE does the opposite. Structural ownership by spot products reduces downside jump risk compared with prior cycles, yet high leverage pockets still create sharp intraday tails.
Scenarios and probabilities
Range continuation inside the recent multi month band. Probability fifty. Triggers are offsetting signals across FOMC, GDP, and PCE. Expect false breaks around event minutes with reversion toward the weekly mean.
Upside extension with rotation into high beta crypto. Probability thirty. Triggers are a patient Fed message and benign PCE. Watch for confirmation from a softer dollar and firmer US equities.
Downside flush that tests prior weekly supports. Probability twenty. Triggers are a hawkish statement or hot PCE that pushes real yields higher. Dollar strength and equity weakness would confirm.
Key levels and risk
Use round numbers at five thousand increments as decision points and the prior week high and low as risk guardrails. Funding flips and basis widenings are useful warnings into event hours. Manage exposure size during the two hour FOMC window and the Friday 08:30 Eastern data drop.

Bitcoin: There Are Better Prices To Buy.Bitcoin bounce to 113K resistance, which I previously described as a more relevant area to watch for being that it is in the middle of the range. IF momentum continues from here, the 116K to 118K area resistance is the next potential inflection point to prepare for. IF price confirms a bearish reversal at the current level of 113K, there is a minor support at 109K to watch for a bullish reversal. Either way, Bitcoin has not changed much in terms of structure, it is still in a broader bullish consolidation which means a breakout into the 130Ks is still within reason over the coming weeks.
For this reason, support levels should be given more priority and higher expectation, while resistance levels should be considered more likely to break. The key to timing these turns is WAITING for price action to confirm in some way. For example, 113K previously saw a swift rejection, but at the moment is sitting strong. While this level may be a bearish inflection point, there is NO reason to sell anything because there is no confirmation. A bearish pin bar or inside bar would be something to look for IF you were interested in an aggressive short. Otherwise it is best to stay out of Bitcoin's way in my opinion.
On top of that, it is important to pay attention to the current economic environment. The Federal Reserve is expected to cut rates by 25 basis points on Wednesday, also again in December. Plus Chairman Powell has signaled that they are going to begin their balance sheet "expansion" or quantitative easing efforts. This means printing money in the face of an elevated inflationary situation. I am not an economist, but it sounds like we are going to be swimming in cheap money very soon which can only be a positive for any type of anti inflationary asset like Bitcoin.
While we can easily see brief pull backs come out of no where, there is very little to support any type of bearish argument in the broader sense. I believe buying pullbacks still offers a higher probability and better reward/risk. This means watching for attractive levels like the 109K and 105K areas Or if price breaks higher, watch old resistance levels to act as new supports (like the 118K area IF 120K is reached again). Either way, make sure to wait for confirmations, and define risk from there.
Thank you for considering my analysis and perspective.

BTCUSDT TradeI when trading in IG:BITCOIN try come to breakeven in big candle for again entry buy or sell.
But you need fix target or trailing stop on new swing in profit.
Please have risk management.

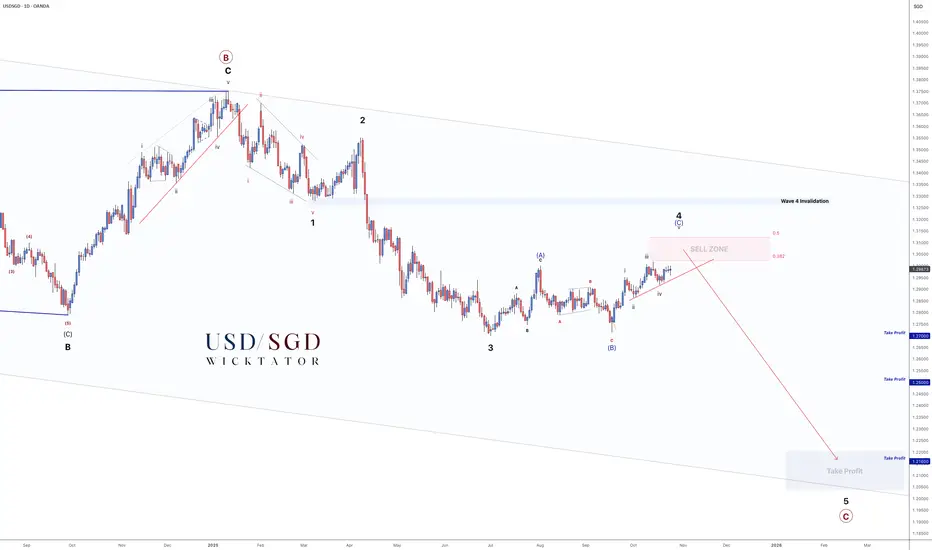
USDSGD - 1000pip Drop Almost Ready!1D Chart
In our previous breakdown, we highlighted the upcoming Wave 4 correction and the potential sell zone ahead — price has now followed that roadmap with precision and fast approaching our sell zone.
Wave 3 completed cleanly, and we’ve since seen a textbook ABC correction forming Wave 4.
Price is now approaching the Sell Zone (38.2–50% retracement), where we’ll be watching closely for confirmation to trigger shorts.
The structure remains intact — Wave 4 invalidation sits just above the 1.32 region. As long as we stay below that level, the bearish setup toward Wave 5 remains valid.
Trade Idea:
- Aggressive short: Rejection inside the Sell Zone
- Conservative short: Break of structure / trendline break confirmation
Targets:
TP1: 1.27 (400pips)
TP2: 1.25 (600pips)
TP3: 1.216 (1000pips)
Weekly Chart:
This is where patience pays off — we’ve tracked this correction from the start, and the final leg of Wave 5 is almost ready to begin.
Plan the trade. Wait for confirmation. Execute with precision.
Goodluck, and as always, Trade Safe!
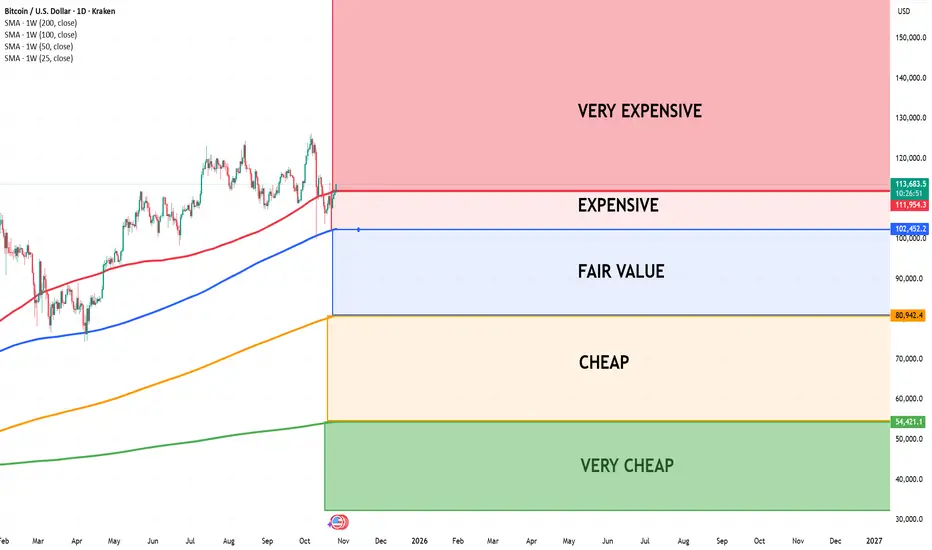
Bitcoin entering Very Expensive areaI use four key Moving Averages — the 25W, 50W, 100W, and 200W — to assess whether Bitcoin is overvalued or undervalued.
Bull Market Strategy:
When Bitcoin touches the 50-week Moving Average (50W MA) during a bull market, it often represents its fair value — typically an excellent buying opportunity.
Expensive Zone:
When Bitcoin trades above all four moving averages (25W, 50W, 100W, 200W), it enters the expensive zone. In this phase, we can usually expect a short-term continuation upward, followed by a pullback to retest or cross below some of the averages.
Bear Market Strategy:
During bearish periods, patience is key. The best long-term entry opportunities often occur when Bitcoin drops below the 200-week Moving Average (200W MA) — historically marking undervalued territory.
Based on current cycles, this scenario may unfold again around 2026.
Bitcoin USD — Weekly Flat TPO Top 116.077 | Testing Conviction o🧭 Context
Bitcoin has rewarded patient structure traders this week — a near +10% advance from the range lows, holding daily supports “like clockwork.”
We remain inside the bearish daily range, but momentum has clearly rotated upward through volume participation. The internal rhythm continues to expand toward the upper pivot, with liquidity building near the prior TPO top.
📊 Technical Map
Volume expansion off the range lows has confirmed strength, but structure still defines risk.
Daily pivot target sits at 114,082, an ideal partial zone.
Next major liquidity magnet aligns with the weekly flat TPO high at 116.077 — a zone where price historically hesitates.
Closing above 116.077 would flip structural bias bullish; rejection here likely resets next week’s rotation lower.
Patience remains the real edge — take partials, trail stops, and let structure lead, not emotion.
🌐 Fundamental Pulse
This week’s tone stays dollar-driven. The U.S. Dollar Index has been steady as traders await fresh macro cues.
Next week brings U.S. ISM PMI and NFP, both capable of reigniting volatility across crypto and risk assets.
Keep in mind: Bitcoin’s recent strength often fades when real yields firm — the impact mechanism remains the same: liquidity flows follow rate expectations.
🎯 Plan
Trail stops behind range lows, book partials at 114,082, and monitor reaction near 116.077.
If weekly closes above that level, structural bias shifts; otherwise, expect rotation back into range mid.
Weekend traders — stay disciplined, not greedy. The market rewards clarity, not hope.
🧠 Mindset
Every rally feels easy after it happens. The pro separates confidence from euphoria.
Trade what structure confirms — not what emotion predicts.
Enjoy the weekend, protect profits, and respect the range.
