TradeCityPro | Bitcoin Daily Analysis #224👋 Welcome to TradeCityPro!
Let’s dive into the Bitcoin analysis. The market has continued its downward movement and has reached its next support level.
⏳ 1-Hour Timeframe
Yesterday, after breaking the 93,965 zone, Bitcoin started a downward move, which extended to 89,603.
⚡️ The main support zone for the price, in my opinion, is 88,262, which the price hasn't yet reached, and it was supported at 89,603.
✨ Currently, the price is making a bullish correction and has retraced to around the 0.382 Fibonacci level.
✔️ The 91,608 zone is very important, and if the price can stabilize above it, the likelihood of forming a V-pattern increases significantly.
🔔 If the price moves sharply upwards and stabilizes above 95,766, we will get confirmation of the activation of this pattern, but currently, the price is still far from it.
📊 For today’s long position, we can consider entering if the 89,603 level breaks, but with very low risk, as the price has already made its move, and I believe we are in a correction phase now.
🎲 If the upward move continues, I think we could open a long position tomorrow. Otherwise, the next trigger is 95,766.
❌ Disclaimer ❌
Trading futures is highly risky and dangerous. If you're not an expert, these triggers may not be suitable for you. You should first learn risk and capital management. You can also use the educational content from this channel.
Finally, these triggers reflect my personal opinions on price action, and the market may move completely against this analysis. So, do your own research before opening any position.
Bitcoin (Cryptocurrency)

Bitcoin RSI Oversold Again - Is Another bounce Coming?Bitcoin chart highlights a repeating pattern on Bitcoin’s daily timeframe: every time the RSI drops into oversold territory (below 30), it has historically marked a major local bottom followed by a strong recovery.
On the price chart above, each green arrow represents a previous swing low. On the RSI panel, the boxed areas show moments when RSI dipped below 30. Every one of these events has been followed by a noticeable rebound in Bitcoin’s price.
We are now seeing the same setup again. RSI has once again fallen into the oversold zone, aligning with another green arrow on the chart. If history repeats, we could see a similar recovery this time too, just as Bitcoin has done consistently over previous cycles.
Key Points
- Historically on the daily chart, whenever RSI dropped below 30, Bitcoin experienced a recovery soon after.
- The current RSI reading is tapping this same level again.
- This confluence suggests a potential bottoming zone and possible trend reversal.
- While not a guarantee, the pattern has been reliable across multiple past cycles.
Cheers
hexa

BTCUSDTHello Traders! 👋
What are your thoughts on BITCOIN?
Bitcoin has dropped into the marked support zone, where a bullish reaction is likely in the short term. From this area, price may attempt a move back toward the descending trendline.
The key focus will be on how price reacts once it reaches the trendline and the overhead resistance zone.
A confirmed breakout above this resistance could trigger further upside momentum toward higher levels.
Until this breakout occurs, any upward movement will simply be considered a correction.
Don’t forget to like and share your thoughts in the comments! ❤️

GOLD outcome!GOLD started moving up steadily and making higher highs and higher lows very smoothly.Could possible break all time Highs before New Years.

How to build a Healthy Trading MindsetMany traders underestimate how much psychology shapes their results. This guide outlines the foundations of a strong trading mindset that supports consistent and disciplined decision-making.
1. Understand That Emotional Discipline Is a Skill
Trading naturally triggers emotions such as fear, frustration, greed, and impatience. These reactions are not weaknesses; they are human. What separates consistent traders from inconsistent ones is their ability to recognize emotions without acting on them.
A resilient mindset comes from training, not talent.
2. Create Distance Between Yourself and Your Trades
Do not tie your self-worth to the outcome of a single position. A loss does not mean you failed, and a win does not mean you are skilled. When traders begin to link identity to results, they make impulsive decisions.
Use phrases like “this trade” instead of “my trade” to remove ownership bias.
3. Focus on Process, Not Profit
Most traders sabotage themselves by obsessing over the end result. The market does not reward effort; it rewards alignment with probability.
Instead of thinking “How much can I make?”, think “Did I execute according to my plan?”
Your trading plan should define your entries, exits, risk, and market conditions. Follow it even when it feels uncomfortable.
4. Accept Uncertainty as Part of the Game
No setup is guaranteed. Every trade, no matter how perfect, carries uncertainty. Accepting this prevents you from forcing control where none exists.
When you fully accept uncertainty, you no longer fear it.
5. Build Consistency Through Routine
A stable routine reduces mental noise. Examples include:
• Reviewing your plan before each session
• Limiting how many markets you monitor
• Taking breaks after high-stress situations
• Logging your trades with honest notes
When your routine is consistent, your decisions become consistent.
6. Use Losses as Data, Not Drama
A loss is not a personal attack from the market. It is information.
Ask: “What does this loss teach me about my system or my mindset?”
If you can extract value from losses, they become opportunities instead of obstacles.
7. Master Patience
Most trading errors come from acting too soon, not too late. Patience means waiting for your setup without deviation.
If you need to be in a trade at all times, it is no longer trading; it is compulsion.
8. Protect Your Mental Capital
Mental capital is as important as financial capital. Overtrading, revenge trading, and excessive chart time drain your cognitive energy.
Stop trading when you notice fatigue, frustration, or impulsiveness. A clear mind is an advantage.
9. Develop Long-Term Thinking
Think in terms of series, not individual outcomes. A single win or loss means little. What matters is the overall direction of your equity curve.
Professional traders think in months and years. Amateurs think in minutes.
Conclusion
A powerful trading mindset is built through consistency, self-awareness, and emotional control. By focusing on process and discipline rather than short-term results, you create a stable internal environment that supports longevity in the markets.
BTC/USDT | Bitcoin Drops Hard – Key Demand Zones Now in Play!By analyzing the #Bitcoin chart on the daily timeframe, we can see that BTC failed to hold above $104,700, and as expected, this led to a heavy sell-off. First, the price dropped to $94,000, and then a second strong wave pushed it down to $89,000. Bitcoin is now trading around $91,000.
Key supply zones and demand zones are marked on the chart. Important demand levels sit at $88,000, $84,000, and the larger zone at $74,000–$78,000. Watch how the price reacts to these areas.
If Bitcoin wants to recover, it must first hold above these key zones. But if BTC breaks below $74,000, it could open the door for a deeper drop toward $50,000. For now, focus on price reactions at the marked demand levels.
Please support me with your likes and comments to motivate me to share more analysis with you and share your opinion about the possible trend of this chart with me !
Best Regards , Arman Shaban

ASTER/USDT | ASTER Smashes All Targets – Over 40% Profit SecuredBy analyzing the #ASTER chart on the 2-hour timeframe, we can see that after our last analysis, price dropped to $0.91, then entered the demand zone and bounced strongly. It successfully hit all three targets — $1.17, $1.21, and $1.24 — even extending up to $1.285, giving over 40% total return. Currently, ASTR is trading around $1.00, and as long as it holds above the $0.90–$0.97 zone, we can expect another bullish move. The next potential targets are $1.09, $1.15, and $1.29.
Please support me with your likes and comments to motivate me to share more analysis with you and share your opinion about the possible trend of this chart with me !
Best Regards , Arman Shaban

BTCUSD Long: Short-Term Correction Eyes $97,500 ResistanceHello traders! BTCUSD continues to trade within a well-defined descending channel, maintaining a broader bearish structure while forming a series of lower highs and lower lows. Throughout the move, the price has created multiple pivot points along both the upper and lower channel boundaries, confirming the strength of this trend. Inside the channel, Bitcoin developed two notable range phases, each reflecting temporary consolidation before continuing downward. A key formation on the chart is the Rounding Top Pattern, which developed near the mid-channel area. This structure signaled weakening bullish pressure and preceded a sharp decline back toward the channel’s lower boundary. After the breakdown, BTC attempted a small recovery, but price failed at the Supply Zone, creating a rejection that aligned with a bearish breakout confirmation.
Currently, the price is approaching the $97,500 short-term target, which sits close to the lower edge of the Supply Zone. This level has acted as a significant reaction area several times, and the market may retest it before deciding the next direction. As long as BTC trades within the descending channel, the broader trend remains bearish, but short-term corrective moves to the upside are possible due to the strong reaction from demand.
My scenario as long as BTCUSD holds above the Demand Zone ($94,000–$94,500) and shows continued strength, a corrective move toward $97,500 remains likely. This level represents the nearest resistance and aligns with previous supply reactions. A clean breakout above $97,500 would open the way for a deeper correction toward the channel’s mid-line or even the upper boundary. However, if price gets rejected at the supply zone again, sellers may regain control and attempt another push back toward the demand area. A confirmed break below the Demand Zone would invalidate the bullish recovery setup and could trigger continuation of the broader downtrend. For now, the structure supports short-term bullish correction, but overall trend remains bearish until the descending channel is broken. Manage your risk!

Bitcoin - trend is down. New trade is afterBitcoin - trend is down. New trade is after
clear consilidation or coming back into new local value

Crypto Cycle: The Arrogance and The Irony — A Must ReadThe Cycle That Changed Everything
This cycle — which really started in October 2023 — broke every pattern from previous crypto bull runs.
Crypto was created as a rebellion:
Freedom from banks.
An anti-system technology.
Privacy.
Self-sovereignty.
A way for normal people to create wealth without permission.
And yet… somehow the exact people crypto was trying to escape have taken control of it.
Retail investors used to love the idea of owning their finances. No more banks telling them what to do. No more gatekeepers.
Until they arrived.
1 — The Arrogance
The rich run the world — that’s nothing new.
But crypto annoyed them. A lot.
Because crypto allowed ordinary people to do what Wall Street hates most:
Make money without giving the rich a cut.
So what did institutions do?
Simple:
“If you can’t kill it… own it.”
They stopped fighting crypto, took over the market, bought the exchanges, injected billions, partnered with the stablecoin printers, and unleashed industrial-scale manipulation.
The old days of making x10 or x100 on leverage?
Gone.
Retail got liquidated again… and again… and again.
Bitcoin pumped 3 times by billionaires (just look at the three green boxes on the chart).
Retail got excited — then destroyed.
Rinse and repeat.
Eventually, retail gave up.
They moved into gold, silver, or even plain USD — just to stop losing money.
Meanwhile institutions kept pumping Bitcoin and Ethereum artificially, hoping to lure back fresh meat…
but nobody came.
2 — The Irony
Then came October 11, 2025 — the day the curtain fell.
In a dry, illiquid market, Binance did their usual liquidation-hunting game, backed by newly-printed billions from Tether:
2 billion minted one day, 2 billion the next.
They pushed Bitcoin to $126,000.
Then the crash hit.
They chased longs so hard that, in a market with no liquidity, the entire altcoin market collapsed.
Some coins literally went to zero.
Binance had to halt trading.
The liquidation chain couldn’t be stopped.
Some market makers lost everything.
And now they’re furious.
Binance got exposed.
The pump-and-dump machine is broken.
And if they continue, they risk criminal investigations and lawsuits from every direction.
Suddenly BlackRock, Saylor, and friends had a problem:
Their favorite manipulation partner was knocked out.
And that’s when reality hit:
Institutions had pushed Bitcoin so high — without retail — that they found themselves holding billions in assets…
…with nobody left to buy their bags.
Old-time Bitcoin holders realized BTC was compromised and began to sell.
Bitcoin maxis rekt the institutions.
The billionaires who bought at $120k got destroyed by the exact people they planned to destroy.
Karma doesn’t miss.
Even Eric Trump started selling — too late.
Bitcoin fell under $89k, and there were no buyers left.
3 — The Lesson
Institutions need to understand one thing:
Crypto is not for institutions.
The tech? Sure.
The coins? No.
Crypto without retail is like a vampire trying to drink its own blood.
Pointless and self-destructive.
And retail won’t return for “fractional Trump coin” or corporate-approved BTC.
Retail wants:
x10, x100, x1000.
That means one thing:
ALTSEASON.
If institutions want liquidity to exit, they must engineer an altseason and share some profits.
Because without retail, they’re stuck in their expensive echo chamber holding overpriced bags that nobody wants.
And if they do create an altseason?
Retail will dump on them harder than ever — watching TradingView and influencers, selling every rally right back into the institutions’ faces.
Wall Street, stick to Wall Street.
Leave crypto to the crypto degenerates.
It’s a wild jungle, and you were never prepared.
#CryptoCycle #BitcoinCrash #AltseasonWhen #CryptoHumor #MarketManipulation #InstitutionsRekt #BinanceDrama #RetailVsWhales #CryptoReality #KarmaInCrypto #CryptoStory #PattayaCryptoDegens

BTCUSD: Buyers Aiming for a Move Toward 99,000 ResistanceHello everyone, here is my breakdown of the current Bitcoin setup.
Market Analysis
BTCUSD has recently completed a strong downward phase inside a well-defined Downward Channel, where price continuously formed lower highs and lower lows. After reaching the Support Zone around $94,500–$95,200, buyers stepped in and created a fake breakout, followed by a quick recovery — a sign of weakening seller pressure. Following this rebound, Bitcoin formed an Inverse Head and Shoulders pattern, confirming a potential bullish reversal. Price has now broken above the Triangle Resistance Line, signaling the first structural shift from bearish to bullish.
Currently, BTCUSD is consolidating just above the $95,500–$96,000 support zone, which now acts as a retest area for the breakout. As long as BTC stays above the Triangle Support Line, bullish momentum remains intact, and the market structure favors further upward movement. The nearest target for buyers is the $99,000 Resistance Zone, which previously acted as a strong supply area. A successful breakout above $99,000 would confirm bullish continuation and open the way toward higher resistance levels. If price fails to hold above support, a short-term pullback toward the lower triangle boundary may occur before buyers try to regain control.
My Scenario & Strategy
I expect BTCUSD to maintain its bullish bias as long as price trades above the Triangle Support Line and the key support zone. Potential long entries remain valid on retests of the $95,500–$96,000 area, with a primary target at the $99,000 Resistance Zone (TP1).
A confirmed breakout above $99,000 would strengthen bullish momentum and open the next leg upward. However, a breakdown below the triangle structure may lead to a deeper correction toward $94,500. For now, sentiment remains bullish, and Bitcoin appears ready for a continued recovery within the new reversal structure.
That's the setup I'm tracking. Thank you for your attention, and always manage your risk.

#BTC – Isn’t it time to buy?#BTC – Isn’t it time to buy? 🚀
By analyzing market structure and outside news, BTC is approaching the zone where I’d seriously consider entering .
📍 88k–76k is the key range I’m watching for potential buys, aiming for 15–40%+ profit with a 15% stop los s.
⚡️ Important: Wait for LTF entry sign – don’t jump in blindly . Always do your own research before making a move.
#CryptoTrading #Bitcoin #BTC #ScalpTrading #CryptoAnalysis #BTCScalp #CryptoStrategy #TradeSmart #HODL #BitcoinAnalysis

Understanding Risk Management in TradingWelcome everyone back to Trading view article by King_BennyBag.
In today’s post we will discuss how one can understand risk management in trading, and action it.
We will start off by defining what risk management is.
Risk management definition:
Risk management is the process of identifying your current capital and assessing what you can afford to invest and lose. Never to see again.
It involves identifying risks, assuming risks and ensuring you have a planned response for before, during and after a trade.
CAPITAL IN RISK MANAGEMENT:
In the past, I have stated that the goal of trading is to “PROTECT” your capital first. Once you know how to protect it, you can then multiply it and risk bit by bit.
To take on proper risk management, you must decide what amount you will allocate to your investments or trades. For example – you risk only 1% of your capital on every trade.
INVEST WHAT YOU CAN AFFORD TO LOSE:
You should only do trading with the funds that you can AFFORD to lose, even then you must be cautious and apply the process above to the same capital. Doing this eliminates the emotional pressure factor and avoids decisions that are driven by Fear of Missing Out. (FOMO)
Before Trading, set a clear number on what you can lose (NEVER to see again) without it affecting your life.
IDENTIFYING RISKS:
Relating to my previous posts, you must have a defined trading plan/edge. This plan must allow you to identify market volatility, news events, psychological mistakes, or technical invalidation points. These are risks that must be identified BEFORE trading.
Knowing these will allow you to apply the right position size correctly.
ASSUMING RISKS:
When it comes to assuming risks, (most people don’t factor this in) it means to accept the potential scenario of you losing, before the trade is actioned.
Your stop loss (always use a stoploss!) must be defined in a way that will not get yourself liquidated. You must calculate the right position size and learn to accept the outcome of the trade, and the mental effects it has on you.
Doing this, the trades & the process becomes mechanical. No longer would it be emotional.
If the loss is too big and you take it anyway. You should not be taking that trade as it will encourage revenge trading.
PLANNING RESPONSES BEFORE, DURING and AFTER RISKS:
With trading & risk management, you must have a pre-defined response for before, during and after trades. Your risks must be set.
Before the trade, you should have an entry, SL & TP set. Along with an invalidation level (if price hits a specific point, you DON’T take the trade) and a maximum risk, eg “I’ll risk max $5,000 on this trade”
During the trade, you must stick to the plan, don’t adjust your SL, or TP if it’s not part of your strategy.
After the trade, if you win, or lose, find out why. Was it a valid trade, did it follow your edge? Or did you take a blind gamble. If you lose, figure out why, if you won, figure out how you could have scaled it upwards.
Applying these 3 factors allows the cycle of discipline to develop and grow. It then removes randomized decision making.
Risk management is a crucial Key in trading. Without it – you have already lost.
I have attached the 3 KEYS to trading success below. Here I go in depth on what an individual must master to be successful in trading.
Bitcoin (BTCUSDT) – Short-Term Bearish StructureHi!
The chart shows BTC moving inside a descending channel, with consistent lower highs and lower lows confirming a controlled downtrend. Recent price action attempted to push back into the QML (Quasimodo Level) area, but the reaction there shows clear rejection, suggesting supply remains in control.
Price is now falling toward the lower boundary of the channel, where a short-term bounce is possible. However, unless BTC breaks above the QML zone and the descending trendline, the broader expectation remains bearish.
The projected path suggests:
A drop into the channel low,
A corrective pullback,
And then a continuation lower toward the next major support zone around 89,700 – 89,800.
Overall, momentum and structure both support a bearish continuation unless buyers manage to reclaim the supply zone above.

Bitcoin | BTC | Healthy Pullback Before Another Pump?So much negativity about this Bitcoin pullback makes the contrarian in me says this is purely a healthy pullback to its current historical mean (see band /lines on chart). I suspect a bounce between $79,800 and $89,720 to potentially match previous highs or form new ones. If not, and the price falls massively through this area... watch out for a wild ride across the markets...

Bitcoin Can reach 93000 Bitcoin could reach the price level of $93,000 in the coming weeks.
There is a possibility that after breaking the midline of its long-term weekly channel, it may move up to the indicated FVG level to fill the remaining unfilled orders.
After that, it could start a new bullish rally aiming for the upper boundary of the channel.
This is purely an analysis and should not be considered as financial advice.
Buying or selling is at the trader’s own risk.

Stop!Loss|Market View: GOLD🙌 Stop!Loss team welcomes you❗️
In this post, we're going to talk about the near-term outlook for GOLD ☝️
Potential trade setup:
🔔Entry level: 3992.755
💰TP: 3853.896
⛔️SL: 4067.971
"Market View" - a brief analysis of trading instruments, covering the most important aspects of the FOREX market.
👇 In the comments 👇 you can type the trading instrument you'd like to analyze, and we'll talk about it in our next posts.
💬 Description: Gold is moving in line with the previous sell scenario, and this medium-term trade remains relevant. In the shorter term, additional selling below the point of control (POC) level, around 3992.755, could also be considered. An alternative short-term scenario is selling near 4100, where the last accumulation is located. The downside target is currently considered to be in the 3800-3900 area, but a decline to 3600-3700 remains possible.
Thanks for your support 🚀
Profits for all ✅

BTC Weekly View !BTC / USD
Bitcoin (BTC) followed my previous analysis on October 30th, dropping from $110,000 to its current price of $96,000. check here
What's Next?
Take a Look at the weekly chart:
Bitcoin is currently at a "do or die" support level (trend line + 50-week moving average).
This moving average has been a turning point in previous cycles.
If the price breaks below this level, it will confirm a mid-term bear trend with minimal target around 74k so keep an eye on this chart.

BRAVE NEW COIN TOP (EXPERIMENTAL)BNC:BLX
It's important to note that cryptocurrency markets are highly volatile, and such forecasts are speculative. Investors should conduct thorough research and consider their risk tolerance before making investment decisions.

BTCUSD Technical Analysis – Is a Correction on the Way?BINANCE:BTCUSD is currently trading inside a well-defined falling wedge, and the price is pressing against the lower boundary of the pattern. This level could serve as dynamic support, and if a strong rejection occurs, we may see a corrective move toward the 102,000 resistance area.
If sellers successfully defend that zone, the bearish structure remains intact, increasing the likelihood of BTCUSD moving back down to lower price levels. However, if price breaks above this resistance, a deeper correction toward the upper boundary of the wedge could unfold.
At this stage, closely monitoring candlestick signals and volume activity around this key area is essential for spotting high-quality selling opportunities. Ensure every trade setup is backed by solid confirmation, and always maintain strict risk management.
If you have any thoughts or additional perspectives on this setup, I’d be happy to hear them. Feel free to share your opinion in the comments!

Check for support near the M-Signal indicator on the 1M chart
Hello, fellow traders!
Follow me to get the latest information quickly.
Have a great day.
-------------------------------------
(USDT 1D Chart)
(USDC 1D Chart)
USDT is the major currency that influences the coin market.
The USDT and USDC charts are moving in opposite directions.
This decline appears to be driven by funds flowing out of USDC.
Once the USDC gap decline stops, funds flowing in through USDT are expected to drive the coin market higher.
-
(USDT.D 1M Chart)
For the coin market to show an upward trend, USDT dominance must remain below 4.91 or show a downward trend.
We need to see if the price can face resistance around the Fibonacci level of 0.618 and turn downward.
If not, we should consider a response plan, as a rally toward 7.13 is expected.
-
(BTC.D 1M chart)
For an altcoin bull market to begin, it must either remain below 55.01 or show a downward trend.
Therefore, for the bull market we're waiting for to occur, both USDT dominance and BTC dominance must decline.
If USDT dominance declines while BTC dominance rises, a bull market will emerge, with only BTC rising.
--------------------------------------------------
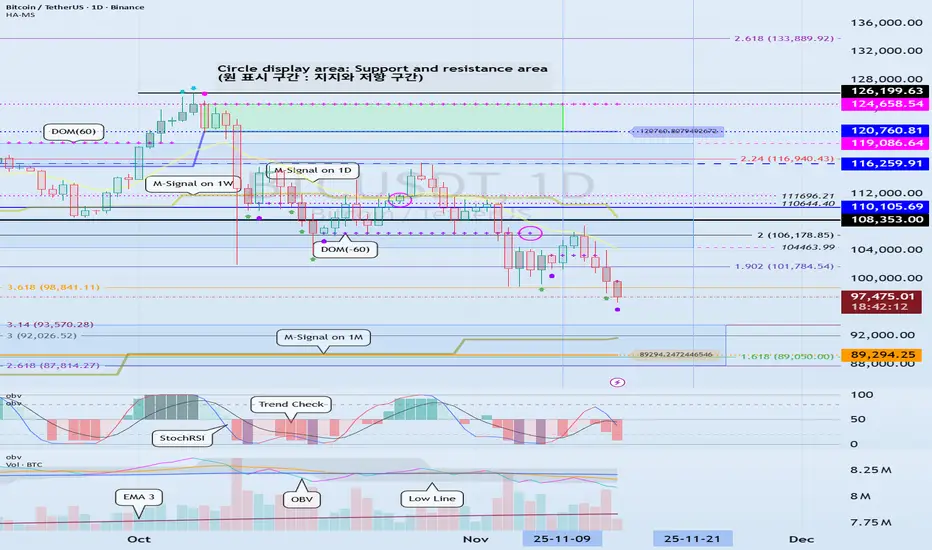
(BTCUSDT 1D Chart)
The key is whether the price can touch the M-Signal indicator on the 1M chart and turn bullish.
At this point, it's crucial to maintain the price above 89294.25.
If not, a step-down trend is likely.
To turn bullish, the price must remain above the M-Signal indicator on the 1W chart.
At this point, it's crucial to maintain the price above the newly created HA-High indicator point of 110105.69 on the 1M chart.
If not, the price may pretend to rise but then fall again, so you need to consider countermeasures.
This is a basic trading strategy within the box range: buy between DOM(-60) and HA-Low and sell between HA-High and DOM(60).
If the price rises in the HA-High ~ DOM(60) range or falls in the DOM(-60) ~ HA-Low range, you should switch to trend trading.
To do this, we should consider the movements of the StochRSI, TC (Trend Check), and OBV indicators.
To sustain the uptrend after breaking above a key point or range, the StochRSI, TC, and OBV indicators must show upward trends.
At this point,
1. The StochRSI indicator should not have entered an overbought zone.
2. The TC indicator should remain above zero.
3. The OBV indicator should remain above the High Line.
Therefore, check the movements of the StochRSI, TC, and OBV indicators at the support and resistance levels depicted on the 1M, 1W, and 1D charts and consider whether you can trade accordingly.
Based on the current price range, the key points or ranges are:
- 87814.27-93570.28
- 110105.69
- 120760.81-124658.54
I believe the three ranges above are important points or ranges.
Therefore, when the price is near these ranges, you should check the movements of the StochRSI, TC, and OBV indicators to determine a response plan.
-
Thank you for reading to the end.
I wish you successful trading.
--------------------------------------------------
- This is an explanation of the big picture.
(3-year bull market, 1-year bear market pattern)
I will explain in more detail when the bear market begins.
------------------------------------------------------
BTCUSDT.P - November 6, 2025BTCUSDT is currently consolidating above a rising trendline, with potential breakout zones at $104,496 for a bullish move targeting $106,659, or below $102,684 for a bearish continuation toward $101,164. The setup suggests a breakout-driven trade depending on which level is breached first.

Fear & Greed Index — Rebuilt as a Macro Oscillator for CryptoThe Fear & Greed Index is everywhere — a popular way to gauge market sentiment.
But it's usually just a mix of volatility, momentum, and social buzz...
📉 Not exactly macro.
This script is a technical reinterpretation of the Fear & Greed concept — but grounded in real, measurable economic behavior .
🧠 The Core Idea
This indicator is powered by the Copper/Gold ratio , a time-tested signal used by economists and institutional traders to track macroeconomic cycles:
- 🟢 When Copper outperforms → the economy is likely expanding → risk-on → Greed
- 🔴 When Gold outperforms → the economy may be contracting → risk-off → Fear
Copper represents industrial growth , while Gold signals defensive capital flows .
We track this ratio over time using a Z-Score oscillator to identify when sentiment is statistically stretched in either direction — highlighting moments of macro-level greed or fear.
📊 Why It Matters for Crypto
Crypto doesn’t live in a vacuum.
It's highly sensitive to the broader risk environment.
This oscillator gives you a macro lens to help:
- Anticipate bullish or bearish shifts in crypto markets
- Avoid common emotional traps at sentiment extremes
- Build entries or exits around macro confluence zones
It doesn’t tell you when to buy or sell — it tells you when the market context is shifting .
🔧 How to Use It
- Watch for the Z-Score entering > +2 (Greed) or < -2 (Fear)
- Use it to confirm broader risk-on/off behavior
- Combine with BTC or ETH price for potential lead/lag relationships
- Customize the tickers to test other macro pairs (e.g. SPX/VIX, BTC/DXY)
📈 Built with Pine Script v6
🔍 Default Tickers: CAPITALCOM:COPPER vs TVC:GOLD
📦 Fully customizable inputs, clean visual design, alert-ready
💡 Use this to trade with context — not emotion.
If you found this useful, give it a like and drop your feedback or improvements below 👇
