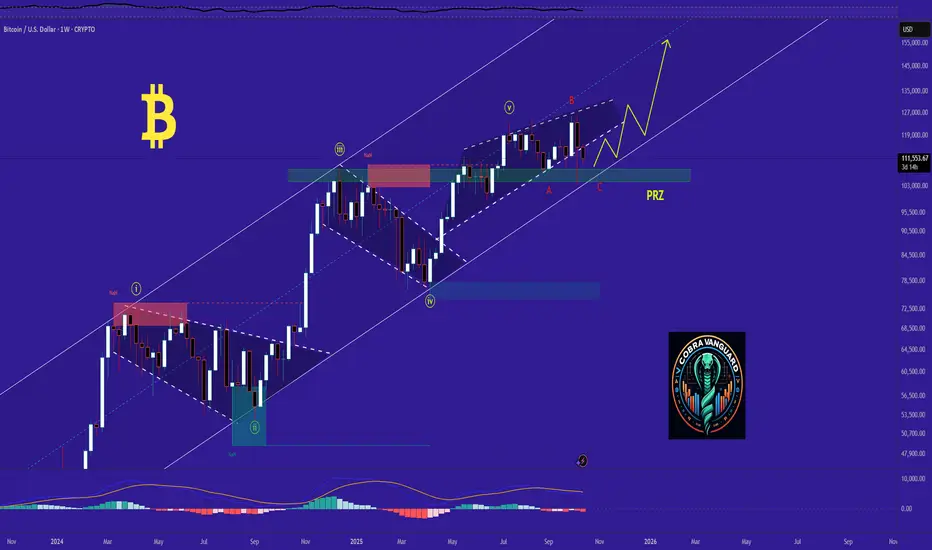
$BTC Bottom soon? Expanded flat?CRYPTOCAP:BTC appears to printing wave Y of a running flat correction (or expanded flat)
The rules?
X pokes above all time high on a large 3-wave move and is often rejected even harder.
Y ends above W, if it goes below it is an expanded flat instead and likely ends just below W. Same outcome….
Also the daily 200EMA, macro support trend-line, High Volume Node support and a pop lower could give hidden bullish divergence in daily RSI.
Daily RSI often does not make it into oversold on Bitcoin.
Safe trading
Bitcoin (Cryptocurrency)

bitcoin Outlook after the Dip. What to expect NOW?After breaking out of the descending wedge, the price is now working to complete its corrective wave. This move could extend down to the bottom of the ascending channel before initiating a new bullish wave.
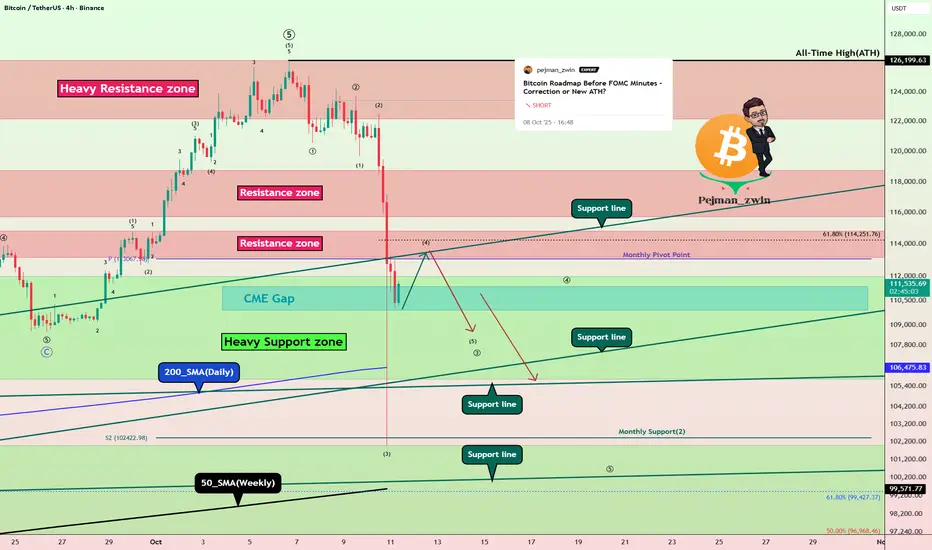
Bitcoin Roadmap: Is a Major Correction the Next Stop?As I expected from the previous analysis , Bitcoin did start to drop and hit its targets .
Now, with the news that the U.S. might impose a 100% tariff on China , we saw Bitcoin sharply sell off last night. Actually, as I mentioned in my previous ideas , the rally from about $109,000 to around $126,199(ATH ) (which was a new all-time high for Bitcoin) had relatively low volume. That was a sign that a correction might be on the way, and last night’s news just acted as a trigger to speed it up.
In fact, what took Bitcoin 10 days to climb was reversed in about 4 days , showing how strong the sellers are right now.
Educational tip: You can use volume candles on TradingView to see which candles had higher volume—the thicker the candle, the more significant the move.
Now, the big question: will Bitcoin keep dropping or bounce back?
Right now, it’s sitting near a cluster of Support lines and close to the daily 200_SMA(Daily) and the 50_SMA(Weekly) , as well as a Heavy Support zone($111,980-$105,820) . Last night’s drop was basically the first test of these supports .
Since it’s the weekend and volumes are usually lower, we don’t expect a huge downward move in the next 48 hours.
Bitcoin might do a pullback to the broken Resistance zone($114,820-$113,180) and then continue its drop.
According to Elliott Wave analysis , Bitcoin seems to be completing a microwave 4 of the main wave 3 .
I expect that after Bitcoin completes , we might see it continue downward and fill the CME Gap($111,355-$109,915) early in the next week.
So, do you think the major correction for Bitcoin has started or not? Let me know what you think!
Note: In case the Support lines break, there’s also a chance that we might see a Death Cross (where the 50-day moving average crosses below the 200-day moving average), which could signal further bearish momentum.
Note: Around the $108,000 level, we have huge buy orders stacked up, which might act as a significant support zone.
Please respect each other's ideas and express them politely if you agree or disagree.
Bitcoin Analysis (BTCUSDT), 4-hour time frame.
Be sure to follow the updated ideas.
Do not forget to put a Stop loss for your positions (For every position you want to open).
Please follow your strategy and updates; this is just my Idea, and I will gladly see your ideas in this post.
Please do not forget the ✅' like '✅ button 🙏😊 & Share it with your friends; thanks, and Trade safe.
BTC IS WEAK BUT NO CLEAR TRADING SETUPSMorning folks,
So, today is a specific update. We do not see any clear trading setups for now. But here are a few thoughts. First is - BTC has failed to completed an AB=CD target, dropped down. This is the sign of weakness. And it is not surprising. Sentiment on the market has dropped under the floor. Recent events clearly showed that BTC is non-regulated and highly manipulated market by politicians (Hello DonnY) and his insiders.
Second - military rhetoric in media has increased in multiple times. Demand for safe haven is raising, which is pressing on BTC.
Finally, US liquidity issues are not disappeared. All these three factors make us suggest further BTC fall.
Now price stands in triangle, with no bright patterns, suitable for position taking. That's why we prefer to wait a bit.

Bitcoin Under Pressure: 108-110k Zone Support Now CriticalI’m struggling to maintain my bullishness lately — not because of Friday’s crash, but because, regardless of what timeframe I analyze, I just can’t find a convincing bullish bias anymore.
On the weekly chart, the structure looks increasingly fragile. After breaking above the 108k zone in mid-summer, Bitcoin pushed to a new ATH around 125k, then pulled back to retest the broken resistance. That was fine — a normal retest within a healthy uptrend. But what followed wasn’t.
The price made a new, but very anemic all-time high, showing a clear lack of momentum, and then dropped again to the same support area. Even if this drop was provoked, the fact that BTC returned so quickly to that zone makes me question the strength of any potential reversal.
From a technical standpoint, if we ignore the reasons and look only at the chart, the last 3.5 months resemble more of a distribution phase rather than a solid consolidation before another leg up.
If Bitcoin breaks below the 108k support, the next logical target sits around 100k. But considering the long-term structure I’ve shown on the weekly chart, I wouldn’t be surprised to see a deeper correction toward 90k.
The bulls are still in the game, but they’re losing ground — and unless BTC shows strength soon, the market might be preparing for another leg down before any sustainable recovery

Rotation Gold to BTCEvery time gold reaches the top, Bitcoin has a 20% correction. Then money flows from gold to the Bitcoin market, and Bitcoin starts a rally.

Phemex Analysis #109: Where does Bitcoin (BTC) Go Next?!Last Friday—October 10, 2025— PHEMEX:BTCUSDT.P endured a historic flush. In a matter of hours, price slipped from the low-$120Ks into the low-$100Ks as leverage unwound across venues. It looked dramatic, but the post-mortem reads more like a broad‐based deleveraging than a structural failure. Since then, BTC has steadied around the low–$110Ks, with intraday swings as traders slowly rebuild risk.
Context in one breath.
A late-week macro wobble hit an over-levered market. Forced sellers did the rest. By mid-week, the tone shifted from “spiraling” to “stabilizing” as the market defended the $110K region and funding normalized.
Possible Paths From Here
1) Reclaim & Run — rebuild above $115K → $120–$123K retest
After flushing weak longs, BTC grinds higher, then reclaims $115K on improving spot demand. A strong daily close above $118K invites a retest of the $120–$123K band (pre-flush supply). A clean break there opens room toward $128–$130K.
Pro Tips:
Entry: Stagger in on a daily close > $115K; add on a confirmed reclaim of $118–$120K.
Risk: Initial stop below the reclaim zone (~$110.5K), then trail beneath higher lows.
Targets: $120–$123K first; if momentum broadens, stalk $128–$130K.
2) Chop & Rebuild — base between $108–$116K
The market digests the shock. BTC ranges $108–$116K, volatility compresses, open interest stays sober, and spot quietly absorbs supply. This is where patience—not prediction—wins.
Pro Tips:
Plan the box: Accumulate near $108–$110K, trim near $115–$116K; avoid mid-range chop.
Volume tells: Expansion at range edges often telegraphs the break direction.
Tools: Consider light grid/range tactics with clear invalidation below $108K.
3) Second-Leg Flush — lose $110K → $105K, even $100–$102K
If headlines sour or liquidity thins and BTC closes below $110K on heavy sell volume, $105K (prior liquidity pocket) is exposed. A disorderly tape can sweep toward $102–$100K before bargain hunters step in.
Pro Tips:
Defense first: Reduce exposure on a decisive daily close < $110K.
Wait for stabilization: Look for capitulation wicks + waning sell volume before redeploying near $105K / $102–$100K.
Flip criteria: A strong reclaim of $110–$112K with breadth is your cue to re-engage.
Conclusion
If BTC reclaims $115K and $118–$120K holds → ride the trend toward $123K, then $128–$130K.
If we range $108–$116K → harvest the box with tight risk.
If $110K snaps on heavy sell volume → stand aside and let $105K → $102–$100K stabilize.
Trade the levels. Respect the tape.
Let structure—not the memory of the flush—drive your decisions.
🔥 Tips:
Armed Your Trading Arsenal with advanced tools like multiple watchlists, basket orders, and real-time strategy adjustments at Phemex. Our USDT-based scaled orders give you precise control over your risk, while iceberg orders provide stealthy execution.
Disclaimer: This is NOT financial or investment advice. Please conduct your own research (DYOR). Phemex is not responsible, directly or indirectly, for any damage or loss incurred or claimed to be caused by or in association with the use of or reliance on any content, goods, or services mentioned in this article.

SOLUSDT – Weak rebound, bears back in controlAfter a sharp drop on October 14, Solana made a slight recovery but quickly hit resistance at the downtrend line — where sellers stepped back in strongly. The $208 zone continues to act as a tight lid on price action, signaling that current buying pressure isn’t strong enough for a reversal.
With U.S.–China trade tensions still simmering, the overall crypto market — including SOL — remains under pressure. If the price fails to break above this descending trendline, SOL could likely fall back toward the $188 support zone, or even $175 in the next move.
In short, the main trend remains bearish, and current rebounds look more like opportunities for sellers to reload for the next push downward.

ETH/USDT – Ethereum’s Downtrend May ContinueAlthough Ethereum saw a slight recovery on October 14th, it remains under significant pressure from US-China trade tensions, negatively impacting the financial markets and Ethereum’s value. The US imposing 100% tariffs on Chinese goods, along with retaliatory measures from China, has raised concerns about global economic stability. These factors have pushed ETH/USDT down to a low of $3,893.
The chart shows that Ethereum is trading within a clear downtrend channel, with $4,130 acting as a strong resistance level. After hitting this resistance, Ethereum may continue to decline towards $3,530 in the coming days if there is no positive shift in the fundamental factors.
With the market still uncertain and US-China trade tensions unresolved, Ethereum is likely to remain under downward pressure in the short term.

BTC/USDT – Downtrend ContinuesBitcoin is facing downward pressure after the escalation of US-China trade tensions. Although President Trump made more conciliatory remarks, which helped ease short-term concerns, the global economic uncertainty remains a major factor driving BTC/USDT into a downtrend.
On the chart, BTC/USDT is moving within a clear downtrend channel. Despite a slight recovery, the price is currently fluctuating around $113,129 and could continue to adjust towards the 106,500 USD and 101,800 USD targets in the near term.
With ongoing macroeconomic instability and no strong signs of recovery, Bitcoin may continue to decline in the short term.

BTC 4HThe most likely scenario is an upward move to liquidate well-positioned shorts, reaching the 116k level. This would result in a rebound to the 55-period moving average and further decline.

ETH Game Plan – FTKZ ModelETH Game Plan – FTKZ Model
📊 Market Sentiment
After the sharp 10/10 crash triggered by Trump’s 100% tariff announcement on Chinese imports, altcoins saw heavy liquidations some exceeding -80%.
On 12/10, Vice President Vance clarified Trump’s remarks, causing a temporary rebound.
However, Trump’s 15/10 statement reaffirming a trade war with China reignited selling pressure.
Sentiment remains bearish, as volatility and geopolitical risk continue to shape short-term direction.
📈 Technical Analysis
ETH maintains a bullish structure on the weekly timeframe.
If the weekly candle closes below 3350$, it would signal a potential bearish reversal.
Price is currently retracing toward the HTF Key Zone, aligning with both an FFVG and HTF trendline confluence ideal for long setups if support holds.
📘 Model to be used – FTKZ Model (HTF FFVG + Trendline + Key Zone)
1️⃣ Determine the HTF weekly trend — trade only in that direction.
2️⃣ Identify the HTF Fair Value Gap (FFVG) that price may rebalance.
3️⃣ Confirm confluence with HTF trendline support.
4️⃣ Locate the HTF Key Zone showing strong order flow.
5️⃣ Enter after LTF confirmation.
📌 Game Plan
I will be watching ETH to test the 3350$ HTF Key Zone (weekly swing liquidity & monthly FFVG).
If the weekly close forms back above 3350$, I will expect continuation toward higher levels.
🎯 Setup Trigger
Weekly close above 3350$ confirming bullish continuation.
📋 Trade Management
Stoploss: Weekly close below 3350$
Targets: TP1: 4300$ | TP2: Bearish Trendline
Move stoploss to breakeven after TP1 hits.
💬 Like, follow, and comment if this breakdown supports your trading! More setups and market insights coming soon — stay connected!
⚠️ Disclaimer: This content is for informational and educational purposes only and does not constitute financial, investment, or trading advice. Always DYOR before making any financial decisions.

BITCOIN SIGNAL: THIS IS WHAT WILL HAPPEN NEXT!!!(smash it) Yello Paradisers! Enjoy the video!!
And Paradisers! Keep in mind to trade only with a proper professional trading strategy. Wait for confirmations. Play with tactics. This is the only way you can be long-term profitable.
Remember, don’t trade without confirmations. Wait for them before creating a trade. Be disciplined, patient, and emotionally controlled. Only trade the highest probability setups with the greatest risk to reward ratio. This will ensure that you become a long-term profitable professional trader.
Don't be a gambler. Don't try to get rich quick. Make sure that your trading is professionally based on proper strategies and trade tactics.

Trade Setup $BTCIntraweek Trade Setup for BINANCE:BTCUSDT.P
Several failed auctions on the Weekly chart showed bearish momentum; however, the Daily structure remains intact, invalidating that bearish bias. Current price action suggests Bitcoin is accumulating below resistance, a typically bullish pattern.
The Weekly candle closed above the $98,115.4 V-Level, a key area that has acted as support multiple times already; this breakout hints at further upside potential.
On the Daily chart, price confirmed a bullish Failed Auction at the $112,615.3 support V-Level, with today’s candle closing back above it. OI & CVD data indicate heavy market selling with no follow-through, meaning sellers are likely getting trapped, most of that pressure originated from the largest buy-side liquidation cascade in crypto history.
Intraday, the range is set between $122,497.0 and $101,516.5. I’m watching for a mid-range long as the Daily FA built an Internal Over & Under pattern.
⚠️ This remains a risky setup given the location, but if BTC sweeps the range lows, I’ll look for a Failed Auction long from there, or a breakout from the current range.

TradeCityPro | Bitcoin Daily Analysis #197👋 Welcome to TradeCity Pro!
Let’s go over the Bitcoin analysis; today Bitcoin is still in a downtrend, so let’s review the market together.
⏳ 1-Hour Timeframe
After the double top that was activated yesterday near the 0.5 Fibonacci level, Bitcoin entered a corrective phase after reaching the double top target.
✨ The double top peaks formed around 115,698, but after completing the downward move and starting the correction, the price created lower highs around 113,218, and now with the break of 111,975, a new high-volume downward move has started.
📊 The price is moving back toward the supply zone it had, and reaching this area is not a good sign for the upward trend we see on higher timeframes.
🔽 The more the price approaches this zone and reacts to it, the weaker the zone becomes, and the probability of it breaking increases in subsequent attempts.
✔️ Currently, this is the third time the price is approaching this zone, and each time it comes with higher volume and a stronger bearish structure; if this pattern repeats several times, the zone could break.
🔍 Whether the price breaks or finds support at this zone can determine the market’s direction for the upcoming period.
⚡️ If the zone breaks, Bitcoin could enter a corrective and range-bound phase for weeks or even months, and we wouldn’t be able to open positions effectively in that environment.
📈 If the zone holds as support, with a break above 115,698, we would get confirmation of Bitcoin’s bullish trend and could expect the next upward move to begin.
❌ Disclaimer ❌
Trading futures is highly risky and dangerous. If you're not an expert, these triggers may not be suitable for you. You should first learn risk and capital management. You can also use the educational content from this channel.
Finally, these triggers reflect my personal opinions on price action, and the market may move completely against this analysis. So, do your own research before opening any position.

MARA: shoulders done, now walk toward the targetOn the daily chart, MARA completed a textbook inverse Head & Shoulders reversal with a clear breakout above the descending trendline. A corrective pullback followed, and the price is now heading into the key buy zone at 15.21–15.77 - aligning with the 0.72 and 0.79 Fibonacci retracements, and the upper boundary of the broken channel. This is the area to watch for a potential continuation of the bullish impulse.
Volume on the breakout was above average, confirming strong buyer interest. The EMAs are trending below the price, supporting the upward structure. The first target is located at 21.57 (previous resistance), with a potential extension to 28.77 (Fibonacci 1.618).
Fundamentally, MARA remains highly correlated with BTC and crypto sentiment. As interest returns to crypto-related assets due to ETF flows and possible Fed easing, mining stocks like MARA gain attention. Recent reports also show improved production efficiency and lowered costs - a tailwind for bulls.
Tactically, the best setup would be a confirmed reaction from the buy zone — whether a strong candlestick formation, volume surge, or reclaim of a key level. If that happens, aiming for 21.57 and 28.77 becomes a solid plan.
The pattern played out - now it's time for the market to walk the talk.

BTC/USDT Analysis. Expected Range-Bound Movement
Hello everyone! This is the trader-analyst from CryptoRobotics, and here’s your daily market analysis.
Yesterday, Bitcoin rebounded from the lower boundary of the high-volume zone at $113,600–$110,600, showing a modest upward move. Upon reaching local resistance, selling pressure returned — currently, sell-side activity dominates according to delta data. However, the absence of strong bearish candles suggests that price action is more likely to drift toward the upper boundary of the current range.
For now, the scenario remains unchanged: we expect continued rotation within the $110,000–$116,000 range. The breakout priority remains to the upside, supported by several factors — stop-hunting below key levels, preservation of the broader flat structure, and evidence of selling absorption in delta.
The bearish alternative would be a firm consolidation below the local low of $109,500, which could open room for a deeper decline toward $97,000.
Buying Zone:
$113,600–$110,600 (high-volume area)
Selling Zone:
$120,900–$124,000 (volume zone)
This publication does not constitute financial advice.

BTC TECHNICAL UPDATE BTC TECHNICAL UPDATE
Price action still bearish in structure, hunting liquidity below. 107 ich
Now we’re trading around −1.5 deviation, with technical volume metrics confirming heavy, controlled selling.
Order flow remains high-volume bearish, but the intent looks mechanical:
liquidity grab → reset → build new base.
Current map
Targeting the 107ich zone — likely final liquidity pocket of this leg.
Below that, bids start stacking, hinting that large players already positioned.
If volume compresses and delta flips positive, expect shift back range.
Execution note:
Treat this as high-frequency setup, not a swing setup.
Keep size light, manage per-trade risk — structure says “controlled drive,” not “capitulation.”
—
Daniel Fadeley

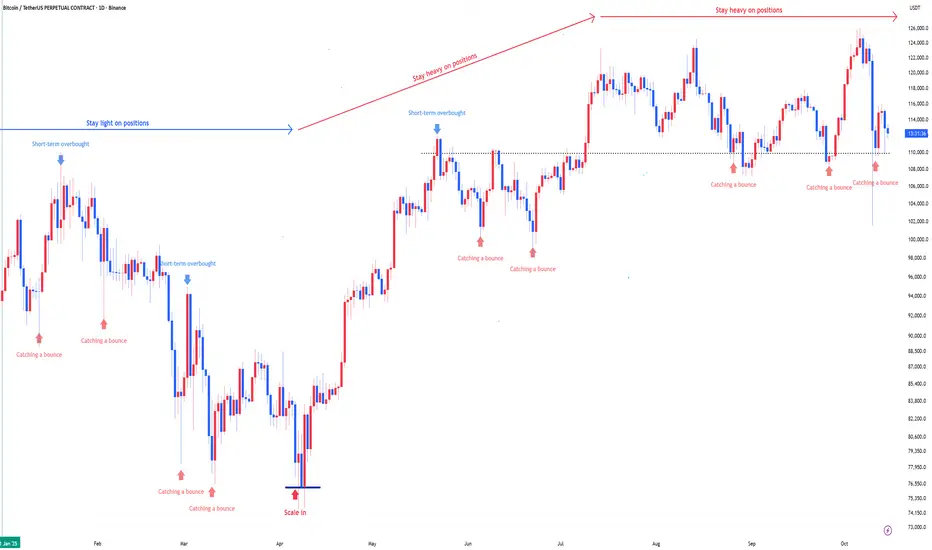
Bitcoin : Stay heavy on positionsBitcoin : Stay heavy on positions (3x)
Maintaining the same outlook as before.
** This analysis is based solely on the quantification of crowd psychology.
It does not incorporate price action, trading volume, or macroeconomic indicators.
Still believe in a short position on bitcoin
Yes, stopped out
But I insist on the direction of my position in the comming days.

BTC 1H Box Breakout Setup | D1👋 Hey everyone! Hope you’re doing great!
💥 Welcome to Satoshi Frame — today we’re diving into the 1-hour Bitcoin analysis. Stay tuned and follow along!
👀 On the 1-hour timeframe of Bitcoin, we can see that after its recent drop, Bitcoin has entered a one-hour consolidation box. The top of this box is around $115,802, and the bottom is at $110,224. A breakout from this box could lead to the next impulsive move. Currently, Bitcoin’s price is near the midline of the box at $113,222 — and if it breaks and stabilizes above this level, Bitcoin could start moving toward the top of the box and potentially break above it.
Notice that Bitcoin reacted to the buyer-maker zone near the bottom of the box, showing a reversal pattern. With buying pressure pushing it upward and a higher low forming, the probability of a midline breakout has increased.
🧮 Looking at Bitcoin’s RSI oscillator, it’s currently near the static resistance around the 54 range. If RSI breaks and stabilizes above this level, long-trade momentum is likely to increase, which could help Bitcoin break through the midline and become more bullish.
🕯 Let’s first discuss the maker-buyer zone, which acts as a major support area for buyers and institutions that accumulate their positions here. This area tends to create counter-direction reactions in Bitcoin. Right now, Bitcoin has formed a higher low just below the midline and is showing increasing buying volume, with larger candle sizes appearing on the chart.
🧠 For Bitcoin’s trading setup, once the midline breaks, we can consider entering a position, forming a potential long scenario:
↗️ Long Position Scenario:
If Bitcoin breaks and stabilizes above $113,222, accompanied by an RSI breakout above 54 and a rise in buying volume, it could move toward the top of the box and provide a solid long opportunity.
❤️ Disclaimer : This analysis is purely based on my personal opinion and I only trade if the stated triggers are activated .

BTC/USD (4H Analysis) — October 15, 2025Bitcoin is currently consolidating below the minor supply zone (113.5K–114.5K) and above the local demand zone (110.8K–111K).
The overall market structure remains bearish, with clear lower highs and lower lows forming after a strong rejection from the major supply zone at 120K–122K.
Key Zones
🟥 Major Supply: 120K–122K → heavy distribution zone from previous top.
🟥 Minor Supply: 113.5K–114.5K → short-term retest area.
🟩 Major Demand: 108K–110K → strong support area where buyers are likely to step in.
Main Scenario (Bearish Bias)
- Price may retest the 113.5K–114.5K zone soon.
- If a bearish rejection or engulfing candle forms, BTC could extend its drop toward 108K–110K.
Alternate Scenario (Bullish Reversal)
- If BTC closes above 115K (4H), the bearish structure invalidates, opening the path toward 118K–120K.
If you find this analysis helpful :
👉 Follow for more BTC & market updates,
💬 Share to help others stay informed,
❤️ Like to support and keep this research going!

Bitcoin Bulls Eye Bounce, Though Bears Could Be Lurking AboveUsing correlations with Wall Street indices, I outline why I think Bitcoin could be in for a bounce - though its rally could be limited before new lows are seen.
Matt Simpson, Market Analyst at City Index and Forex.com
