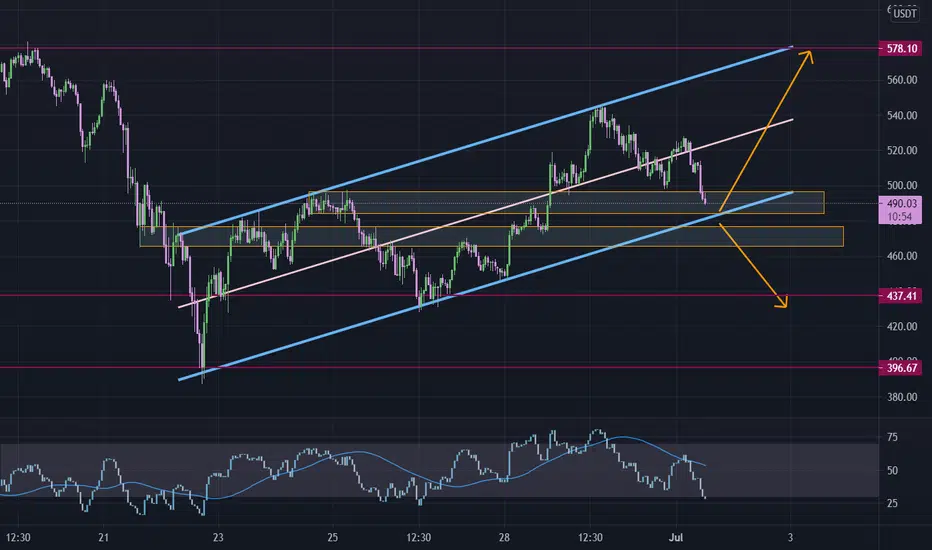
BCHUSDT in parallel channel#BCHUSDT
$BCH in 1 hour chart is trading in ascending parallel channel, now price is near lower line of this channel, that is the same as string support zone.
It can touch $480 and go up toward $570
But if price break down, #BCH can drop to $437 and lower.
Bitcoincash
BTCUSDT June 22,2021This is the big head and shoulders that I was talking about in my last idea.
Long term bullish trend is broken, The bullish channel is lost, Triangle is broken from the bottom . If price rise from here, seems to me it will be only a pull back to the broken trend line and then it will go down again.
$30k is the neckline of this big bears pattern, after it breaks then you can see the targets on chart which is $24k and $19k .


Come on Bitcoin. You can make this miracle.The poc is perfectly allined with the weekly resistance, on the daily chart. We need just some little effort. Come on Beauty!

BCH CHART ANALYSIS DAILY TIMEBITCOIN CASH IS RESPECT OF IMPORTANT SUPPORT AND PULL BACK...
BUT WE WILL HAVE TO MORE CAREFUL THAT IF SUPPORT BREAK THEN BCH PRICE MAY GO DOWN TOWARDS 250/200$

Looking for a downturn on Bitcoin Cash BCHUSDI just don't believe yet that we are impulsing again. This one is more likely to drop before it rises again.


Bitcoin Cash (BCH) - June 23Hello?
Welcome, traders.
By "following", you can always get new information quickly.
Please also click "Like".
Have a good day.
-------------------------------------
(BCHUSD 1W Chart)
If the price holds above the 517.20 point, it is expected to turn into an uptrend.
(1D chart)
We need to see if we can find support at 435.70 and move up to the 486.28-599.87 section.
If it declines from the 343.10 point, there is a possibility of entering the mid- to long-term investment area, so careful trading is required.
The price should remain in the range 599.87-827.06 to convert into an uptrend.
However, it is recommended to check the BTC price movement as there is a possibility that the price may fluctuate depending on the movement of the BTC price.
-------------------------------------
(BCHBTC 1W chart)
You need to make sure you can sustain the price in the big box range 0.011530-0.048430.
In order to turn into an uptrend, the price must rise above the 0.024777 point and hold the price.
(1D chart)
We should see support at the 0.013651 point and see if we can move towards the 0.014655-0.016063 section.
If it continues to fall, it could touch the 0.011530 point, so you need to think about how to react.
The price should remain in the 0.016063-0.018878 range to convert into an uptrend.
------------------------------------------
We recommend that you trade with your average unit price.
This is because, if the price is below your average unit price, whether it is in an uptrend or in a downtrend, there is a high possibility that you will not be able to get a big profit due to the psychological burden.
The center of all trading starts with the average unit price at which you start trading.
If you ignore this, you may be trading in the wrong direction.
Therefore, it is important to find a way to lower the average unit price and adjust the proportion of the investment, ultimately allowing the funds corresponding to the profits to regenerate themselves.
------------------------------------------------------------ -----------------------------------------------------
** All indicators are lagging indicators.
Therefore, it is important to be aware that the indicator moves accordingly with the movement of price and volume.
However, for the sake of convenience, we are talking in reverse for the interpretation of the indicator.
** The wRSI_SR indicator is an indicator created by adding settings and options to the existing Stochastic RSI indicator.
Therefore, the interpretation is the same as the traditional Stochastic RSI indicator. (K, D line -> R, S line)
** The OBV indicator was re-created by applying a formula to the DepthHouse Trading indicator, an indicator disclosed by oh92. (Thanks for this.)
** See support, resistance, and abbreviation points.
** Support or resistance is based on the closing price of the 1D chart.
** All descriptions are for reference only and do not guarantee a profit or loss in investment.
Explanation of abbreviations displayed in the chart
R: A point or section of resistance that requires a response to preserve profits.
S-L: Stop Loss point or section
S: A point or section where you can buy to make a profit as a support point or section.
(Short-term Stop Loss can be said to be a point where profit and loss can be preserved or additional entry can be made through split trading. It is a short-term investment perspective.)
GAP refers to the difference in prices that occurred when the stock market, CME, and BAKKT exchanges were closed because they are not traded 24 hours a day.
G1 : Closing price when closed
G2: Opening price
(Example) Gap (G1-G2)


Bitcoin Cash - Approaching Pivotal Point - Do Not Miss!BCH is approaching a key area where we will find out if we're still continuing to be bearish or if we'll have some sort of reversal. The key are to focus on is the 450-500 area where we have a recent bottom.
If price action shows bullish pressure, we can find entry reasons such a break of the wedge pattern.

BITCOIN CASH ANALYSISBCHUSD trading in downtrend line
price rebounded from key level around 630
price below HVN around 620
price below SMA 100
RSI in downtrend line below 50
so its expect bearish movement to support level around 500

Bitcoin Cash broadening formationIf this support will be saved, then the price action can go for another higher high.


Bitcoin Cash (BCH) formed bullish Shark for big moveHi, dear friends, hope you are well and welcome to the new update on Bitcoin Cash (BCH).
Previously we had a nice trade of BCH:
Now this time, on the 4-day chart, the price action o BCH has formed a bullish Shark pattern. The priceline has already visited the oversold zone as it was dropped up to $468 and moved up. However, if the 50 simple moving average will be broken down, then it can give us another chance to catch it from the buying zone of this pattern. There is also 100 simple moving average support in the potential reversal zone.
Buying and sell targets for Shark move:
Buy between: $530 to $340
Sell between: $789 to $1265.42
Stop loss:
The maximum extent of the potential reversal zone at 1.13 Fib level can be used as stop-loss which is $340.
.
Possible profit and loss ratio:
As per the above targets, this trade has a profit possibility of 270%, and a high loss possibility up to 36%.
Note: Above idea is for educational purpose only. It is advised to diversify and strictly follow the stop loss, and don't get stuck with trade.

BCHUSDT - SETUPBCH is breaking out of this symmetrical triangle formation towards the upside, although we are currently just below this horizontal resistance, for this setup to be valid we need to see a 4hr close above this zone then on the retest we can look to enter.

BCH 200MA Birth - Volatility Implied BCH has incredible potential
And this observation only exacerbates this potential
When the 200MA becomes visible, it allows the 50 and 100 to adjust to the 200's position
On the Bitcoin pair 1.618 is being tested, potential for a reversal
Incredible long term hodl


BCH/USD SHORTHere are my reasons for entering a short position on BCH /USD.
The confluences for my entry:
✓ Strong overall downtrend
✓ Rejection of major key level
✓ Hidden bearish divergence at key level lower high - indication continuation
✓ Rejection at the 0.618 Fibonacci Retracement level
✓ TD Sequential printing a 9 on the 2HR - signally buyer exhaustion
✓ Stochastics momentum heading down**
✓ RSI Momentum heading down**
*assumptions not confirmed
I will a short position with a stop loss above the wick of the reversal candle of the lower higher
** this is not financial advice **

BCH/USD SHORTBCH /USD SHORT
**Still waiting for entry**
**Will enter on confirmation of confluences starred below**
Here are my reasons for looking to enter a short position on BCH /USD.
The confluences for my entry:
✓ Strong overall downtrend
✓ Rejection of major key level order block
✓ Rejection at the 0.5 Fibonacci Retracement level
✓ TD Sequential printing a 9 on the 2HR
✓ Double top on smaller timeframes
✓ Crossing back below the 55EMA**
✓ Stochastics momentum heading down**
✓ RSI Momentum heading down**
I will a short position with a stop loss above the wick of the reversal candle/TD Sequential 9
** this is not financial advice **

Bitcoin Cash (BCHUSD): Harmonic Bat Pattern Spotted
Potential harmonic bat pattern formation is spotted on BCHUSD 8H chart.
The completion point of the pattern lies within a strong demand zone 468 - 502.
From that zone, a pullback will be expected.
Closest levels for goals:
613
715
❤️ Please, support this idea with a like and comment! ❤️
⬇️ Subscribe to my social networks! ⬇️

"Bull Run has come to End!", Historic Data of Bitcoin suggests!Hey guys,
I'm up with new analysis, a new idea about BTCUSDT.
Here you can see a bold red curve which is actually the famous 11-years-resistance line (actually from the time Bitcoin is launched). Past data shows that whenever we touch this resistance, the bear market starts.
Here is what I have noticed:
"0.618 fib level and bear market targets"
In 2011, the price of BTC reached about $34 before dropping to about $2.5 which lies at 0.618 fib retracement level.
The principle of this analysis is that for the next bear market, we can calculate the approximate bearish targets using the fib retracement tool, putting 0 fib level at the 0.618 fib level of the previous bull run. Then we will get to know the bearish targets for the bear market i.e again at 0.618 (61.8%) level. I know this is surprising but yes, it has been working since BTC trading has started.
Following this principle:
In 2013, 61.8% fib level was at around $123 and the price retraced to $155 from $1269 in 2015.
In 2017, 61.8% fib level was at around $3091 and the price retraced to about $3100 from about $19000 in 2018.
Now in 2021, 61.8% fib level is at around $20357 and the price is expected to be retraced to this level. The current price is $31434.
Also, just to remind you that I have also shared an analysis 9 days ago entitled "Bitcoin in Range: Can continue to be more bearish" :
In conclusion, I would say that technically it is the start of Bear Market and my bearish price targets are $20357. After the targets are hit, BTC price will continue ranging below 21EMA until the start of the next bull run which historically starts just before Bitcoin Halving and gets sped up after the event of halving. Next Bitcoin Halving is expected around February 2024.
The good thing is: As Bitcoin will continue ranging with Bitcoin Dominance low, Alts will pump hard but to make this happen, we need to eradicate or maybe lessen the fear in the market.
Muneeb #SyedMuneebAli

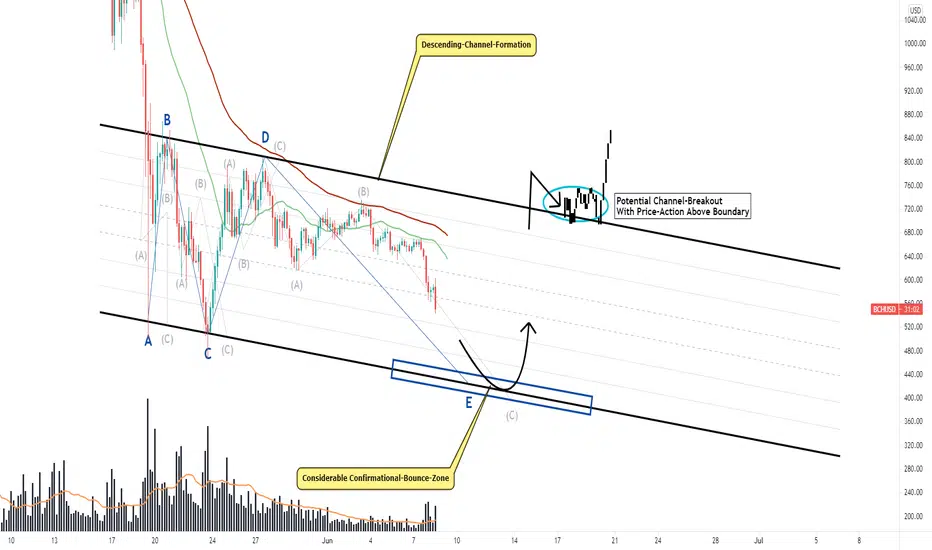
Bitcoin Cash, Developed Descending-Channel, Potential Breakout!Hi,
Welcome to this analysis about Bitcoin Cash, we are looking at the 4-hour timeframe perspectives. Bitcoin Cash has moved into an interesting constellation as it developed this main descending-channel-formation in the structure with the coherent wave-count within and the waves A to D almost already completed. Now Bitcoin Cash is moving forward with the protracted wave E that will complete the whole wave-count and when Bitcoin Cash manages to bounce within the confirmational-bounce-cluster marked in blue this can be the possible origin for a channel-breakout to the upside, therefore it is highly necessary that Bitcoin Cash rightly manages to bounce and show up with further bullishness to the upside, otherwise when falling below the lower boundary the bullish scenario can also invalidate, it will be an important development ahead.
In this manner, thank you for watching the analysis and great contentment for everybody supporting, all the best!
"The high destiny of the market is to explicate, rather than to speculate."
Information provided is only educational and should not be used to take action in the market.