Bitcoin Cash (BCC/BCH - USD) Listo Para DespegarParece que Bitcoin Cash BCC/BCH también está listo para una corrida. Entiendo que este "trade" será influenciado por efectos dentro del mercado en adición a el análisis técnico. La teoría es simple: una vez Bitcoin alcance el nivel de $10,000, habrán muchas tomas de ganancias. En ese punto, también se reflejará un punto de debilidad y se reflejará una corrección necesaria. Basado en esa corrección, y en los rumores actuales sobre Dragon Slayer y otros sucesos, veo una llama que impulsará esto mucho más allá ...
Looks like Bitcoin Cash BCC/BCH is also ready for a break out run. I expect this trade to be influenced by market forces other than just TA. The theory is simple: once Bitcoin reaches the $10,000 level, there will be lots of profit taking. At that point, there will also be a natural weakness and tendency towards a much due correction. Based on that, and the current gossip around Dragon Slayer and other happenings, I see that as an igniter for this to go much higher...
High Risk Trade IMO, but if the pump we all have expected will take place anytime, this looks like the perfect time to me.
Bitcoincashusd

Bitcoin Cash Trading OpportunityThe price bounces from 853.00 support level and bounces from the support zone formed by SMA. RSI confirmed price reversal from the support level. The price diverges with RSI. The market is going to move high.

Fool Me Once, Shame On YouFool Me Twice, Shame on Me
Due to the fact that Bitcoin once again failed to break 8k, there is a solid chance that it will start a retracement.
IF BTC does in fact start this retracement, BCH may have a chance for a solid rebuttal!
Judging by the chart, BCH is attempting to cross the downward trendline that was formed from its previous high of $2800.
My plan of action:
IF BCH succeeds in crossing this line, I will place my long for a quick scalp non the less.
If we then form a new higher high above the 1224 price mark, I will likely stay in my position to see how this plays out.
IF BTC continues to rise, and BCH fails to gain momentum, I will stay out of this trade all together.
IF you are able to short BCH, I wish you luck!
Note: trendlines were drawn off 15 minute intervals
DISCLAIMER:
Please note I am only providing my own trading information for your benefit and insight to my trading techniques, you should do your own due diligence and not take this information as a trade signal.

BTC and BCH "anti-symmetric" patterns. How to profit from this.Here we can see the charts of BCH/USD (up) and BTC/USD (up). Both are from Bitfinex exchange.
If you already sold Bitcoin believing that it will go down, it would be a good idea to the check Bitcoin Cash which seems moving up showing an "anti-symmetric" pattern compared to Bitcoin.
It seems that a lot of traders sold Bitcoin and then:
A) Bought US$ aiming to QUIT (for the moment) the cryptocurrency market.
B) Bought Bitcoin Cash aiming to STAY in the cryptocurrency market.
Options A and B protected investors from losing their money. With both of them, investors can later re-buy Bitcoin from a lower price, hoping that it will go up to 8.000 - 10.000 US$ (and yes, I think that bitcoin will go later very high).
IF (i repeat : IF) you believe that Bitcoin will continue to go DOWN for X time, then very probably Bitcoin Cash will go UP in the same X time as shown in the "anti-symmetric" pattern. In this case choosing option B, not only would protect your invested money, but would give you also the possibility to win more US$.
So, as I said before, it's up to you to evaluate if Bitcoin will go up or down... Then, the choice is yours.


BCC trying to break at around 842 resistanceAs seen in the chart, if BCC breaks at around 840. It could reach 900+


BCC to MoonBCC reminds me a lot of Bitcoin's Fractal before we broke ATH. Watching for the retrace back to the trend line before entry

BCH channel: Dip, then 670? BCH/BCC has been a nice trade for the past few days. Looking for the next entry.


BCH: Symmetrical triangle can bust up any minute! According to the Elliot Wave Principle, every market rise in five waves and corrects in three.
After an amazing impulse from $190 to $972 in five waves, BCH corrected in a double combo WXY waves, labeled in blue.
It all formed a symmetrical triangle set to bust before the end of the month, five new impulsive waves are expected is this count is correct. An extension of 1.618 can take us up to over $1400! I'm not crazy and neither does Fibonacci. That could be our Wave III

BITCOIN CASH // HITBTC OpportunityHi Seildev here,
We're looking at 1 hour time frame a triple bottom with RSI divergence
upwards.
Historically the chart has not given a 3 point triple bottom.
If retraced back to 0.055313 then this is a great opportunity
for us to buy with:
- Target 1 profits at 0.067464
- Target 2 profits at 0.082000
As always, trade with a plan and safe trading.
Seildev

Bitcoin Cash: Rally or Crash?Is this a falling wedge reversal we see? Then we need a game plan!
The max consolidation level stopped the drop and we’ve seen a nice bounce. From here, we may see a breach of the falling wedge, a fibo extension target at $454, the pennant target at $466, and possibly even a daily target at $612. I can also see the rally kissing the major fibo resistance at $707.
Alternatively, we may resume the downtrend by breaking through the key fibo level at $359, the sub-key fibo at $341, and finally with bearish confirmation at $307. A fibo extension gives us a target on the hourly at $250 and a daily at $154 if we break the all-time low (I think this is unlikely at this time).
My method also includes analyzing the $BCHBTC pair. Here is the plan of action in that chart:
PLEASE NOTE: the long idea here is counter-cyclical until a breach of the bullish confirmation at $484.
As always, I will be updating this daily.
Cheers and GLWT!
Erik.
*If you like my ideas, please upvote :)

BCH found its bottom, time to push a little higher!An ABC correction with an extended C as i see it, BCH started with an impulse again, the long term support held the bleeding, let's see if it can reach again the resistance and form that fractal!

BCH trough an ABC correction bottom could be aroud $360Looks like BCH is correcting from an 5 impulsive waves waving from $300 to $540, C could find the bottom around $360.


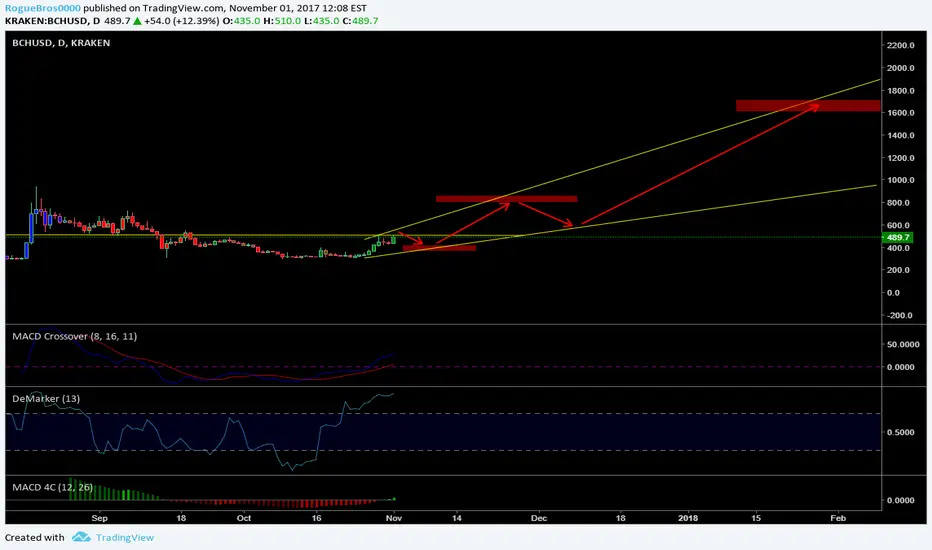
BCHUSD Chart showing entry and exit areas. Of course all altcoin analysis is dependent upon the price action of Bitcoin, as the sentiment of these coins follows their leader.


BCHUSD 8h: Fibo 1.62 target = 1.300 USD. Maybe possible.If we look at the movements of the last weeks, we could extrapolate the trend lines on the basis of fibo under the condition that the top is around 900 USD (fibo 1). So there could be two possible trend ways up to the target 1.300 USD. it is very rough, but possible. Correction way 1 to around 575 USD. Correction way 2 to around 400 USD with a between high to 760 USD.
Let's see what happens. Happy trading. :-)
