Bitcoin back in the fight and under pressure. MAJOR resistance
While we all remain ever so Bullish and LONGS increase, we REALLY need to remember just where Bitcoin PA is Right now.
In an area that could very easily turn into a Bear Trap, as it did in 2021
Why could this happen?
WE ARE UNDER MAJOR RESISTANCE.
Why ?
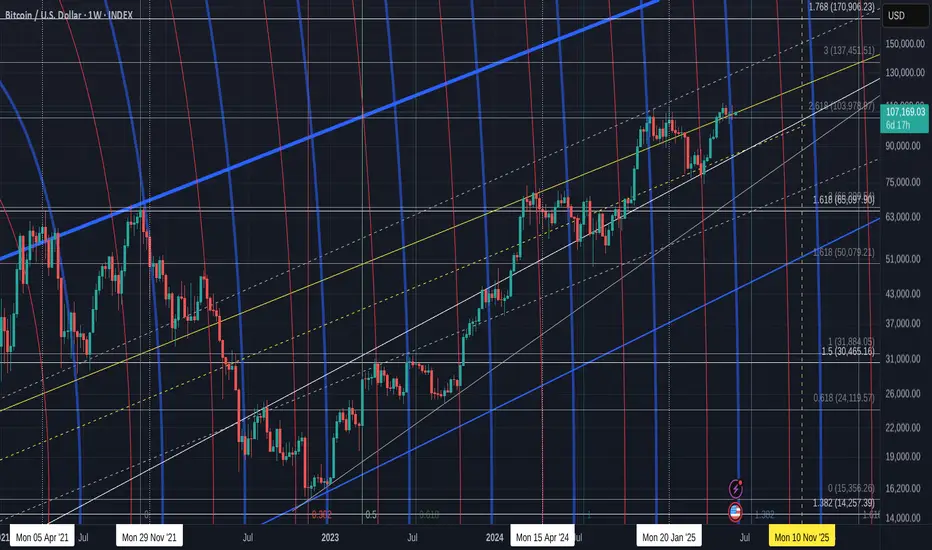
Looking at the chart justt above, we can see that rising Trend line..This is NOT a Weak line.
Here is the same chart zoomed out.
To Cross this line and remain above it Will be just the First Step towards a new ATH.
The MAJOR Wall is as we get near that 100K -> 106K line.
Remember this Chart ?
The Blue Arc of Resistance. The One thing that has rejected EVERY Bitcoin ATH since Bitcoin started.
This line MUST be crossed but is Obviously HUGELY STRONG
A Closer View of where we are now on this chart.
So, that current green candle we know is just under that Cycle line of resistance mentioned earlier.
The next step is that 50 SMA ( Red, Just around where we see that Blue Arc.
AND we see PA in a Squeeze.
We have come back up to this and approach a new APEX around end of March 2026.
PA always reacts before the APEX>
We now have PA snadwiched between the 50 SMA and the 100 SMA ( Blue )
That 100 is also around that LONGGGGG term line of support
We really do NOT want to loose that support.
But this may happen if we do not break through that Blue Arc.
But we have talk of New beginnings for Bitcoin......
New Cycle patterns appear to be forming
Super Cycles are possible as we see signals that the 4 year cyce pattern maybe ending,,Yet to be proved.
And this could happen with out Major change to long term PA patterns.
This would NOT involve dropping out of the Area PA has been in since 2017
PA can drop as low as 60K before long term Channrl is Lost.
So, here we are, New patterns maybe forming and we will not know for a Long time yet. Proof of change is onlly seen afterwards
Should PA break over that Blue Arc, It MUST be used as support after.
Fasinating Times......Watch that 50 Month SMA closely.
We Break that, Off we go
So, we wait
Bitcoincycle

Bitcoin Dominance showing us things ARE Very Different this time
There are so many things that ARE the same as previous cycles, to date.
And we have seemingly begun a draw down and even I am seeing possible similarities to the post 2021 ATH draw down.
But Bitcoin Dominance shows us a Glaring difference.
The chart above shows us the BTC.D PA and the Bitcoin Halving dates to ATH in Blue Boxes at the Top of chart
We have the ATH to ATH day count at the bottom of the Chart in blue Boxes.
Also At the Bottom of the Chart, in Yellow and orange boxes, we have the % draw down in BTC.D from the Halving date to the ATH
To the 2017 ATH after halving, we saw a -61.17% DROP in Bitcoin Dominance.
To the 2021ATH after halving, we saw a -42,53% DROP in Bitcoin Dominance.
From the Halving in April 2024 to the current ATH, we have a GAIN in BTC.D of 9.21%
The fact thaat Vitcoin is holding Dominance in the market is so incredably BULLISH and does lead to the possibility that the 4 year cucle has ended and we may well be entering a Super cycle.
We will not know if this has happened for a while.....But I am watching the Ascending channel closely on the Bitcoin charts.
New days maybe ahead

Bitcoin ascending channel and Cups -Next cycle Cup entered ? YES
Bitcoin ascending channel and Cups -Next cycle Cup entered
PA entered channel in march 2017 and has never left, other than to go to ATH.
Bitcoin has spent more time in and above this channel than out of it.
Since entering channel, PA has always bounced off the lower line of channel
For the sake of this post, we are assuming that the current ATH is the final one this cycle.
Reasons why this maybe the case are listed below.
The Cups ( the yellow Semi Circles ) go from the ATH and the tops are Level, same price line. This is called the Neckline.
The Blue day count boxes are ATH to when PA broke through the neckline of the Cup.
2013 - 1211 days
2017 - 1106 days
2021 - 1120 days
The day count in grey boxes, below PA, are from when PA leaves the neckline of the Cup and goes to ATH of that "Cycle"
March 2017 to Dec 2017 - 266 days
Dec 2020 to Nov 2021 = 322 days
Dec 2024 to October 2025 - 308 days - This shows that PA is in the day count Range to have printed a cycle ATH maybe.
Please Note, the Cups are Not EXACT but close enough to show the idea intended here.
For instance, PA followed the Arc of the Cup from ATH in 2017 to when it touched the Lower trend line of the channel. It then bounced.
From the ATH in 2021, PA also followed the Arc of the Cup till it reached the Lower trendline , where it bounced...again.
It maybe worth noting that PA has not yet reached the upper trend line this time, and I have posted about this before, while talking about the "Blue Arc of resistance".....That has rejected EVERY ATH since Bitcoin was created.
IF PA has just been rejected off the latest ATH and is about to enter the Cup again, we have a more shallow drop, till we reach the lower trend line of the channel.
This will be in Feb 2026 at a price of around 60K -> 62K
Why would I think PA has just entered the Next Cup ?
ATH to next ATH day counts have been ( as shown in the upper Grey Day count Boxes )
2013 - 2017 = 1477 days
2017 - 2021 = 1428 days
2021 - 2025 = 1428 days - PA is again in the Day count Range to show that we Have have reached that point
There is Obviously the possibiity that PA will reach another ATH in 2026 and many, including me, say that things have changed and the 4 years Cycle is over.....
We shall see .but until then, I am watching this idea closely.
But again, I will mention, PA has not reached the upper trend line.......it may not.....
What ever does happen, this will be the first time the Tops of the Cup are Not BOTH in the channel, since the channel was fully entered by PA in 2017.
Since entering channel, Every ATH has been one FIB level higher than the previous
2017 just above 1 Fib
2021 just above 1.236 Fib
2015 just above 1.382 Fib
The Next Fib level, the 1.5, sits at a price line of 205700 USD
( 2013 ATH that set the upper trend line of channel was on the 0.618 Fib )
The Fact that PA has reached above that Fib line this cycle, is a day count similar to previous cycles, I do think we may have Topped.....and begun to enter the next Cup.
Just as a side note, Very interesting how From the 2013 ATH to when PA fell out of channel was 266 days ( Orange Box on Left og Main chart)
It was also exactly 266 days From when PA left the Top of the Cup and reached the New ATH in 2017. ( First lower Grey box on the left )
I think we are in for a VERY interesting 2026
HAPPY NEW YEAR to you all

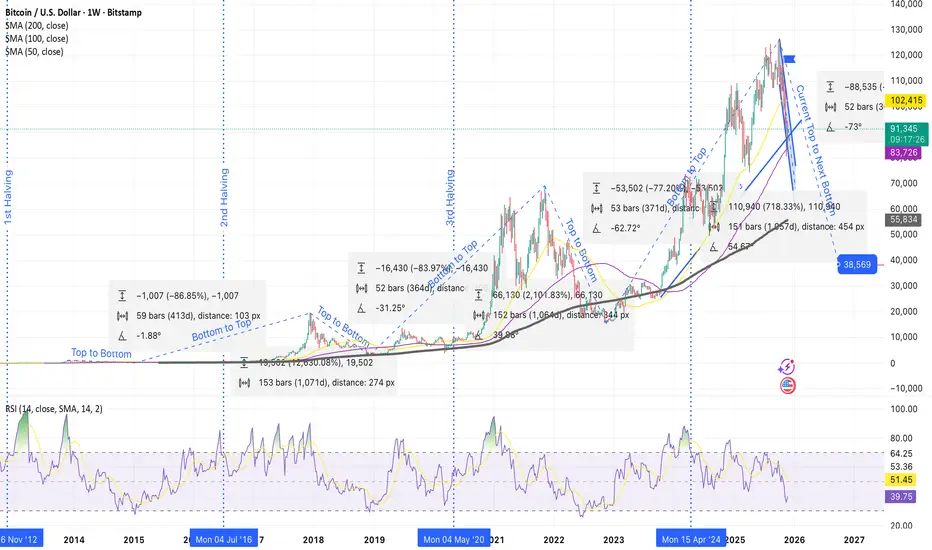
Deep Analysis for Bitcoin – The 4-Year Cycle Repeating Again🔹 1. Historic Bear Market Drops Are Identical
Each cycle produced almost the same percentage crash from top to bottom:
• Cycle 1: –86.85%
• Cycle 2: –83.97%
• Cycle 3: –77.20%
• Current Cycle (Projection): –70% to –75%
Every cycle becomes slightly less volatile, but the pattern is still the same:
The top is always followed by a huge correction.
⸻
🔹 2. The Cycle Durations Are Nearly Perfect Copies
Top → Bottom timing
• Cycle 1: 59 weeks
• Cycle 2: 52 weeks
• Cycle 3: 53 weeks
• Current projection: ~52 weeks
⏳ Every major Bitcoin top takes ~1 year to reach the bottom.
Bottom → Next Top timing
• Cycle 1: ~1070 days
• Cycle 2: ~1057 days
• Cycle 3: ~1057 days
• Current cycle follows the same length exactly.
⸻
🔹 3. Bitcoin Always Bottoms Near the 200-Week SMA
Every cycle bottom touches or slightly dips below the 200-week moving average (black line).
Your projection shows the same thing happening again:
📉 Projected BTC bottom: ~$38,000 – $40,000
Exactly where the 200-week SMA and long-term trendline converge.
⸻
🔹 4. Current Cycle Is Following the Previous One Perfectly
Your chart overlays show:
• The 2025 top mirrors the 2021 top
• The decline angle is almost identical
• RSI is falling the same way it did in every bear market start
• The projected drop of –70% from the 2025 top leads directly to the $38K bottom zone
This is the same structure as:
• 2013 → 2015
• 2017 → 2018
• 2021 → 2022
⸻
🔹 5. What’s Next?
If Bitcoin continues to follow its 4-year cycle:
📉 Bear Market Bottom: ~$38K in 2026
📈 Next Major Bull Run: 2026–2028
🏁 Major Cycle Top: around 2028–2029
⸻
🧠 “Bitcoin has never broken its 4-year cycle. Each top is followed by a –70% bear market, and each bottom leads into the next halving bull run.”
📜 Disclaimer: This is general information only and not financial advice.
Bitcoin Bear Market 2026 | Macro Cycle & Rising Wedge BreakdownBitcoin Macro Cycle Analysis (2013–2029) | Rising Wedge Breakdown • 2026 Bear Market Targets • Historical % Drops & Next Accumulation Zone
Bitcoin historical data strongly follows multi-year macro cycles , where each bull market has been followed by a deep bear market correction:
📉 2nd Cycle (2017–2018)
Top: 19,666 (17 Dec 2017)
Bottom: 3,122 (15 Dec 2018)
Correction: –84.23%
📉 3rd Cycle (2021–2022)
Top: 68,997 (8 Nov 2021)
Bottom: 15,479 (9 Nov 2022)
Correction: –76.64%
📉 4th Cycle (2025–2026 – Ongoing)
Top: 126,272 (6 Oct 2025)
Rising Wedge + Distribution Phase breakdown confirms bearish structure shift
Based on historical cycle behavior and on-chain indicators, Bitcoin has entered the 4th major bear market
📍 Projected Bottom Zone (2026)
Primary Support Zone:
➡️ $40,000 – $42,000 – $45,382
(Aligned with Wedge Breakdown + Macro Support)
Percentage-Based Targets:
–68.16% drop: → ≈ $40,000
–74% historical drop scenario: → ≈ $31,000 (max capitulation zone)
📅 Expected Bottom Window:
September – October 2026
→ Historically the strongest long-term buying opportunity .
📈 5th Cycle Expectations (2026–2029)
Bitcoin has been following a Long-Term Rising Wedge (Bearish Continuation / Reversal Pattern) since 2021.
This pattern is expected to fully complete by April 2029 → leading into a new long-term top and then the 5th bear market .
⭐ Why This Analysis Matters
Combines **cycle history**, **on-chain metrics**, **pattern analysis**, and **macro support zones**
Helps identify high-probability long-term Bitcoin accumulation levels
Useful for swing traders, long-term investors, and cycle-based portfolio strategies
🔔 If You Find This Analysis Helpful
👍 Like • 💬 Comment • ⭐ Save
It motivates me to share more high-quality Bitcoin cycle research!

Is BITCOIN in a DIP OF DOOM or Are the Bears having Fun ?
This is a Crunch time for Bitcoin and Many people Are running scared.
Me, I am sitting tight, NOT selling.
In Fact, I am BUYING
Why ?
Because we are Still in Channel and Above a long Term line of support.
Lets have a Look.
There are two major lines we need to pay attention to...The BLUE ARC that has rejected Every Bitcoin ATH since the beginning and the Line of support that was created in 2011.
And the problem we have right now, is that PA is getting Squeezed between the Two.
PA MUST React.
You can see how tight it is getting and PA is nearly on the lower trendline.
Lets look closer
Same chart as a Weekly chart
See how that Blue Arc has rejected PA and how the White long term support has supported PA>
And it is THIS image of this chart that Give me Hope.
A number of things to note here.
Most importantly is that the Bulls DID break over that Blue Arc once. This shows intent to do so. That was the First time that line of resistance has ever been broken.
And PA was Overbought when it did so and so we did not have the strength to remain above.
PA has retreated and as a consequence, PA is now Oversold.....and with in striking distance.
PA has the strength to attack that Blue Arc again and WIN
PA is currently on the 0.5 Fib Retracement
Should this support fail, we will Visit 89700 on the 0.618 retrancement. But that will only happen if we fall through a line of Support that HAS NEVER BEEN CROSSED
For Me, I remain VERY BULLISH
This is a Dip of Doom and has scared people but we are near the end....So long as we remain above that line of support, I remain positive.
As I mentioned at the beginning of the month, I am expecting this month to close RED but then we Rise....Have a look at the Month Candle Colout chart post.....all will be explained.
Stay safe

A Revivisit to the 2017 ATH BITCOIN Fractal and current PA.
With the possibility that we HAVE Topped this cycle, I thought I would go back to an old chart I was posting for most of 2023, 2024 and early parts of 2025
The way Bitcoin was following the 2013 - 2017 ATH Fractal was uncanny.
True that PA dived deeper than the Fractal in 2022 but it still followed the same angle of decent, despite pressure from Institutional banking systems to crash it.
And in Early 2025, Bitcoin PA decoupled from the Trajectory of the Fractal and has pretty well Ranged horizontal in a Range of 80K to 120K ever since.
But what I just saw was this.
The Current ATH was set on the same week as the projected Fractal ATH Date
THAT is very interesting to me.
What does it signify ?
No idea but it may be worth knowing this.
One other thing to add to this is simply how PA has dropped below the 50 week SMA ( RED ) for the first time this run and it has usually been support.
This week is not over and we may see PA push higher and make this push down just a Wick on a weekly candle But I feel this is not going to happen.
For now, I am remaining neutral as to the next steps to take.
I am remaining Bullish that Bitcoin Will push a lot higher in December and January because I currently believe the traditional cycles are broken
BUT this may be just wishful thinking.
Statistically, We HAVE past the date for Cycle Top on many charts using day counts
But it just does not feel right
So I wait. Time Will Always tell

Bitcoin Daily back in a Squeeze - WILL react by Nov 25th but....
And there we have it, A Working chart
"Oh No, Lots of lines" I hear you cry
But every one has relevance.
The Lines descending from left to Right are Fib Circles, Nearly Always resistance and the RED ones are 236 Fib circles....Normal rejection almost guaranteed.
You can see the current ATH got rejected off the 6.768 Fib extension and a 236 Fib circle.
So far, we have fallen through a number of Fib Circles and have found support on the 5.236 Fib extension
This has also put us under pressure from the next Fib circle and so, we are in a Squeeze that has an apex on 25th this month.
This is likely rejection
This all adds confluence to what I said at beginning of the month in my Monthly Candle colour report, that does point towards a stronger likelihood of a RED close for November,
But a Green December should Follow.
Back to this month
The Arrow points towards where I think we will land and find support IF we loose the current level.
That would be around 95K on the 5 Fib extension. It also happens to be just above the next 236 Fib circle,
Bur more importantly, that dashed line is a long Term support that has support PA previously.
see below
I removed the Fib circles for clarity
You can see how that dashed line was support, as has the 5 Fib extension.
While we are here, Take Note of the horizontal 3 & 6 Fib extensions ( bold )
And see the earlier version here.
See how the 3 rejected the 2021 ATH line, the 1 supported the bounce in 2021 and the 0.236 rejected the 2017 ATH
On this cycle, that 3 fib line was the 2024 line of rejection ( PA went over and below but always in that field )
The 2025 Run has been around the 6.
I think we could reach up to the 9 over the course of the next 12 months.
"WHAT ???" "End of 4 year cycle means we fall into a BEAR doesn't it?"
I have a feeling that this may not happen. Things are VERY different this time......and there are plenty of reasons why we simply CANNOT pull back 80% from here...all mentioned in previous posts
But I do believe November WILL close RED....But DO NOT PANIC -> BUY
The Bull Run will start again in December

BTCUSD 1W Chart – The Cyclical Geometry of Bitcoin MarketsA close examination of Bitcoin’s long-term structure reveals a striking symmetry between its bull and bear phases. The last two bear markets each lasted 364 days, while the two subsequent bull runs expanded for 1,064 days — a rhythm so precise it reflects the mechanical heartbeat of Bitcoin’s market cycles.
Following the 2020 halving, Bitcoin rallied +2,105% over 1,064 days, peaking at $69,000 in 2021. The previous cycle delivered an even greater +18,044% rally, followed by an -84% correction that defined the next macro bottom.
The current cycle, post Halving 2024, continues to mirror this same time symmetry with remarkable accuracy. If history holds, the projected top should arrive roughly 1,064 days after the Halving — around late 2026 — with a potential target zone between $143K and $146K, adjusted for performance decay over time.
However, if the market breaks this cyclical rhythm, it would mark the first major deviation in Bitcoin’s historical pattern. Such a break would not just disrupt the four-year cycle theory — it could signal the birth of a Supercycle, a multi-year parabolic expansion phase driven by institutional adoption, sovereign participation, and macro liquidity shifts.
Until then, all evidence still supports an ongoing reaccumulation phase within the broader bull structure.
Bitcoin’s 364-day downtrend → 1,064-day expansion remains one of the cleanest repeating geometries in financial history a rhythm that could either repeat once more or evolve into something far greater.
-CryptoPASOK

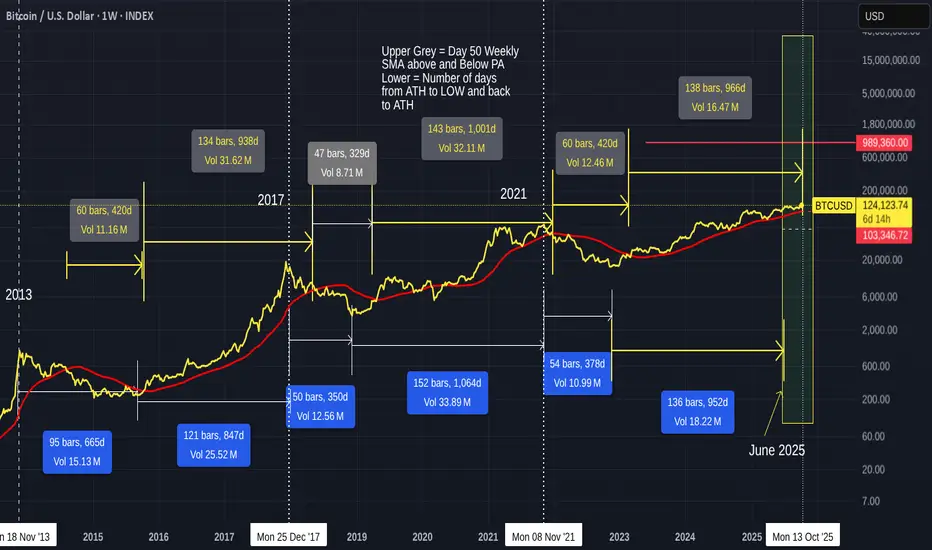
BITCOIN now in Cycle ATH Zone but is BTC still in Cycles ?I first drew this chart back in 2024 and it is amaxing how things have played out,
The Numbers in Grey boxes are the number of Days the 50 SMA ( red) has been above and below PA.
The Blue, Below PA is the day count for PA Cycle High to cycle Low and Back to Cycle high.
We have already past the "High Low" Day count for this cycle ATH and we are now on the Zone for the 50 SMA day count ATH. The peojected date for this ATH is 13 October.
Note how Similar PA & 50 SMA is in the 2013 - 2017 Cycle.
I was also running a PA Fractal chart showing similarities to PA and we can see how close it was until February this year
For me, the reason we went "Flat" from February onwards is simly because of the Long Term resistance over head.... a line that has rejected EVERY Bitcoin ATH = this is all explained in previous posts. See the Blue Arc.
It is that Blue Arc we need to Cross over. This Arc has kept PA Flat this cycle......
Looking at a Zoomed in Chart, we can see how that 50 SMA is a line of strong support.
Should PA retreat, the 50 SMA is at around 103K at this time.
The MACD is just under but in a zone where PA has retreated from
This does NOT automatical Mean PA will Drop from here. Though on lower Time Frames, MACD is up High in Oversold.
However, as the 4 hour shows us, It is already dropping from OverSold and yet PA has hit a high
Divergence is in play
One thing that dies hint at a pull back is the RSI being up in Oversold on a Daily chart
But it should be understood, RSI Can range High or Low
So, are we in Cycle Still ?
If we are, we should expect a beginning of a BEAR market in the next few weeks. But we have not really seen the "Top" pattern and Profit taking yet.....
Until that happens, I really am inclined to believe we have broken the cycle patterns.for a number of reasons.
For instance, the MVRV Z Score
This has not even past the levels seen in previous Runs
BUT as a precaution, it is worth noting that Dash orange line, that starts where the Nov 2021 ATH Was.
We have been rejected from that level already this run But we Still have room to get back up to that level at the mooment.
The Main reason i feel things are different are that Blue Arc I mentioned earlier.
We HAVE to break above that and remain there.....
We are too close at this moment and a Bear market WILL take us back below that HUGE line of Very Very Strong resistance. The Daily chart below shows this
We need one more push to take us Higher, to give us Room to remain above, even when Bitcoin Does correct .
Note that 3 Fin extension on the last chart posted.
We just got above the 6. We need to Rise far enough over that for it to act as support ewhn retested.
3, 6, 9
9 Fib extension at around 180K
Just saying
NEW CYCLES ARE BEGINNING
BITCOIN 2025-6 SCENARIOLet’s see if this alternative Bitcoin top plays out — after all, it’s an experimental chart

The Bear Market Isn't Coming? Old BTC Playbook is a TrapFor years, traders have relied on Bitcoin's predictable cycles. We look for the same clues, the same topping signals, and the same patterns. But what if the market has evolved? What if the playbook we've all been studying is now a trap?
This analysis dives deep into key indicators across all three major bull runs, comparing the RSI, MACD, Volume, and especially the Bollinger Band Width Percentile (BBWP). The data suggests that while some classic bearish signals are flashing, the market's underlying structure is telling a very different, and potentially much more bullish, story.
A Tale of Two Cycles: The Historical Baseline
To understand where we are, we must first look back.
The First Bull Run (2015-2017): This cycle was defined by raw, explosive power. The weekly RSI crossed above 80 a staggering four times. However, the end was confusing. We had bearish RSI divergences fighting against bullish MACD. The primary exit signals were a massive spike in selling volume and a BBWP reading that finally hit 94%, signaling trend exhaustion. It was effective, but messy.
The Second Bull Run (2018-2021): This cycle top was much clearer and became the "classic" model for many traders. The RSI crossed 80 only twice, and the end was signaled by a textbook combination of:
Classic bearish divergences on the RSI and MACD.
Obvious selling pressure at the top.
Crucially, the BBWP spectrum crossed 90% three separate times, screaming trend exhaustion before the final downturn.
The Current Cycle: A New Breed of Bull 📈
Now, let's analyze our current cycle, which began in November 2022. On the surface, some things look familiar, but the engine of this trend is behaving in a completely unprecedented way.
The Familiar Signs (The Bear Case):
Yes, we can see a classic bearish divergence forming on both the RSI and MACD. Furthermore, the recent buying volume, while still okay, is showing signs of weakness compared to the explosive start of the rally. This is what is causing many analysts to call for a cycle top, just like before.
The Unprecedented Anomalies (The Bull Case):
This is where it gets interesting and why the old playbook may fail.
No BBWP Exhaustion: Unlike the (2015-2017) (2018-2021) bull runs, the BBWP spectrum has not crossed 90% a single time during this entire uptrend. The volatility has never reached the levels of euphoria and exhaustion that marked previous tops. The trend, while strong, has not shown signs of being "finished."
The Contraction Anomaly: This is the most compelling signal on the chart. Historically, a major BBWP contraction (the indicator squeezing down) signals that energy is building for a massive expansion in price. This event has almost always marked the beginning of a new bull phase or the start of a major move up. Yet, here we are at the supposed end of the cycle, and the BBWP is contracting again. This has never happened at a cycle peak before. This odd behavior suggests that instead of winding down, the market could be coiling up for another powerful move, Also the number of contractions in this cycle is much higher than the pervious cycles which explains the elliot waves unexpected targets
Elliott Wave Strength: While I have not drawn the Elliott Wave count here because every trader's interpretation can be subjective, my personal count indicates that the current wave structure is targeting prices significantly higher than the current all-time high.
Summary and Final Thoughts
To summarize, while we have some classic, textbook bearish signals that would have marked the top in (2018-2021), we also have powerful, unprecedented evidence suggesting this cycle is different.
The lack of a BBWP exhaustion signal (>90%) is a major deviation from the last 2 cycle top.
The current BBWP contraction at a "cycle end" is a massive anomaly. This is typically a pre-trend signal, not an end-of-trend signal, and could be hinting at a major breakout ahead.
This is not a guarantee of a continued bull run, but rather a data-driven observation that the market is showing a structure we haven't seen before. Relying solely on the old playbook could be a mistake. The market is evolving, and our analysis must evolve with it.
I have marked every anomaly and pattern on the chart, You can zoom in and analyze for yourself
I'm open to all discussions and opinions in the comments
Trade safe and keep an open mind.

Bitcoin Cycle Analysis – The Fourth TurningThe dominant cycle identified here is ~292 bars, which has consistently marked major pivots in Bitcoin’s price action. Each cycle builds in intensity, and according to fractal theory, the fourth turning often delivers the most severe correction.
At present, BTC is pressing against the upper bounds of this dominant cycle. If the cycle roadmap continues to hold, we are now in the early stages of the declining phase, with downside risk extending into the mid-to-lower support zones.
Key Insight:
In fractal cycle analysis, the fourth turning is often the most devastating one. If this pattern repeats, the coming downswing could be sharper and deeper than previous declines, preparing the ground for the next major cycle low.
Caution is warranted as both fractal and cycle models are flashing warnings that this market may be in the process of topping out.

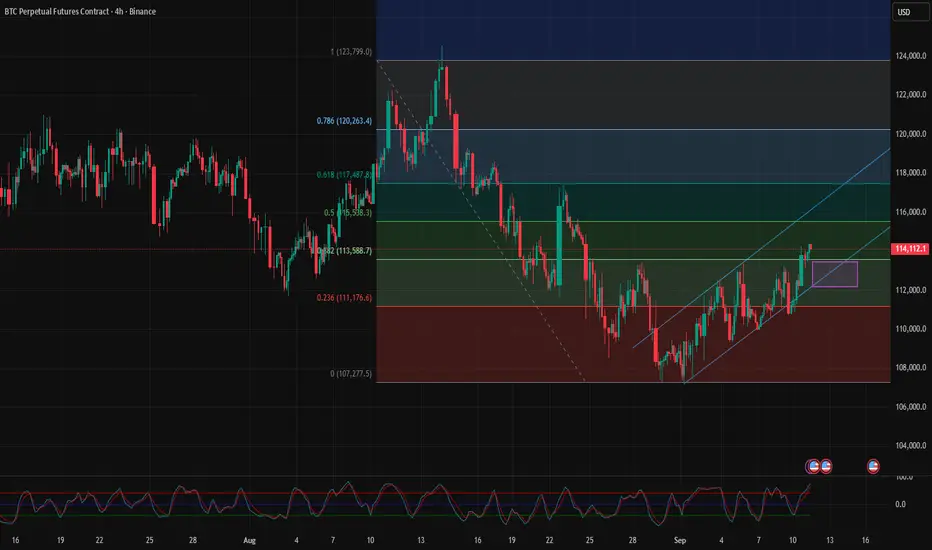
Don't miss the final BTC Rocket of this cycle !!!When it dips, get ready to jump in! BTC is about to moon this cycle 🚀 See you at $124k!
No more retesting $104k — even breaking below $107k looks tough now. Get ready to ride the final wave of this cycle!!! 💰
If you don’t have any position yet, now's a good time to enter your first one. BTC just broke through the legendary EMA200.
As for me, I’ve been buying and selling along the way, locking in profits during this uptrend.
Spot portfolio’s running, options are live, and the futures with x20 leverage — I’m running it, but trying not to get too reckless 😛
For those already holding — stay strong and enjoy being rich.
#BePatientStayCalm #LifeHackTrader
Bitcoin Rally Entering Final Stages!Bitcoin Bull Cycle Analysis:
Historically, Bitcoin has moved in clearly defined market cycles, each lasting roughly 1,064–1,065 days (about 3 years) from bottom to peak, followed by a sharp correction.
2013–2017 Cycle
🔶Bitcoin bottomed in early 2015 and then entered a strong bull run.
🔶Over the next 1,064 days, Bitcoin surged by more than 12,000%, ultimately peaking in late 2017.
🔶After the peak, Bitcoin experienced an 84% decline over the following year, entering a prolonged bear market.
2017–2021 Cycle
🔶From the December 2018 bottom, Bitcoin again began a long bull phase.
🔶In the next 1,064 days, Bitcoin gained over 2,000%, reaching a new all-time high in late 2021.
🔶Similar to the previous cycle, the market corrected sharply, with Bitcoin losing around 76% of its value within a year.
2021–2025 Cycle (Current)
🔶The most recent bottom was recorded in late 2022. Since then, Bitcoin has been in a sustained uptrend.
🔶As of today, the cycle has lasted 1,000+ days, during which Bitcoin has appreciated by roughly 675%.
🔶If the historical pattern continues, this bull run may have about two months left before reaching a cycle peak.
🔶Afterward, the market could undergo a significant correction, potentially in the range of 60–70%, though smaller than previous drops.
Conclusion : Bitcoin’s market history shows a repeating cycle of multi-year bull runs followed by sharp corrections. While past performance does not guarantee future results, the consistency in cycle length and the pattern of diminishing corrections suggest that Bitcoin may soon approach its next major peak. If the trend holds, a significant pullback of 60–70% could follow, offering both risks for late entrants and opportunities for long-term investors. This highlights the importance of caution, disciplined risk management, and strategic planning as we near the potential end of the 2021–2025 bull cycle.

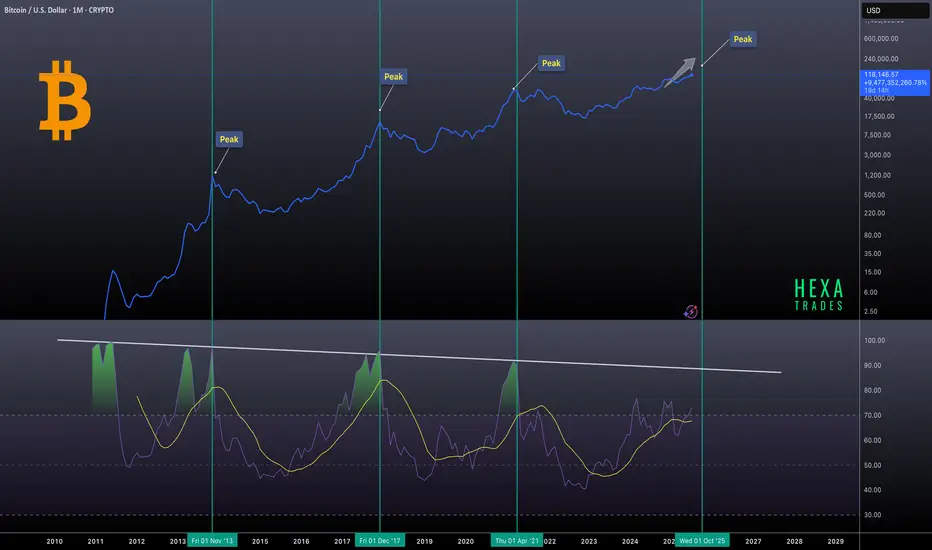
BTC Macro Top or Supercycle Ahead?Bitcoin’s long-term price action, alongside the monthly RSI, shows a repeating pattern at major cycle tops. Historically, whenever the RSI reached the descending resistance trendline (Above 85 level) , Bitcoin entered a cycle peak followed by a correction.
Currently, the RSI is once again approaching this key level, raising the question of whether history will repeat or if BTC can finally break through this long-term resistance.
Historical Pattern:
🔷 2013: RSI touched the upper trendline → BTC entered a cycle peak, followed by a deep correction.
🔷 2017: Once again, RSI hit the resistance → marked the bull market top.
🔷 2021: RSI faced rejection at the same line → led to a prolonged bear market.
Now, in 2025–2026, RSI is climbing back toward this resistance level, and the big question remains: Will Bitcoin break the cycle, or repeat history?
Key Points:
🔶 CRYPTOCAP:BTC has respected this RSI downtrend at previous market cycle tops (2013, 2017, 2021).
🔶 Price is trading near all-time highs while RSI nears historical resistance.
🔶 A breakout above this RSI trendline could signal a new phase of strength.
🔶 A rejection would suggest another cyclical cooling phase.
Conclusion
Bitcoin is at a macro decision point. For over a decade, this RSI trendline has defined cycle tops. A confirmed breakout would mark a historic shift in BTC’s market structure, while another rejection could mean history repeats.
Cheers
Hexa
BITSTAMP:BTCUSD BINANCE:BTCUSDT BINANCE:BTCUSDC

Interesting Fib retrace info could help understand the next bear
Nessy chart initily but I have broken it down here and it will be easy to understand
Also, to make it ckearer to see, I have used a line for the PA..the retracements and % pull backs are accurately placed using the candles....
So, an interesting thing appeared when I was laying with Fib Replacements.
Simply put,
From 2013 ATH to the next Low was a -78.27 % pull back to the 0.236 Fib retracement
From 2013 ATH to the next Low was a -82.20 % pull back to the 0.382 Fib retracement
From 2013 ATH to the next Low was a -76.40 % pull back to the 0,5 Fib retracement
So, after each ATH, PA pulled back to the next step down from previous fib retracement, while pulling back approx the same %
Shuold Bitcoin do the same again, whichh would Scare a Lot of people, we could expect to see a pull back to the 0.768 Fib retracement...and using a near -80 % pull back, we would end up around 24K Low in Nov 2026
Will this happen ?
Who know and I doubt it but until things and patterns change in the way Bitcoin runs its 4 year cycles, then it is a possibility.
But I found it fasinating how yet anoterh sequence occured in the last 3 cycles that Bitcoin has performed.
Nothing else has ever done this.....
So, Lets see if it repeats

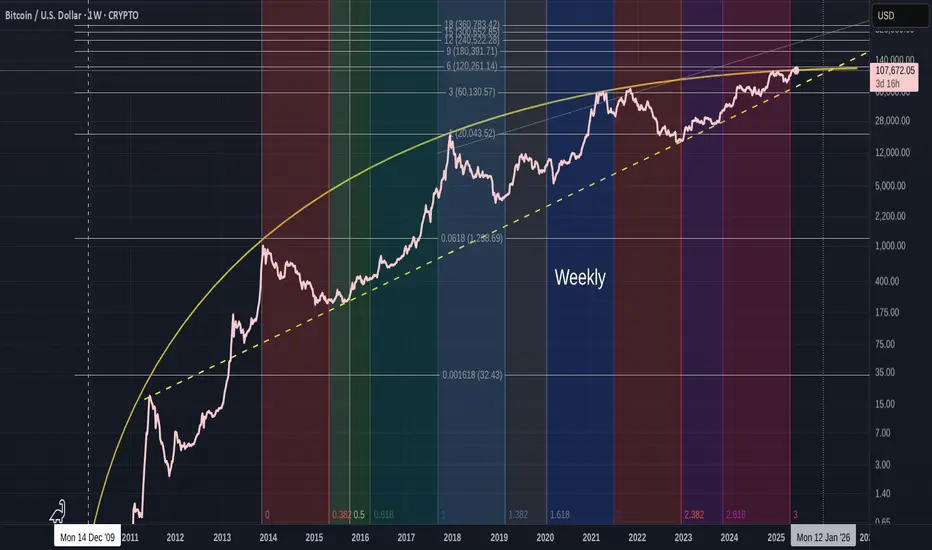
BITCOIN has broken Free - The Next cycle type begins- WHY ?
I have been talking about the Blue Arc of resistance for a while now.
The ARC that has rejected EVERY ATH since Bitcoin began its true rise in Value back in 2011.
I am not going to get to technical right now as I have had only 1 coffee..lol..
Lets begin
I have 3 charts with this Arc on , all slightly different so as to allow for small errors in plotting or calculation.
ALL charts now show PA Above the Arc.
Why is this so important ?
As previously explained, that Blue Arc is a part of a Calculated Fibonacci Spiral.
Calculated from Each ATH to the next and using the difference as a part of that calculation, I was able to pinpoint the centre of this Arc.
And here is the Full picture.
What I am finding a little interesting is how that centre is on MARCH 2020 - That Sudden and worrying COVID CRASH !
But that is a subject for another time.
The Two important things to take of here is how PA began rising on this spiral as soon as PA entered it ( Left ) and unless we broke out of it now, PA would have been dragged back down by December. The time spent inside this spiral are the cumulative years of Bitcoin.
It is also very interesting how the 3 "Cycles " we have had in this channel. have ended perfectly at that intersection of the Blue Arc and the underlying line of support, that PA has not dropped below since we entered the channel back in 2012
To me, that is more than just a coincidence.
And if we look at a smaller time frame, we can see that PA has broken over this Arc, with strength.
The Daily chart above does show us that we do still have challenges ahead.
For instance, there is that line of local resistance just above, that could , under the right circumstances, push PA back down with vengeance should the Bears take over.
But I do not think that will happen yet but it would be nice if we could climb over that and use it as support.
We have done on 2 previous occasions this cycle but each time, we got pushed back under.
3rd time lucky ?
The 4 hour chart gives hope.
Here we can see how that Blue Arc was used as support but once it failed, the Bulls were Quick to get back over.
To me, this shows us that the Bulls have every intention of keeping Bitcoin High and above that Blue Arc.
But the longer we wait to get over that local line of resistance above, and use as support, the further away it Gets.
Currently, the Target to get over that lline is around 140K
Near Term projections of PA, in a bullish run, are around 160K -> 180K
This would give PA that underlying line of support.
So, we wait to see how this plays out but THE MOST IMPORTANT THING ?
We Must remain above that line, the Blue Arc....that currently sits around 115 -118K
The Next Few weeks are VITAL and I remind you..August has nearly twice as many RED monthly closes as Green..Unless it is in a Bull run....;-)
The Daily RSI has room to move still but is High
The Weekly RSI is Similar in hieght, with room to move.
So, We could be in a good position to start that New Cycle type, out of the Spiral that Created Bitcoin as we now know it. The 4 year Flow could change as mass adoption takes pace and People simply do not Buy / Sell as we used to do.
But it is impossible to really know whats coming.
We can only watch and learn. We may well end up having the 4 year cycles again.
After all, that gave us superb profit making opportunities.
Or will Bitcoin become the Store of Value, the Digital Gold ?
Time will tell.
Have a good week and stay safe

Bitcoin Macro Cycles: Sell Signal at RSI 90Bitcoin’s historical market cycles, using monthly RSI data to identify previous bull market peaks. Notable tops in 2013, 2017, and 2021 are highlighted, with the next potential peak projected around October 2025. A consistent pattern emerges where each market top aligns with the monthly RSI reaching or nearing the 90 level, indicating extremely overbought conditions.
Sell when the monthly RSI hits 90. This has consistently marked previous market tops and can serve as a reliable signal for long-term investors.
Bitcoin Final Push: Cycle Top in Sight?Historically, the final two quarters of a Bitcoin cycle, especially in post-halving years, have shown strong bullish trends. This pattern played out in 2013, 2017, and 2021, where Q3 and Q4 delivered significant gains leading into cycle tops. With 2025 being the post-halving year and Q2 already showing strong performance, we may be setting up for a similar rally in Q3 and Q4 if history repeats.
CRYPTOCAP:BTC BITSTAMP:BTCUSD

Bitcoin closed week RED but that is OK, it was closeFor the last 3 weeks, Bitcoin has been in a tight range and each candle has been small body and long wicks, showing indecision and uncertainty
This close up chart shows how these 3 weekly candles have occurred at the intersection of a Fib circle (blue) and This alone could explain these "wicky" candles... The Bulls have been fighting hard to keep PA up and to not let it slide down that fib circle, as is normal the majority of the time.
.
We shall find out this week because, now, there is not a lot to stop the Bulls trying harder.
The FED will let us know the decision on interest rates on 18th.
This will likely cause a reaction in markets and I think we are most likely to see Rates remain static.
PA is currently on Support and remains above the 2.618 Fib extension.
All is Good
The MVRV (Green) and Z Score (yellow) can be complicated to fully understand but what is important to understand here is how the Yellow Z Score is still above the Green MVRV. this remains Bullish. We should notice how Both are falling and we wait for them to cross back over that falling line of resistance.
Currently, This chart shows us that Bitcoin has a slightly undervalued price. The higher we go, the more Oversold, Undervalued/ the top is the opposite, overbought / over valued.
The MACD is showing us a s;light levelling off
For me, I think this is similar to what we saw in the end of 2024. The MACD may go back down to the Red signal line and bounce....Again, we have to wait and see. Remember, that just because MACD drops, BTC PA does not always follow. We can range across instead
Over all, I am still Bullish long term but we may see some continued uncertainty in this market. The FED decision later this week will have an impact for sure
Bitcoin remains strong though but should circumstances allow, we could revisit 90K on that trend line below current position. I am not to sure this will happen but a good idea t be ready if it does.
What is certain is how PA has never really been in such a "soft" controlled action.
The nearest we have is way back in 2016 to 2016.
At this time period, we also saw BTC PA rise in a slow steady rise, no sharp pushes higher till the final push to ATH.
Currently, we seem to have repeated a similar Acton though. now, for longer
So, we wait and we will find out..
Bitcoin life cycle-stage One ending-Next cycle has to start NOW
There are 3 things to see in this chart
1) The Orange Arc of resistance. I have talked about this previously but to recap a little, it has its origins in Oct 2009 and has rejected EVERY ATH since then, as you can see on the chart. The Arc itself is part of a Fibonacci Spiral.
This Arc has begun to Squeeze PA against the lower trend line, that was formed in 2011.
And we are now in a position where PA MUST react or get pushed below the Long Term line of support.
This could be called Make or Break time for Bitcoin.
The Apex of this pennant is around Jan 2026
PA always reacts before the Apex.....99% of the time.
2) The Vertical Coloured bars are Trend Based Fibonacci Time, It begins on the 1st ATH in the channel that Bitcoin created. This channel is shown in the chart below
See how the Runs to the 2017 & 2021 ATH were all in a Bullish Green zone and how PA never retouched the lower trend line of support in this time
Since Mid 2021, we entered a Bearish Zone.
On the main chart, you will notice how this Fib Time has just ended.
3) The Trend based Fibonacci Extensions. Every single ATH rejected off a Fib extension.
The Root is at the 2009 Low and 1 is at the First ATH in the Bullish Fib time Zone.
The numbers here are all based off the 3,6,9 number sequence.
Lets look a little closer at the weekly chart
As we can see, PA got repeatably rejected off this orange Arc of Resistance and Current PA has been up there, trying to break through since 2024.
Many people have also commented on how PA has been so subdued this cycle and could this be reflected in the Fib Time showing us that we are in a Red Bearish Zone.
See how, from Mid 2021, when we entered a Strong Red zone, PA took a Deep dive off the Nov 2021 ATH.
Also note how this zone ended in late 2022 and in Jan 2023, PA began its current cycle Run. See the change in Colour ?
And Currently, while Bitcoin tries to break out of this squeeze, we were in a Red zone again....that just ended.
AND we can also see that we have not yet reached the 6 Fib Extension at 120,251 usd
The situation we face here is that if PA gets rejected off that Fib line, having just broken through the Arc, we could get pushed right back down under the Arc again. It is VERY STRONG RESISTANCE
This next move from Bitcoin HAS to be strong enough to take us up to the 9 fib line at 180,391 usd at a minimum. This way we can use the 6 Fib extension as support when PA cools off from a big push and so remain above the Arc and begin the Next long term cycle.
The Daily chart below shows us where we are right now
You can see how PA has repeatably tried to break above the Arc and been rejected Firmly Every time...so far, PA has avoided going right back down to the Lower trend line and has remained in near distance to this Arc..But we are running out of Time.
Recent attempts by PA have been Strong and I am sure that we will make it over but the real question is can we also get over that 6 Fib extension and stay above.
The weekly MACD certainly has enough strength to cope
Should we have a subdued Summer trading on Bitcoin, we will see this MACD cool off and be stronger before a sustained push near Autumn maybe.
To conclude, Bitcoin is under pressure to move out of its First Full Cycle.
It is getting Squeezed and now it is time for Bitcoin to prove it can cope with its new found "Adulthood"
The Next Big push, maybe later in the year, could very realistically reach 200K or more and this would place us Above that 9 Fibonacci extension I talked about earlier.
Of course, events could change and we could see PA collapse back below the Arc.
If this happens, all is NOT lost but it would certainly weaken the case for Long Term holders to continue doing so.
This then could create a Snownall effect and prices may tumble....And I will buy MORE....
Either way, we are in a HUGE moment for Bitcoin and I am privileged to be able see this all unfold...
Lets see what happens but, for me, I am Still VERY Bullish though Cautious....
We may have to revisit low 70K in the near future if Pa cannot get over this Arc and the 6 Fib extension
BITCOIN 5 lines and 3 indicators to watch now we in new ground
I will be presenting a number of charts here and each has a different story to tell right now.
The 5 lines are All valid trend lines.
The Vertical lines are January year markers
The white line at the bottom is th e long term support line from 2013
The Dotted line is a threshold line
The Blue Arc is a line that has rejected EVERY ATH since 2013
The orange line is a marker that, once crossed has Always led to a New cycle ATH
The upper dashed line is the line of rejection of all ATH since 2017
The Weekly Bitcoin PA chart
Here we can clearly see how that Blue Arc has rejected PA previously. We can see how PA has reached a point of intersection and once it crosses that blue Arc, there is a line of rejection just above.
This Blue line needs to be crossed and held as support.
The Daily version of this chart shows ua how we have just crossed that blue Arc.
It also shows us how FRAGILE this is right now. PA is currently testing that Blue line as support
This needs to Hold. If we manage to hold this line and bounce, Stiff resistance is found around 120K
The following charts are showing the following indicators
The 3 indicators used are
RSI - Relative Strength Index. used to measure the speed and change of price movements
TSI - True Strength Index, used to indicate trend direction and overbought/oversold conditions.
ADX - The Average Directional Index (ADX) is used to measure the strength of a trend, not its direction
The 4 hour chart - short term expectations for the weekend
Bitcoin PA the Yellow line at the Top, the indicators are in the order listed above,
First thing to see here is how BTC PA is retesting that Blue Arc - this really needs to hold
RSI (blue) - OVER BOUGHT, It has fallen below its own MA ( average) and could easily drop further today. Looking back along this, we can see how the 4 hour RSI likes to range along the Neutral line, so we may see it drop back to that level today, tomorrow
TSI is also OVER BOUGHT. We can see when TSI is up here, PA ranges while it cools off. But there is room for one little push here if required
ADX ( yellow ) is high showing trend could be getting near exhausted, The orange line is the DI+. This shows positive prince direction, the Red one is DI- and shows that negative price direction is climbing slightly.
In the short term, we need to see PA hold above the Blue line but the likelihood is to possibly back below. There is support below.
The WEEKLY shows us that PA has the ability to continue for a while longer but we are getting near a point where PA needs to recover
Here we can see how the RSI and TSI are both up high, on the edge of OVER BOUGHT but with the ability to rise further.
What is VERY important to take note of here is that ADX.
It is Low, this is indicating that the weekly Trend has lost strength now. It could continue lower.
Remember, ADX DOES NOT SHOW TREND DIRECTION, JUST STRENGTH
So, the thing to see here is that we are in an area where we could see a New Trend begin. This trend could be either Bullish or bearish
On a weekly chart, this change can take a long time to appear in PA
And for the Longer Term, The Monthly Chart gives us hope for a fuhrer push higher for the rest of the year but one little warning bell
WE See Both RSI and TSI up high again, where they have been since 2024. But neither of them are up in OVER BOUGHT as much as they have been in previous cucle Tops.... So we can assume room to move higher.
But what does ring a bell is that ADX again. It is once again, in a place of Change and on this chart, showing that the current trend can start becoming weaker. However, DI+ has plenty of room to move higher
So, in conclusion, we see that BITCOIN has the ability to continue higher but in the short term, we may see a pause and possinle Volatility
Trends are about to change, This could take Weeks and PA can continue higher while a trend weakens.
For me. we are in the last few months of this cycle and at a point of Decision.
PA MUST get over that Blue Arc that has rejected Every ATH since 2013.
If PA fails this, we go back to sub 90K but this is unlikely,
There are numerous projections that see BTC PA in price discovery reaching the 120K before serious resistance.
On this chart, if PA follows pattern and trends, we could see 378K by year end
Getting over that irange line is KEY
Stay safe everyone.
