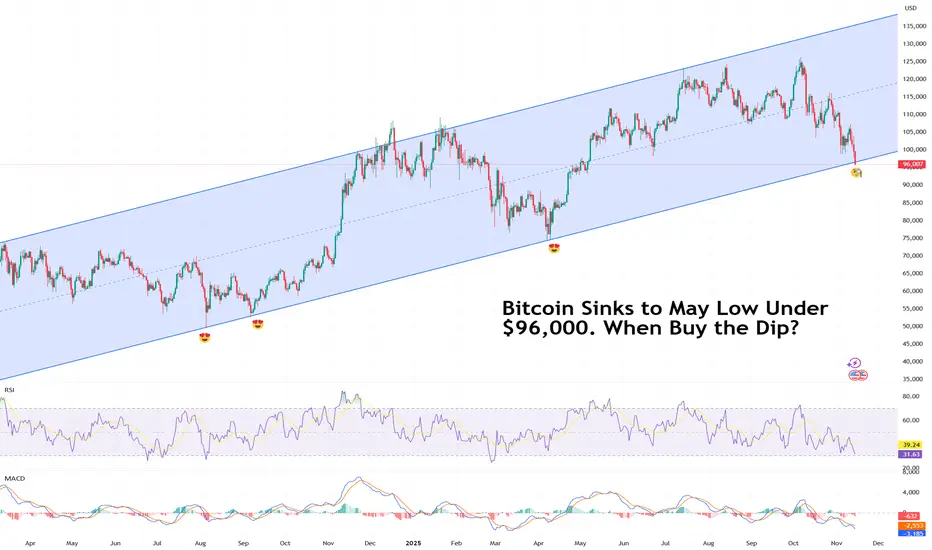
Bitcoin Sinks to May Low Under $96,000. When Buy the Dip?Because sometimes the dip just keeps on dipping.
Bitcoin BITSTAMP:BTCUSD can’t seem to catch a break. The flagship crypto slid below $96,000 on Friday, a level last seen in May, and traders aren’t exactly rushing to buy the dip.
The decline caps a tough few weeks for the OG coin, now lower by about 24% from its record high of $126,000 .
The selloff hasn’t been contained to just Bitcoin. The whole crypto market has been slammed.
Ethereum BITSTAMP:ETHUSD stumbled into the low $3,100s, while Solana COINBASE:SOLUSD fell to the mid-$140s. The entire digital asset space looks winded, and this time, the usual quick rebounders and sharpshooters are sitting on their hands.
What’s going on? In short — traders are nervous, the data floodgates are about to open, and the Federal Reserve isn’t giving anyone the all-clear just yet.
🧨 Buy Dip or Wait for Data?
The end of the US government shutdown should’ve been good news — until investors remembered what comes next.
All the pent-up economic reports that couldn’t be released during the freeze are about to hit the tape: jobs data, inflation numbers, and other key reads that could shape the Fed’s next move.
The bad news: December rate cut isn’t guaranteed. Markets had been leaning heavily on that expectation to justify the monthslong risk-on rally. Now, with the data torrents about to test that narrative, traders are hedging their bets — and Bitcoin’s getting caught in the crossfire.
If the upcoming reports show the economy is still running hot, the Fed might delay cuts. And higher-for-longer rates are basically kryptonite for speculative assets.
💀 Liquidations and Leverage: A Familiar Story
Bitcoin’s latest slump wasn’t just about macro nerves — it was also a good old-fashioned liquidation cascade.
As prices dipped under key technical levels, margin traders got squeezed out in a hurry. According to data from liquidation trackers, over $220 million in crypto positions were wiped out in just one hour. In the past 24 hours? North of $600 million gone.
In previous dips, you’d see traders rushing to scoop up discounted coins, confident that the bounce would follow. The hesitation this time speaks volumes: sentiment’s shifting, and traders are more cautious after months of euphoric rallies in both AI stocks and crypto.
🌡️ The Contagion Spreads
Crypto weakness isn’t isolated anymore — it’s part of a bigger story. Risk assets everywhere are under pressure. The AI trade is cooling, tech stocks are wobbling , and volatility is creeping back into markets that had gone eerily calm.
In short, when traders start treating crypto like a growth stock proxy, Bitcoin stops being a hedge and starts acting like the Nasdaq on leverage.
🪙 So… When to Buy the Dip?
That’s the million-satoshi question. Historically, deep Bitcoin drawdowns during otherwise healthy macro backdrops have rewarded patience. But this time, the setup’s trickier. The next few weeks should bring a barrage of data that could redefine everything from rate expectations to risk appetite.
What can you do now? Watch the data, respect the trend, and don’t fight momentum.
Notice how the long-term upside swing on the daily is still there. But as they say, past performance isn't an indication of future results.
The Fed’s next move, coming early December, will likely decide if this dip becomes a real buying opportunity.
Off to you : Are you looking to buy the dip or you’re waiting for the dip of the dip? Share your strategy in the comments!
Bitcoindip
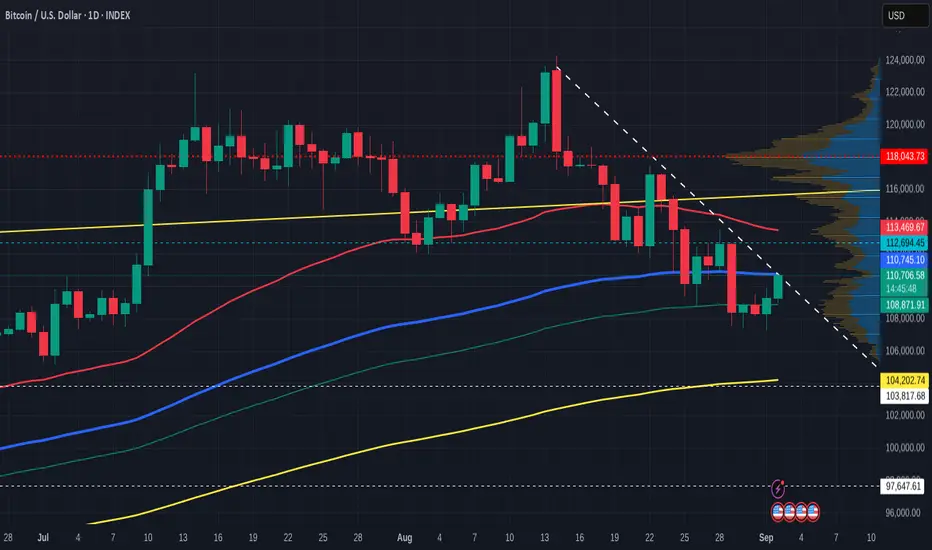
Bitcoin Daily on Lower Low Lower high again -till ?
This chart uses the SMA. Red - 50, Blue - 100, Green - 128 and 200 - Yellow
PA is absolutely in a descending channel with repeated Lower Low Lower high on a daily chart
Today, we will see if we break that or not as PA reaches resistance on a Trend line.
The 50 SMA is descending as potential resistance when the day comes were PA breaks out and reaches higher.
This will happen as I do not believe we are entering a Deep Bear..This is a Local "Cool off" but we may hit a tough one at that 50 SMA at around 113K
Till then, we are hitting the 100 as resistance and the 128 as support.
This may break today as we hit that line of resistance with the 128 SMA not far below.
The DAILY MACD offers some hope of strength as we see it bouncing off oversold
We will have to watch today close to see where we go
If we get rejected today, Next stop down could be the 200 SMA at around 103K low
This line needs to hold to show use confidence in the Bulls.
My line of concern will be reached if e go to 95K and fall through.
This daily chart below shows a number of things to support what is written above.
On this , we see the 2.618 Fib extension around the same area as the 200 day SMA @ 103900 usd
The circle highlights a point where a 236 Fib circle crosses over a rising line of support.
This is around 97K and just below this is another line of support around 95K
People that follow me will know that I often highlight 236 Fib circles as lines of strong resistance and on this occasion, this maybe Exactly why we see PA dropping now.
The intersection is near the end of September, a usually slow month that has a majority of RED Candle Closes on a month chart ( 9 red to 5 Green since 2013)
I am not saying we will get to this level but the potential does exist while we remain in a down trend....
I would hope that PA bounces off the Fib extension on that 200 SMA if we get near that 104K line.
On a longer term, we should take note of the WEEKLY MACD
Should this continue down the line drawn, that takes us to Late October before a bounce ur a more sustained push higher.
We should keep this in mind
I welcome any comments ( Sensible ones..)
BTCUSD TECHNICALS & FUNDAMENTALSKey Technical Details:
Support: Price is resting on the lower trendline of the channel and right above a potential breakout level.
Resistance: The upper channel line sits around $85,000, which aligns with the previous rejection zone.
Bullish Scenario: If BTC bounces off this level and breaks above the short-term resistance, expect a potential move toward $85K and beyond.
Bearish Scenario: A clean breakdown below the trendline could take BTC back to $77,000–$75,000.
Volume Note: There's a notable decrease in volume, indicating indecision—often a sign of a potential breakout soon.
💡 Bias:
Currently neutral to bullish as long as BTC stays within the channel.
📰 Fundamental Analysis (April 8, 2025)
🧨 What’s Moving the Markets Today:
Fallout from April 7’s Inflation Print:
The U.S. CPI data came in hotter than expected, rekindling fears of delayed Fed rate cuts.
This led to panic selling across equities, forex, and crypto on April 7. BTC dropped sharply in reaction.
🌍 Today’s Probabilities:
Macro Uncertainty Continues:
With the inflation shock still rippling, risk-on assets like Bitcoin are in a sensitive zone.
Traders await Fed speakers and FOMC minutes later this week for further cues.
🏦 Institutional Sentiment:
Cautiously Bullish: Institutions aren’t exiting yet, but are being very selective.
BTC’s long-term structure remains strong unless it breaks down from the channel.
✅ Summary:
BTC is consolidating after a post-CPI dump.
A bounce here could send it toward $85K, but a breakdown risks retesting $75K.
Fundamentally, macro pressure remains, so any bullish breakout must be backed by a shift in market sentiment.

BTC Outlook after the Dip. What to expect NOW?BTC Dipped into the CME GAP
Structure shows some weekness
There is still Liqiuidity below left
When are we expecting Price to reverse? Watch the Video for more details.


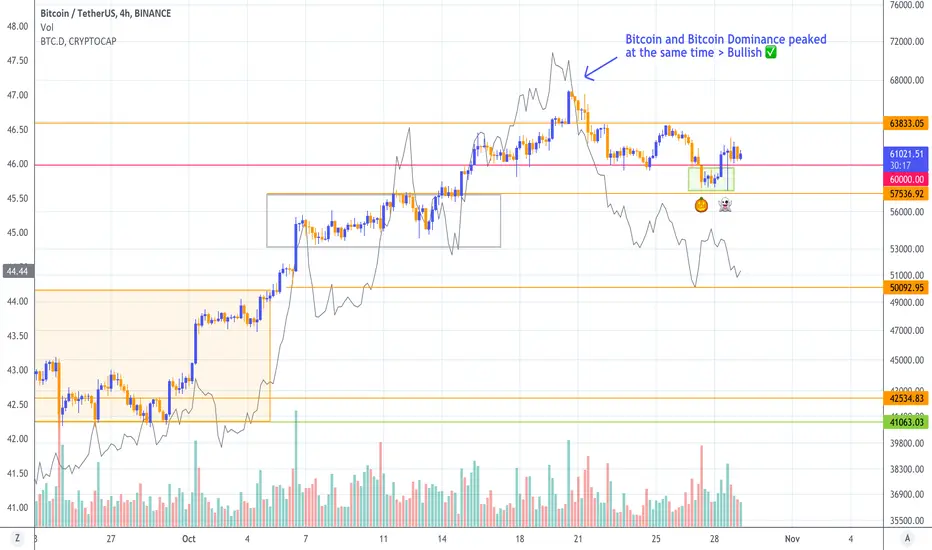
🚀Trick Or TreatHalloween is that period of the year when streets are full of ghosts and monsters. At a closer look, they are just kids asking for candies. If you look closely at the latest "spooky" Bitcoin's dip, you will find many bullish elements as well.
As anticipated, the market was looking for a retest of the first support area. During a retest, the magnitude of the price move does matter! This week Bitcoin dipped below the psychological level of $60,000 just to find another support right above the previous consolidation area.
The price then rebounded back above the breakout level. This kind of price action implies a solid amount of buyer and demand. On the other hand, sellers may not have been satisfied by such a meagre drop from the all-time high. Should they manage to push the price to a new lower low, that would open to a more severe drawdown that will allow them to buy back at more convenient prices. The fight is on, and it could lead to a period of sideways moves between $57,000 and $64,000.
What about Alts? They will undoubtedly be those that will benefit the most from this scenario. The rally of Altcoins in BTC prices started precisely at the top of the latest Bitcoin's run. As the trend began to weaken, investors and traders rotated back their allocation in Alts.
How long will this Alt-party last? Time will tell. Meanwhile, it's worth continuing to keep an eye on the Bitcoin Dominance chart compared to Bitcoin's price. This is the single best indicator to optimise your portfolio allocation and boost your returns in times of lower volatility.
Bitcoin February-April dip comparisonIn this chart I compare the two big dips of February 21st and of April 18th.
In February, the trend met support first at the 0.5 Fibonacci level, then it went up to the 0.382 level which acted as a resistance. It went then down to the 0.629 level and then back up repeating the same pattern. It formed a strong W pattern that ultimately broke the ATH.
This week's dip chart looks very similar to the past one. Bitcoin has dipped but it met the 0.382 support level, and after rising a bit it went back down to the 0.5 support.
As of now, BTC should dip again to the 0.382 support (50k - 51k $) and after completing the W patter should skyrocket to 65k+ dollars.
Hope you enjoyed this quick analysis :)
