BTC.D 1D – Altseason on the HorizonHi fellow traders,
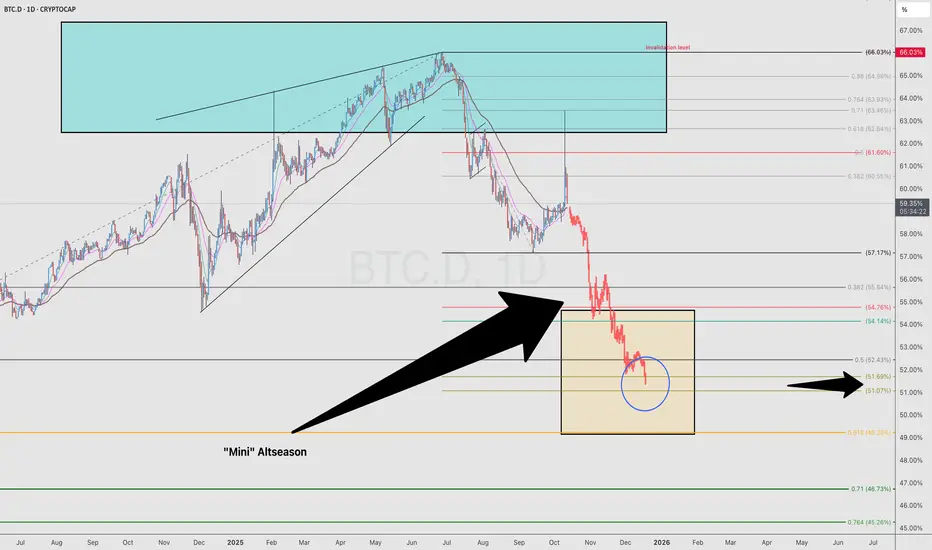
On the 1D BTC.D chart, I am applying Elliott Wave principles and broader market structure to highlight a potential move down toward the 51.7% dominance level. This zone aligns perfectly with the 0.5 Fibonacci retracement and could mark the next key turning point for Bitcoin dominance.
If this scenario plays out, we may witness a “mini” Altseason — a phase where capital begins rotating out of Bitcoin and into altcoins, sparking stronger rallies across the broader crypto market.
This setup isn’t a trade but a macro expectation, and it could serve as a powerful signal for increased altcoin strength in the coming weeks.
Stay alert — things could get very exciting from here.
Good luck and trade safe!
Bitcoindominanceupdate
This is what Bitcoin Dominance Index indicates about the market The Bitcoin Market Dominance Index (often called BTC Dominance) is a metric that shows how much of the entire cryptocurrency market's total market capitalization is made up by Bitcoin alone. In simple terms,
When BTC dominance rises, altcoins may underperform, and traders may rotate into BTC or stablecoins.
When BTC dominance starts falling, it could indicate the start of an altcoin rally
The chart snapshot shows BTC.D from 2018 to current date, with key indications marked for the 2018 - 2021 Bull Run and the current Bull Run. As observed, BTC reached its ATH (red vertical line : Nov 08, 2021) 1064 days since the start of the 2018 - 2021 Bull Run. Another such indication is that during the past cycles BTC has reached its ATH roughly around 201 to 250 days from its immediate halving date. When these two indications are correlated to the current cycle, BTC should top this cycle within the range of mid-September to end October (range indicated within the two vertical red lines)
Another key indication is the falling of BTC.D, marking the start of the Altcoin season. During the previous cycle, BTC.D went sideways during early 2021 before dropping from ~60% to ~39% within a period of 6 weeks. Similar consolidation can be observed in the current cycle before BTC.D starts to drop from ~60% at the beginning of August 2025. This is a strong indication that we are currently running through the midway of the Altseason.
At the time of writing CRYPTOCAP:BTC.D is at 58.55% after reaching a 7-month low of 57.69% after achieving its cycle high of 66.03%. This is a strong indication that Alts domination will continue for the rest of the season until the end of October or probably extended till the year end. Also, since the start of the current Bull Run, this is the first time the 14-day RSI has dropped below its 14-day smoothing SMA further proving the trend reversal.
There are some considerations where the above indications extracted from previous cycle behaviors can be challenged. The investor sentiment is very different compared to previous cycles with institutional adoption of crypto and exposure of BTC and ETH through ETFs allowing ordinary investors to flock into crypto. Also, the current macro-economic conditions and regulatory framework have a significant effect on the market behavior.
These factors might result in BTC.D to not to drop to the levels they dropped in the previous cycle at this stage (varying in between 39% to 46%). So, we might see a replication of drop in value of BTC.D similar to previous cycle but under a different scale.

BTC.D, expected roadmap!Hi fellow traders,
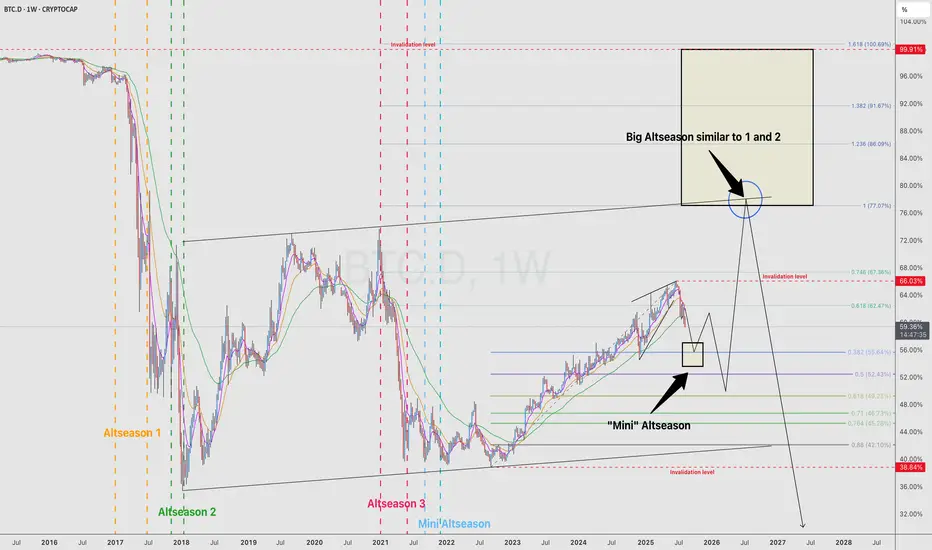
On this chart I’m analyzing the Bitcoin Dominance (BTC.D) on the weekly timeframe using Elliott Wave principles.
Looking at the structure, I expect a major corrective phase to unfold in the coming years. Historically, we have seen two big Altseasons (1 and 2), followed by smaller rallies. My projection suggests we could first experience a “Mini-Altseason” when BTC.D enters the lower golden box, before heading higher again.
This move up could then create the conditions for a much larger Altseason, similar in magnitude to the previous major ones, once BTC.D reaches the higher golden box zone.
Mini Altseason: Potential short-term relief for alts as dominance corrects lower into the first golden box.
Big Altseason: A larger, more powerful move, expected after BTC.D completes a strong retracement into the upper golden box region.
The invalidation levels are clearly marked, and as long as the structure remains intact, I expect BTC.D to respect these Fibonacci-based zones and follow this corrective path.
This analysis indicates that while we may see a temporary bounce in BTC.D the long-term outlook still favors another significant Altseason ahead.
Good luck and trade safe!
BTC DOMINANCE UPDATE- So, all elements are annotated throughout the graphic, like always.
- Timeline.
- Older Top Dom (2021) (red doted line).
- New Top Dom (2025) (red line).
- Some supports ( Orange Line ).
- Some Bottoms ( Green Lines ).
- Most important in chart : Fibonnacci Retracements.
- After this chart, I’ll drop links to my older BTC dominance posts.
- Not much to say, just look at the chart :
- In 2021, BTC.D formed a double top because Bitcoin spiked twice and hit two all-time highs.
- That doesn’t mean BTC.D will behave the same way in 2025. I don't expect another double top, but who knows.
- We could see a retracement down to the 45–47% range. That would likely signal the start of a new bear market.
- For now, i don’t see the end of the bull run yet. I’m mostly waiting for a strong BTC push in price, a fast dip in BTC Dominance, and the kickoff of Altseason.
— it’s going to be wild and fast! Just my personal opinion.
Stay Safe !
Happy Tr4Ding !

Bitcoin Dominance: Don't Be So OptimisticHello, Skyrexians!
My previous CRYPTOCAP:BTC.D forecast now is playing out well. I bet for the reaching 65.35% before drop, we have seen 65.5% which is almost the same. Now dominance is dumping, but I warned you it's not the end. Now I will give you small update.
I will not cover higher degree waves, you can check previous articles, let's cover only this Elliott waves cycle. The wave 3 now is finished slightly above the 1.61 Fibonacci level and now is printing wave 4, to make sure that wave 4 is finished we want to see the Awesome Oscillator zero line cross and reaching the target area next to 63.5%. After that I expect wave 5, it's not going to be extended because wave 3 is extended, so, the target is 65.5% again to retest. After that we can wait for bigger correction to 61%.
Best regards,
Ivan Skyrexio
___________________________________________________________
Please, boost this article and subscribe our page if you like analysis!

ALT COIN SEASON IS JUST WEEKS AWAY, HOPE YOU HAVE YOUR BAGS FULLHey Traders,
We’ve been watching this Bitcoin Dominance (BTC.D) chart closely — and it’s heating up again!
For those unfamiliar, BTC Dominance tracks the percentage of total crypto market cap that belongs to Bitcoin. When BTC.D rises, it typically means altcoins are underperforming compared to BTC — either due to their market caps falling, or BTC’s increasing. When it drops, altcoins are gaining ground.
While this chart won’t tell you whether markets go up or down, it’s critical for spotting where to diversify and when. It’s a must-have tool in your crypto trading utility belt.
⸻
Why This Chart Matters Now:
We’re nearing the top resistance trendline of a long-term triangle formation that dates all the way back to 2017. This line has rejected BTC.D multiple times in the past — and we’re back to test it again, hovering between 63% and 66% dominance.
Each of these rejections previously led to a drop in BTC Dominance — which triggered powerful altcoin seasons.
⸻
Key Bearish Signals:
• Bearish Divergence on the MACD
• MAJOR Bearish Divergence on the RSI
(Just like before previous alt seasons!)
• TOTAL2 (the white line representing all altcoins) looks poised to spike if history repeats.
Altseason Clue: When BTC.D forms bearish divergences on these indicators, it’s often followed by a surge in altcoin market cap — a key early signal we may be close to another one.
⸻
BUT… This Isn’t 2021 Anymore:
Let’s be real — the market has changed. Solana-based launchpads like Pump.fun and Jupiter DEX have revolutionized how easily tokens are created and traded. That’s new capital flow and speculative behavior we didn’t see last cycle.
Plus, the geopolitical landscape is shifting fast. With President Donald J. Trump calling for crypto regulation frameworks within 180 days, we may soon see an influx of institutional money — but it could come with strings attached.
⸻
Final Thoughts:
A breakdown in BTC.D could mean a major rotation into alts — but don’t bet the farm.
Markets could still dump. We may even skip altseason altogether this cycle.
However, this chart gives you a crucial edge — so use it wisely. Know your tools. Zoom out. Plan ahead.
As always — stay sharp, stay safe, and stay profitable out there.
— Savvy

Let's Watch Bitcoin Dominance Together!Hello, Skyrexians!
You may think that we make analysis on CRYPTOCAP:BTC.D too often, but it's needed because as we pointed out many times we are closed to the global top and it's important to predict when altcoin season starts.
Today we have 12h time frame to look in details at final wave 5 inside global 5. Wave 3 inside this wave is about to be finished at 64.85%. This is not new information. You can check our previous 12h analysis and see it. Today price has reached the target and soon we have to see the reaction and small correction to 0.38 Fibonacci at 63%. During this drop altcoins may show great performance, but after that last shakeout will happen. After that we expect 3-5 months of dominance decrease.
Best regards,
Skyrexio Team
___________________________________________________________
Please, boost this article and subscribe our page if you like analysis!

Bitcoin Dominance Is Printing The Last Shakeout Hello, Skyrexians!
Recently we pointed out that CRYPTOCAP:BTC.D is in the last bullish wave which has a target approximately at 66% and the bear market on altcoins is almost over. Today we will look in details on this wave inside and try to predict the most precise scenario.
Let's take a look at 12h time frame. Here we can see the wave 1 and 2 and now price is in wave 3. Fibonacci extension levels 1 and 1.61 is the target for wave 3. Looking at the current wave we can say that it's not over, so it will likely to see 64.7% in this wave before the correction. Correction is going to be subwave 4 which will likely be finished at 63% then we have the last wave which can be equal to wave 1. In this case predicted earlier 66% will be reached at the end of April.
Best regards,
Skyrexio Team
___________________________________________________________
Please, boost this article and subscribe our page if you like analysis!

Bitcoin Dominance, We Are Waiting For You!Hello, Skyrexians!
We are changing color according to the new upcoming market cycle phase, hope our forecast will be realized and it's time to be bullish. CRYPTOCAP:BTC.D is about to flash the reversal signal, while altcoins dominance and USDT dominance are already did it, but we don't also forget about disaster targets.
Let's take a look at the daily chart. Earlier we told that this is final wave 5 and now we are trying to catch its top. We mentioned that dominance will enter into 63-66% target area and it did it. Now we have to be focused on the reversal signals. For example Bullish/Bearish Reversal Bar Indicator has already printed the red dot at the top. Moreover Awesome Oscillator started reversing. You can say that this is the top, be our intuition tell us that some small move to the upside will be continued to 65%. Also we need to mention about nightmare wave 5 extended target at 70%, but this scenario is unlikely because it will break the divergence on the daily chart.
Best regards,
Skyrexio Team
___________________________________________________________
Please, boost this article and subscribe our page if you like analysis!

XRP could flip Bitcoin again at the end of this cycle around Sepothers.d is ready to bounce after 5 red monthly candles. Just like December 2016.
while Bitcoin Dominance looks like this under Trump 2.0 trolling the economy on a much grander scale while XRP has already given us a tease of what's to come this cycle reaching a historic new ATH. And tether on the other hand, unstoppable! They are about to print so much money they could at some point flip Ethereum while Ethereum finally goes home.
Imagine if XRP and tether flip Bitcoin together (relax! it wouldn't be the 1st time. XRP did in Jan 2018 if only for a moment)
Looks promising now that Europe offered 0 to 0 tariffs. 1929 scenario could take years since dedollarization takes years to develop. (it's not going to happen overnight.)
Spring is finally here. Buy others like VeChain (the next xrp this cycle)

BTC Dominance: We Warned You And It's HappeningHello, Skyrexians!
A lot of hating comments we received under our recent CRYPTOCAP:BTC.D analysis. Now we sure that market always go against the crowd. This is the super valuable experience and we want to say thanks to all haters. Now let's update this idea, try to understand the structure on the wave 5 drilling into lower time frame.
Let's take a look at 12h time frame. We can see that after the spike in the wave 3 price retraced with the ABC zigzag and started the new wave 5. Waves 1 and 2 inside this wave have been finished. Wave 2 reached exactly 0.61. Now we can measure wave 3 target. 1 and 1.61 are the potential target. The most realistic one is 64.7%. Then we expect the wave 4 and the last leg up into subwave 5. Always look at the divergence on the Awesome Oscillator to measure the trend end.
Best regards,
Skyrexio Team
___________________________________________________________
Please, boost this article and subscribe our page if you like analysis!

WARNING! Sell Your Altcoins, They Will Go To Zero!Hello, Skyrexians!
We had some doubts in this scenario, but now price action clarified it. CRYPTOCAP:BTC.D has finally decided to pump in the wave 5 and this wave can be even extended. Altcoins Will lose 70% of their value and never pump after that to cover your losses.
Let's take a look at the daily chart. We have already shown you this Elliott waves picture. Earlier we mentioned that may be wave 5 was shortened, but not, it has finally decided to reach new highs at 66% at least, in case of normal wave 5, but just imagine if it will reach 70%, the extended target. Your portfolio will be -70% from the current price. We need to be honest with you, altseason never comes and we have to forget about it.
Best regards,
Skyrexio Team
___________________________________________________________
Please, boost this article and subscribe our page if you like analysis!

66% Is About To Cancelled For Bitcoin DominanceHello, everyone!
Earlier we made analysis on CRYPTOCAP:BTC.D where pointed out that it can reach 66% before altseason or reverse from 62.5%. Now it looks like we can see the second scenario because momentum is almost gone and we are about to see the second confirmation of trend change.
Let's take a look at the weekly chart. Like the previous time we still have active red dot signal on Bullish/Bearish Reversal Bar Indicator . We have the great angulation with the alligator. This time we also have the double divergence with Awesome Oscillator which has been almost confirmed. We wanna see the three red columns in a row and this reversal is going to be strongly confirmed. The minimum target is 0.5-0.61 Fibonacci zone, but in case of true altcoin season we can see the new all time low.
Best regards,
Skyrexio Team
___________________________________________________________
Please, boost this article and subscribe our page if you like analysis!

Bitcoin Dominance Says That Bear Market Is Almost Over For Alts!Hello, Skyrexians!
We hope you enjoy our yesterday Bitcoin analysis which is now playing out. Daily candle closed great, but this reversal is still unconfirmed. So, we are still in danger. Today we will take a look at the CRYPTOCAP:BTC.D again, this chart is annoying, but is finally approaching its reversal point.
Let's take a look at the weekly time frame. Here we can see the 3 red dots on the Bullish/Bearish Reversal Bar Indicator . Now we will try to learn now to ignore the false signals. The first dot formed on the very weak bar with no angulation with Alligator. We can's use this. The next bar was great, but it was just the wave 3. The best signal is the last one. We have angulation, bearish divergence with AO and the potential wave 5. This reversal has been confirmed.
Expect the reversal from the current percent because price is inside the Fibonacci 0.61, or in the worst case earlier mentioned 66%. This is going to be wave 5 in 5.
Best regards,
Skyrexio Team
___________________________________________________________
Please, boost this article and subscribe our page if you like analysis!

Weekly BTC.D expectation ahead! Hi fellow traders, BTC.D will be completing a weekly corrective pattern in the upcoming weeks resulting in a move higher on various Altcoins. After the the structure is complete it will continue higher towards the blue box area. Good luck and trade safe!

Update the scenario for BTC.Dom - When might Altseason actually?Currently, BTC.Dom CRYPTOCAP:BTC.D is following the second scenario I mentioned in my previous post. This is the only scenario I can think of right now.
According to this scenario, I predict that from now until Trump's inauguration, it will remain quite challenging for Altcoins.
To determine whether Altseason will occur, it’s best to wait until the beginning of February to make an informed decision about deploying capital.
The image below shows instances of the M-pattern , where the second peak is higher than the first, followed by significant **Altcoin growth** in previous seasons.
If this second scenario doesn’t play out, my concern is that BTC.Dom could return to the 70 region. In that case, Altcoins would be completely crushed, and I truly hope this worst-case scenario doesn’t happen. :(

Get ready for ALT-SEASON!We got confirmation on breaking uptrend channel downwards in last few weeks and we all know what that means. More CRYPTOCAP:BTC.D goes down better for alt-coins. 47-51% is the range I am looking for. There are few alt-coins haven't made major moves in last year, I will post about it soon. Keep posted!

Return Of The Alts Season. Wait For It!Macro scenario shows falling RSI for Bitcoin Dominance , BTC.D . We may be welcoming a return of the Alts Season that seemed to go on a pause when CRYPTOCAP:BTC went to 92k.
I foresee a near support level where it will bounce a bit, hit a near-resistance and continue downward. The overall daily trend is already bearish.
Some major alt coins have completed their correction and can't wait to go parabolic. Coins like CRYPTOCAP:DOGE , CRYPTOCAP:LTC , CRYPTOCAP:SOL and others.
See d rawings on the chart it's as clear as day!
Comment and like if you disagree. Merry Christmas 🎄

Bitcoin Dominance BTC.D Pushing Higher Toward 60% LevelFinally some strong moves in money flow into Bitcoin.
We can see the Bitcoin Dominance BTC.D Pushing Higher Toward 60% Level.
This is a strong signal that money is flowing into Bitcoin, likely from BTC ETF's.
The biggest thing holding it back in my opinion is the DXY has been pushing higher also, but is at a resistance level, and will likely drop from here.
So we're likely close to a rally in Bitcoin, but I think we'll see a few days of retracement 1st.
Nice looking upward trajectory on BTC.D here.

Sell Signal For Bitcoin DominanceOn Friday, my indicator combo gave us a big old SELL, meaning dominance by Bitcoin is about to dump. This does not mean the price of BTC will drop. In fact, it could continue to rise.
What it signals is that the altcoin market is about to 🚀🚀🚀! Therefore, if Bitcoin rises, Altcoins will rise even faster. Get ready! The rocket ship is about to launch for alts. Bull run incoming.

Bitcoin Dominance at key levelBitcoing dominance at a critical level now. If BTC.D break upper line with weekly candle, BTC will pump more and BTC will make a new ATH in 2024.
Disclaimer: The information and analysis provided in this publication are for educational purposes only and should not be construed as financial advice or recommendations to buy, sell, or hold any securities. The author and TradingView are not responsible for any investment decisions made based on the content presented herein. Always consult a financial professional before making any investment decisions.

Bitcoin dominance: Bull continuationCorrection from 54.40% to 52.8% looks like it has completed completed with a mini divergence in price and volume,
Based on the chart, you can see a 3 wave correction cycle which is WXY has completed, and from here Bull continuation cycle is expected to the new ATHs.
Expect Bitcoin and other tokens or crypto currencies to continue rising.

BTC.D WILL NEVER REACH 58% EVER AGAIN AND/OR HOLD IT.The statement is made to stablish what I believe is obvious, but considering what I've been learning from all on CT, this is my opinion of course, not financial advice.
BTC market share around 10T Total Market Cap would reach maybe 3.3 on present cycle, where ETH may reach 1.1 with SOL.D above it by small % maybe reaching 14% on a very tiny window.
All behaviour of Altcoins Dominance regardas past cycles is suggestion the market share is going to expand (logic) and the race would be to hold above 10% and for BTC to hold AND sustain, above 25%.
I Believe BTC will touch the base of the Fib Channel, around 14% meanwhile the window closes and the market shuffle is over.
Happy Harvest.
