Bitcoin Sky‑View Analysis - Real Drop Comes NextIn this video, I break down Bitcoin from a true top‑down perspective, starting with the quarterly (3‑month) chart and drilling all the way down to the 4‑hour timeframe. The higher‑timeframe structure forms the foundation of the broader thesis—it is not designed for trade entries or exits, but for understanding where Bitcoin is positioned in its macro cycle.
On the 3‑month chart, Bitcoin has found support at the 21 EMA, which aligns with the 50 EMA on the monthly timeframe. This behavior mirrors the structural pause we saw in 2021. Based on this pattern, I expect price to hold this region into next month before a potential major sell‑off into the deeper liquidity zone between $49,000 and $56,000.
However, I do not expect a final bottom in that zone. The Stochastics cycle—one of the most reliable tools for timing Bitcoin’s macro highs and lows—has not yet reached the 20‑level floor. Until that cycle completes and turns upward, it is premature to call a long‑term bottom. When the Stochastics cycle finally resets, that will be the ideal accumulation window for the next major rally.
On the weekly and daily timeframes, indicators are already oversold, suggesting Bitcoin may continue to move sideways while momentum resets. During this consolidation, I expect liquidity to be taken on both sides of the range—toward $75,000 on the upside and $62,000 on the downside. This is classic market‑maker behavior, so trade with caution.
This analysis reflects my personal outlook and is not financial advice. If you find value in these breakdowns, show your support with a boost and share this with a trader you care about—you might help them avoid a costly mistake. Let’s continue growing as a community that studies, understands, and masters the markets together.
Cheers!
Bitcoinforecast

Bitcoin Bullish towards ATH ?Bitcoin Chart Analysis + Targets Long & Shorts
Timeframe = 1D
Resistance - 46830 ( 0.5 Fib )
Major Resistance - 51084 ( 0.618 Fib )
If broken then we see --> 57135 (0.786 Fib)
If Rejection at 51084 (0.618) we going back to the
Support 1 = 46830 ( 0.5 Fib )
Support 2 = 42575 ( 0.382 Fib)
Ichimoku Cloud is very bullish on daily timeframe.
Ofcourse there will be pullbacks but momentum and acceptance of Bitcoin is spreading way more than 2017 rally.
What are your thoughts ? this is my first post, hoping to get warming and positive responses :)
Regards,
Cryptonizz.com
Cryptonizz

Bitcoin Price Analysis: What's Going On in Late December 2025?Hey everyone , Bitcoin is hovering right around $88,000 – give or take a few hundred bucks depending on the exchange. It's been a wild ride this month, honestly. We saw it flirt with $89,000-90,000 earlier, but it's pulled back a bit amid all the holiday thin trading and macro jitters.I've been watching the charts closely, and right now, BTC is stuck in this frustrating downtrend channel that started after the big highs earlier in the year (remember that $126,000 peak?). It's been chopping sideways mostly between $85,000 and $94,000 after bouncing off that solid psychological level at $80,000.
Weekends have been interesting – price keeps teasing the top of the channel, but then it rolls over and starts sniffing out lower liquidity pockets, like around $86,000-$88,000 where we are now.
The Big Picture: Still Bearish Short-Term?
Look, the overall market structure feels bearish to me in the near term. We've got lower highs and lower lows forming, and the order flow isn't screaming "bulls in control" yet.If we start seeing more consistent selling pressure pushing toward $85,000, I wouldn't be shocked to see a breakdown there. That could open the floodgates – trigger some liquidations around $80,000 and send us tumbling into that Low Volume Node (LVN) zone between $75,000 and $78,000.
That area was a key pullback spot back in April, so it might hold as decent short-term demand.
But if it doesn't... well, things could get messy quick.
Deeper Supports and Potential Buyers
Way down below, there's this wider High Volume Node (HVN) from $60,000-$70,000. That's where a lot of volume piled up historically, and I suspect there are some passive buyers – you know, long-term spot holders – sitting there. If they don't panic and start absorbing the supply, selling pressure could fade, and we might see a shift.
But honestly? Selling doesn't look exhausted yet.
Could We Bounce Back to $100K?
Don't get me wrong, I'm not all doom and gloom. If those lower zones hold strong – especially the LVN at $75K-78K – we could get a nice relief rally. That might flush out some trapped sellers from the November highs and push us back toward $100,000 to squeeze the shorts.
It's happened before. Crypto loves liquidating everyone eventually.
Quick Scenario Breakdown
Here's how I'm thinking about it right now:
🔴 Bearish case (my base for now): Break $85K → liquidations → test $75K-78K LVN → possible slide to $60K-70K if panic sets in.
🟠 Sideways grind: We just chop in this $85K-$94K range through the holidays – low volume, no real direction.
🟢 Bullish surprise: Strong hold at lower supports + shift in order flow → rally to liquidate sellers at $100K+.
At the end of the day, anything can happen in this market – that's the beauty (and frustration) of it. I've been trading crypto long enough to know that being flexible is the only way to stay profitable. Right now, I'm cautious on the upside, watching order flow and those key levels.
If you're trading this, manage your risk – stops below recent lows if long, or above recent highs if positioning short.
What do you guys think?
Bullish reversal incoming, or more pain first?
Drop your takes below.
Stay safe out there!

Bitcoin Short Term Sell Trading Opportunity SpottedH1 - Bearish trend in play
Two Solid Resistance Levels
Trend continuation very likely after pullback.
👉 If you enjoy this analysis, please Like, Follow, and Support the profile! Your engagement motivates us to share more quality setups.

Bitcoin - Looking To Sell Pullbacks In The Short TermH1 - Strong bearish move.
No opposite signs.
Currently it looks like a pullback is happening.
Expecting bearish continuation until the two strong resistance zones hold.
If you enjoy this idea, don’t forget to LIKE 👍, FOLLOW ✅, SHARE 🙌, and COMMENT ✍! Drop your thoughts and charts below to keep the discussion going. Your support helps keep this content free and reach more people! 🚀
--------------------------------------------------------------------------------------------------------

Bitcoin ¡WARNING! Bull-Trap Forming Week of January 12thHappy New Year! Please take a look at my related Idea below: BTC Bitcoin 2026 Outlook 🔥 for a more detailed long-term explanation.
January RALLY has so far played out as expected 🐂🎯 although it had an important pull-back the week of January 5th thus showing weakness. The strongest WEEKLY TARGET for a Turning Point is this week January 12th , more precisely around Tuesday 13th .
The trading playbook is to sell either around Tuesday 13th or as soon as price begins to cross the $94k levels.
We should see a resumption of the bear-market downtrend with a 3-month heavy sell-off from February into late April, early May 🩸🐻.
Today I'm posting separate Ideas for ETH, SOL & MSTR 📈 please follow me and check out my ideas.
Good luck! stay safe 🙏🏻

BTC Analysis: Rising Channel Resistance & Volume Divergence
1. Reaching Ascending Channel Resistance
Looking at the turquoise Ascending Channel on the chart, the current price has reached the top of the channel (resistance line).
In technical analysis, the upper boundary of an ascending channel acts as a strong resistance zone. Unless there is a strong breakout (overshoot), the price tends to revert to the channel's median or bottom. Therefore, selling pressure (profit-taking) is likely to dominate in this area.
2. Bearish Volume Divergence
The most critical signal is indicated by the white arrow on the volume indicator.
Phenomenon: The price continues to make Higher Highs, but the volume is making Lower Lows.
Implication: This is a classic 'Bearish Divergence' signal, indicating that the buying momentum driving the rise is becoming exhausted. It suggests a lack of "fuel" to sustain the rally, meaning a trend reversal is highly probable in the near term.
3. Volume Profile & Support Retest Required
Pay attention to the gray Volume Profile on the left and the yellow box.
POC (Point of Control) Reversion: The longest bar in the volume profile (white line, approx. 87.8k) represents the 'High Volume Node' where trading was most active. Due to the rapid price increase, it is highly likely that the price will retrace to this zone to fill the low-volume areas and retest support.
Box Top Support Confirmation: It is not yet clear if the top of the yellow consolidation box (approx. 90k) has successfully flipped into support after the breakout. Therefore, a healthy correction down to the 90k–88k range (indicated by the red line) is expected.
4. Liquidity Zones
Although the chart shows an uptrend, the dense yellow liquidity zone formed just below at 91.8k is likely to act as a magnet pulling the price down.
Therefore, it is reasonable to expect a short-term pullback to around 91,800 USDT. The market will likely decide whether to resume the uptrend or decline further after sweeping the liquidity in this area.
5. Coinbase Premium
The Coinbase Premium has been rising for the past 4-5 days, but it remains in negative territory.

Is Bitcoin bottoming?Is Bitcoin bottoming?
We've typically seen these consolidation periods as a bottom signal for Bitcoin.
This could spell bottom if we hold and break out to the upside.
If we break down, then I see a retest of the original 2024 breakout around $70k, friends.

Bitcoin prediction 2022, BTC Temporary pullback to $36,000 Bitcoin temporary pullback to $36,000 level or beyond if sellers dominate.

Bitcoin: Liquidity Void Signals Potential DeclineFenzoFx—Bitcoin dipped below $99,000.00 as expected and now trades near $95,630.00. Friday’s selloff created a bearish fair value gap, viewed as a liquidity void.
Technically, price is expected to revisit resistance between $96,700.00 and $99,000.00. If the gap remains partially unfilled, especially in its upper half, further downside is likely. In this scenario, Bitcoin’s next bearish target could be $90,000.00. The bearish outlook remains valid while price stays below $108,800.00.

Technical analysis of bitcoin key levels and wedge chart pattern1. Trend Structure
The descending trendline (Resistance line) at the top of the chart remains valid.
The price has repeatedly faced rejection at this level, indicating that the medium-term downtrend is still intact.
2. Key Price Levels and Indicators
50-week EMA
The price has recently recorded its third downward break below the 50-week EMA.
From a traditional technical perspective, this is viewed as a signal that strengthens the possibility of a medium- to long-term bearish shift.
POC (Point of Control)
The mid-range POC is acting as a strong supply zone,
and recent rebound attempts have also failed to break above this level decisively.
3. Liquidity Zones
Two major liquidity zones are marked in the upper and mid sections of the chart.
Liquidity zone near 112k (upper zone)
A cluster of large liquidity pockets and liquidation points
If a short-term rebound occurs, this is the first upside target likely to be tested
Liquidity zone near 102k (mid zone)
Overlaps with the 4h FVG, making it a level closely watched by both buyers and sellers
4. FVG (Fair Value Gap)
Multiple FVGs are present on the 4-hour timeframe, with some already filled.
Unfilled FVGs have a high probability of being revisited as the market corrects in the future.
5. CME Gap
All weekday CME gaps have already been filled and may act as short-term resistance.
A weekend gap forms when Monday’s CME opening price starts above 95.4K.
6. Current Market Structure Interpretation
The price is currently attempting a rebound from the lower boundary of the downtrend.
However, several resistance layers overlap—POC, FVG zones, and trendline resistance—raising the likelihood of heavy selling pressure on any upward move.
In the short term, volatility consolidation is expected within the 96k–100k range.
7. Potential Formation of a Lower Wedge Pattern
The price has broken below the lower boundary of the wedge pattern, accompanied by rising volume.
A short-term rebound is likely, and if the price re-enters the wedge, further upside momentum may follow.
If the lower trendline is not reclaimed, the structure may shift into a range after a retest.
8. USDT.D Chart Analysis
The price has once again touched the upper boundary of a downtrend line that has persisted for over a year.
Downward pressure on the USDT dominance chart suggests potential upward momentum for Bitcoin.
Technically, this zone offers conditions supportive of a short-term rebound.
9. Summary
The medium-term trend remains bearish, with the ongoing breakdown below the 50-week EMA reinforcing a sustained bearish outlook.
A short-term bottoming attempt is visible, but dense supply overhead limits the strength of any rebound.
FVGs, POC, and liquidity zones overlap near the current price region, increasing the probability of heightened volatility.
If you found this content helpful, feel free to support with a boost (🚀) and a comment (💬).
Your encouragement helps drive better analysis and more valuable content.
Follow the page to receive notifications (🔔) for future posts.

Bitcoin - is at cross road Bitcoin - is at cross road
price is at Key reistance pVAL which is a powerful area for a short but we need clear bull trap to trade it
that's why my short scenario possible in a cae of bull trap
Bullish plan - long in a case of squeezing up

Bitcoin price forecast, short-term BTC chart analysisResistance line: Represented by a red diagonal line indicating a downtrend, suggesting that the price may struggle to break above this level.
Support line: A green horizontal line at the bottom of the chart, marking the support area where a recent W pattern formed, currently around 99K.
CME gap: Highlighted in yellow at the center of the chart, representing a short-term resistance area.
Parallel channel: Formed by two gray diagonal lines, illustrating the range within which the price is likely to move.
POC (Point of Control) line: A red line cutting across the center of the chart, representing the price level with the highest trading volume. Currently around 110,000 USDT, it can serve as a key support or resistance level.
Liquidity zone: The area where the POC line near 110,000 USDT overlaps with the upper boundary of the parallel channel, indicating a zone of highest expected liquidity. This is where short stop losses and long take profits are likely to cluster.
Predicted path: Shown in green, suggesting the price may bounce off the support line, rise along the parallel channel, break through the CME gap, and move toward the liquidity zone. If it breaks the red resistance line, the ascent toward the liquidity zone could accelerate.
Conclusion: Bitcoin is expected to gradually rise as it overcomes resistance levels, ultimately reaching the high-liquidity zone around 110K–112K. This analysis is based on current market conditions, and actual price movements may differ due to various market factors.

Bitcoin Correction Eyes $108,800FenzoFx—Bitcoin rebounded from $99,300.00 and is now trading near $106,000.00. This upward move is likely a corrective phase, with potential to fill the liquidity void up to $108,800.00.
The equal lows at $99,326.00 remain vulnerable after repeated tests. We expect the downtrend to resume once BTC reaches the bearish fair value gap near $108,000.00. If confirmed, the next bearish targets are $100,000.00 and $90,000.00. The bearish outlook remains intact as long as the price stays below $116,576.00.

BTC ETH SOL Ready for a DIVE?Just a knee jerk high bounce before a waterfall event into Wednesday...

BTC ETH NOT Looking Good!This is not good. I'm switching from LONG to SHORT or at minimum going NEUTRAL until the direction is fully confirmed.

BTC/ETH/USD Decline ContinuesYou can see that BTC has a lot more concentrated support levels around $100k-102k and it could wick down to $98k briefly but it seems $100k will hold at the weekly close. We could see a final BTC LOW this Thursday 6th.
ETH not so much. There's not enough strong support level and it can continue declining into next week with the expected bounces along the way. Either way, it's a good buying opportunity for sure.

BTC Correction Possible Before Further DropFenzoFx—Bitcoin continues its downtrend after dipping below the bearish fair value gap, now trading around $104,150.00. Immediate support sits at $103,400.00. A daily close below this level could trigger further downside, with thin liquidity below.
Technically, a correction may occur first, potentially pushing BTC toward $108,800.00 before resuming the decline. If $103,400.00 is breached, the next support levels are $100,000.00 and $98,000.00.

SELL BITCOIN Btc/Usd - Amazing low risk high reward trade!Based on our deep analysis we can see that BTC/USD Bitcoin will head to the downside. Great time to buy - it has broken major support levels + trends.

Bitcoin Eyes Double Top After SelloffFenzoFx—Bitcoin is consolidating near $112,160.00 after a major selloff, testing this level as support. Price action shows a double top at $116,078.
From a technical view, BTC may aim for this level if it holds above immediate support at $112,143.0.
A close below $112,143.0 could trigger a deeper downtrend, with the next bearish target likely at $100,000.0.

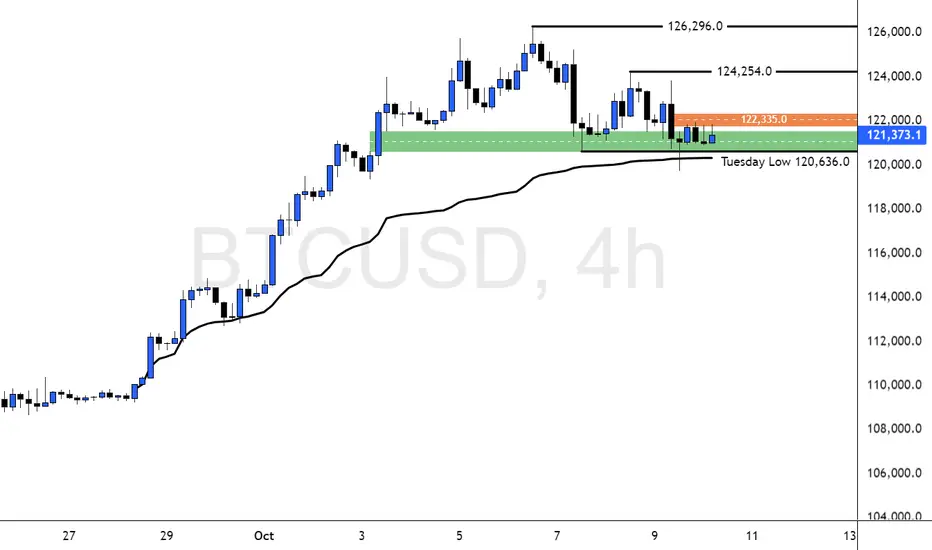
Bitcoin Leaps for a New Bullish Run Above this ResistanceFenzoFx—Bitcoin remains bullish. Yesterday, price dipped below Tuesday’s low, but failed to close beneath it. This support zone is backed by a bullish fair value gap and anchored VWAP from September 28.
Immediate resistance stands at $122,335.0. If bulls close above this level, BTC/USD could target $124,254.0, followed by all-time-high. However, the bullish outlook is invalidated if BTC/USD closes below recent lower lows.
Bitcoin Hits $124K—Volume Lags BehindFenzoFx—Bitcoin reached a new all-time high at $124,533.0. While price broke higher, volume lags behind on the cumulative profile. The trend remains bullish, but a pullback is likely.
Retail traders should wait for BTC to dip into the liquidity void (fair value gap) around $116,000.0, offering a discounted entry into the bull market. If BTC/USD closes and stabilizes below this gap, deeper consolidation may follow toward the next support at $111,582.0.

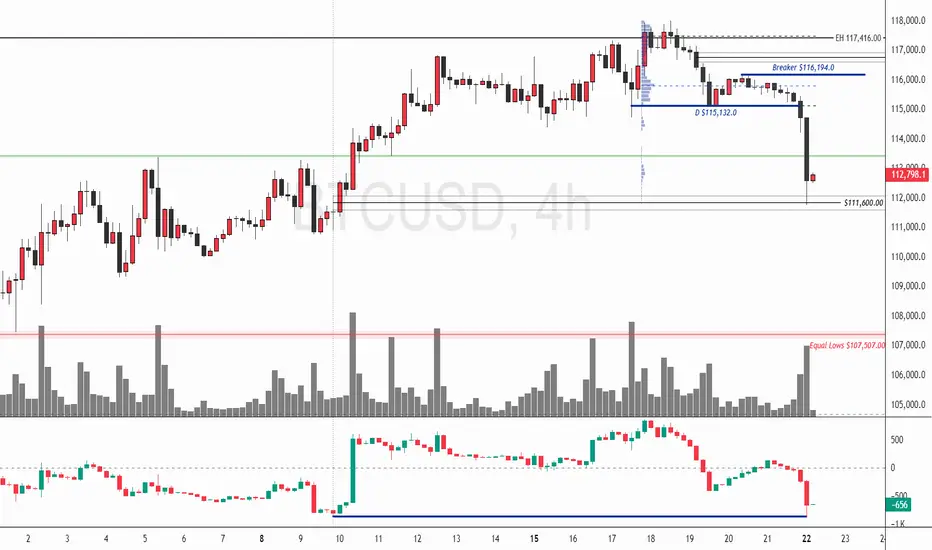
Bitcoin: Volume Spike Signals Temporary ReliefFenzoFx—Bitcoin sold off early in the week, now trading near $112,670.00. A high-volume 4-hour candle tapped the bullish FVG and ended with a wick, suggesting partial profit-taking by bears.
The short-term trend remains bearish due to displacement below $115,132.00 and active bearish FVGs. BTC/USD may consolidate near resistance before resuming its downtrend. If price rises toward the low-volume node near $115,132.00 and holds bearish momentum, it could target the equal lows at $107,507.00.
The bearish outlook is invalidated if BTC/USD closes above the breaker block at $116,194.00.