Post Bitcoin Halving Drop ???Hi friends hope you are well. Today I want to discuss that is it necessary for the Bitcoin to drop pre or post halving? In order to understand this principle we need to see the previous Bitcoin halvenings then we will move to the current having. If we watch the Bitcoin halving 2012 then we can observe that before halvening the price action dropped more than 25% and this bearish move was ended before the halving. On the other hand if we watch the Bitcoin halving 2016 then the price action started dropping down before the event and this bearish move was continued even after the halving event. During this drop BTC lost more than 40% of its value.
Now if we move to the current halving event then it can be seen that before halving we have witnessed a very strong bearish move that leaded the BTC more than 65% down in the March 2020. Most of the traders say that this drop was due to the world pandemic issue. Therefore it is possible that this down move doesn't have any connection with pre or post halving drop. If we accept this then we can expect that the drop has been started since 8th of May when the price action reached at $10000 and started dropping down.
The exponential moving averages:
Moreover if we see the movement of price action with the exponential moving averages with the time period of 10 and 21. Then it can be seen that in 2012 the EMA 10 crossed down the EMA 21 before the Bitcoin halving. And after the halvening we can observe only a weak downtrend and during this weak trend the EMA 10 went very close to the EMA 21 but did not form a bear cross. After that both EMAs started moving up and then Bitcoin achieved more than 10000% profit within next one year.
On the other hand in 2016 we can see that the EMA 10 formed the bear cross with EMA 21 after the Bitcoin halving then again the exponential moving average 10 crossed up EMA 21 and Bitcoin achieved more than 3000% bit gains within next one and a half year.
Now let's move to the Bitcoin halving 2020 then it can be clearly seen that at this time EMA 10 is moving down and likely to form a bear cross with EMA 21 very soon. Even though the new candlestick has been opened below the EMA 21 but we cannot consider that the price action has broken down this EMA unless this candlestick will be completely opened and closed below exponential moving average 21. And we should wait for the death cross between two these two EMAs then we can expect a further very strong downward move before any long term bullish movement after Bitcoin halving.
The price action may follow the relative strength index trend:
In my previous post we have discussed that if the RSI is in downtrend but the price action is moving sideways or upward then finally the price action embrace the signal of relative strength index and it also moves down. At this time we can see that the RSI is in down trend even and this trend can be seen even on the daily chart, therefore the price action can start a downward move at anytime. However if the RSI will change its trend then the price action might not move down.
Up channel:
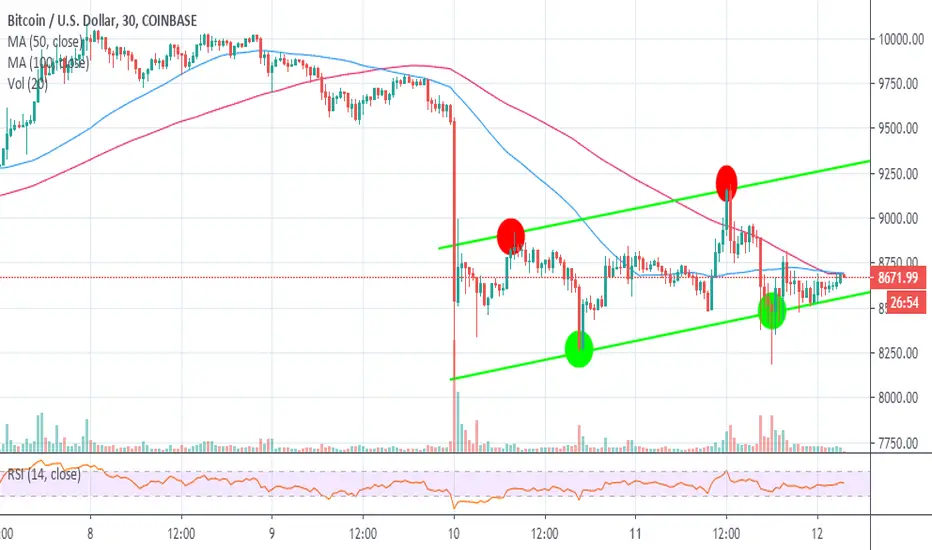
As we have already seen in my previous post that the Bitcoin has formed an up channel on the daily chart. And after hitting the resistance at $10,000 the price action drop down at the support of this channel. This time the price action is moving with the support, therefore there can be chances that the priceline will move up again from here to hit the resistance of the channel. But if the support of the channel will be broken down then the leading cryptocurrency can start a strong bearish rally.
Bullish pennant:
On the other hand on the same daily chart the price action of Bitcoin has formed a bullish pennant. At this time the price action is at the support of this pennant. And after hitting the resistance at this time BTC is at the support of this pennant and the green bullish candlesticks are appeared showing the tendency of the priceline to move up. The support of this pennant is also very critical if it will be broken down in the price action can start a strong bearish move as we have discussed in case of breaking down the channel support as well.
The formation of bullish BAT:
Now I would like to drive your attentions towards a very important move and that is the formation of bullish BAT pattern on the daily chart. At this time priceline of BTC is forming the last leg of this is BAT. And for the completion of this final leg we need the retracement between 0.786 to 0.886 Fibonacci sequence that starts from $8500 and ends up to $8300. If the price action will complete this is BAT that then there will be strong chanes that the price action can start a very strong bullish move from the potential reversal zone of this bullish BAT pattern. However the potential reversal zone of this pattern should be considered as stop loss. Because if the price action will break down this level then it can move more down for the formation of bullish Crab pattern.
Conclusion:
It is confirmed that post halving the Bitcoin starts very strong and long term bullish rally, however this is also a fact that pre or post halving period the Bitcoin also completes a bearish move as well. Therefore in case of breaking down the supports the Bitcoin can move further down, however if the supports will be saved then the Bitcoin can start long-term bullish move from here.
Note: This idea is education purpose only and not intended to be investment advice, please seek a duly licensed professional and do you own research before any investment.
Bitcoinhalving

Bitcoin | Update after the Halving – What will be the next move?We have seen a lot of volatility in the past two weeks. This was of course to be expected. In our last analysis we talked about a potential reversal/shakeout pattern, but this one didn’t complete. For now, we can see that there is a lot going on with Bitcoin that we want to discuss in this analysis.
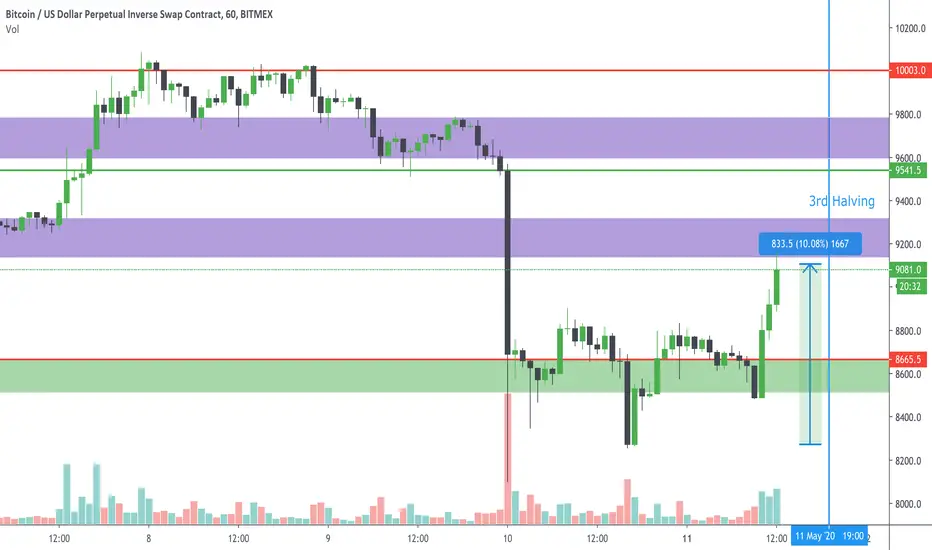
First of all, the Bitcoin CME Futures gap. Last week, CME Futures closed at a price point of 10085, opening Monday at 8820. This created a large gap with a price difference of 1265. At the time of writing this analysis, the price of Bitcoin spiked up, and filled the gap.
The gap in the CME futures has been filled, but as far as we can see now, Bitcoin is being rejected again at the 10K level. Bitcoin is creating a Lower High (LH), since it could’t break the last high of 10074. If Bitcoin cannot break the 10K level, we can see this as a clear rejection and Bitcoin can fall back on the latest support (9150 and 8850).
For now, we can see that Bitcoin is still in its rising channel. Normally these channels are bearish rather than bullish. In addition, we see that as the price of Bitcoin goes up, the volume decreases. This could also indicate that this “breakout” could be a fakeout to liquidate some long positions.
If we look at the second Bitcoin reward cut (July 9, 2016), we see that Bitcoin did fall again (29,92%) after the date (post-halving dump). If we will something familiar with the current price of Bitcoin, it would bring the price down to about the lower 6000 levels. In our opinion this would not be the case. We don’t expect Bitcoin to ever see the lower 6000 again.
A few last things to note is that Bitcoin’s price is still above 20 daily and monthly moving averages. Both are good indicators of whether Bitcoin is in an upward or downward trend. In the last Bull Run (2015-2017), the price of Bitcoin never fell below the 20 Monthly Moving Average.
We do not expect Bitcoin to break upwards out of the rising channel. Instead, we expect Bitcoin to move sideways in the coming days/weeks, after which we will break down out the channel. After an outbreak to the downside, many buy orders will be filled and the price of Bitcoin will slowly rise again. The next phase of Fomo begins..
A short overview:
We are above the 20 Daily Moving Average (currently at 8825)
We are above the 20 Weekly Moving Average (currently at 8081)
We are above the 200 Daily Moving Average (currently at 8042)
CME Futures gap filled
Volume is going down
Support levels at: 9150 and 8850
Resistance zone at 10K
Thanks for reading and let me know your expected price targets for the upcoming halving!

Bitcoin Again Going Parabolic To Hit Upto $300KHi friends hope you are well today we will see how the Bitcoin turns parabolic after every halving event. For this purpose I would like to take you back to the first halvening event of 2012. And on weekly long-term chart we can observe that after the halving event the price action went strong bullish and moved in parabolic way for next one year. This powerful bullish rally was up to 10,000% and that was really a big move. After achieving the highest price the BTC dropped down again and in June 2014 the Bitcoin showed a recovery rally. That was the time when the people would be thinking that it it will be recovered back to the highest price that was $1163 at that time. But the price action moved down again and retraced up to 0.786 Fibonacci level. After this retracement the price action formed a double bottom on the strongest support of 200 simple moving average and turned bullish again.
Parabolic move after halving event of 2016:
Now if we take a look at the halving event of 2016. Then after this event the price action againg turned parabolic bullish and produced more than 3000% gains. After achieving the highest price the leading cryptocurrency dropped down again and in the month of June 2019 the price action again showed a recovery move up to $13880. And this was the time when we were thinking that the Bitcoin has finally started recovery rally and it will be moved back up to the previous highest price level. That is the $20,000 but the price action of Bitcoin again moved down and retraced up to 0.786 Fibonacci level. This time we can see that the priceline has again formed a double bottom on the 200 simple moving average on this weekly chart like it was happened back in 2015.
Parabolic move after halving event of 2020:
Now after this double bottom formation on 200SMA the price action has gone through the 2020 halving event. Therefore we can expect another parabolic move by the priceline of BTC. If we notice the previous bullish move after the halving event of 2016 then that was 70% less profitable than the bullish move that was happened after the halving event of 2012. So if we expect the 70% less profit that was produced after the halving event of 2016 then the BTC can easily achieve $100,000 price level. However if the Bitcoin again produces 3000% profit than it can reach upto $300K.
Bitcoin is parabolic since came into existence:
Now if we take a look at the complete price action of Bitcoin since it has been came into existence. Then it can be clearly seen that the Bitcoin is moving parabolic. And it has never truned bearish, because we can see after achieving every highest price level the Bitcoin retraces between 0.382 to 0.786 Fibonacci retracement level. And the retracement upto 0.786 Fibonacci level can be called a correction move. Therefore we can say that after achieving every highest price in the history of Bitcoin the Bitcoin starts a correction for the next bullish move.
The most important factor behind this parabolic move:
On this weekly chart we can also observe that the basic reason for the parabolic bullish move of the Bitcoin is the 200 simple moving average. As this moving average is also moving in parabolic shape and not letting the price action to break down this 200SMA support. And this time again the priceline has hit at this support level and took bounce for the next bullish move and the 200 SMA is lifting up the Bitcoin price level in the parabolic way.
Conclusion:
After every halving event the BTC turns parabolic. If this happens again then Bitcoin can easily reach the $100K to $300K price level within next 2 to 3 years.
Note: This idea is education purpose only and not intended to be investment advice, please seek a duly licensed professional and do you own research before any investment.

Murky Waters Before The Halving4 hour and 6 hour charts show the weekends drop is in full recovery mode with indicators pointing up. However, the 1 day chart shows MACD now pushing down. We suggest caution trading on shorter time-frames until a rally up or down begins after the halving.

Bitcoin Price Analysis: Is Bitcoin ‘Loaded Gun’ Pointing To $10k
Bitcoin halving takes place but price action remains stable; halving effect likely to kick in at the end of the Q2.
Bitcoin price is getting ready to shoot to $10,000 after confirming the support at $8,400 and $8,200.
Bitcoin halving went smooth smoothly as expected. However, the price action remained largely unchanged with BTC stabilizing between $8,500 support and $8,700 resistance. Many people in the industry expected a rally in the price during the halving process, however, history suggests that the impact of halving is usually gradual. Therefore, investors can expect a stronger bullish momentum towards the end of the Q2 and a significant breakout towards the end of 2020 and in the course of 2021.
Following the breakdown over the weekend when Bitcoin price nosedived from levels close to $10,000 to $8,100, a recovery has been steady but gradual within a short term ascending channel. The first attempt to recovery following the drop hit a snag at $8,800 as shown on the 30-minutes graph. Rejection from this level confirmed another support at $8,200. BTC/USD launched another attack stepping above $9,000 on Monday. However, the seller congestion at $9,200 cut short the action.
Consequently, Bitcoin dived below $9,000 and this time confirmed the supports at $8,400 and $8,200 during the halving process. An ongoing recovery suggests that BTC/USD is about to launch another attack at the resistances; $9,000 and $9,200. The main target for the bulls is $10,000 but they must deal with the resistance at $9,500 and $9,800.
At the time of writing, Bitcoin is valued at $8,670 and battling resistance at the confluence formed by the 50 SMA and the 100SMA. According to the RSI, a consolidative price action is likely to take precedence before the ultimate breakout above $9,000.
Bitcoin Intraday Key Levels
Spot rate: $8,670
Relative change: 95
Percentage change: 1.16%
Trend: Sideways action (consolidation)
Volatility]: Expanding
Why The Bitcoin Dropping Fast Before The Bitcoin Halving 2020Halvening event of 2012:
Hi friends hope you're well and welcome to the new update on Bitcoin. Today we will try to understand why the Bitcoin is dropping fast just before the halvening event. In order to understand this situation we need to move back to 2012 to watch the history of the Bitcoin halving. Then we can observe that when we had the Bitcoin halvening event in November 2012 then BTC started dropping down in August 2012 this drop was started from 18th August to 20th August 2012. And this was a steep waterfall crash after that the Bitcoin recovered but just before the having the Bitcoin dropped down again in October 2012. After that we have witnessed a strong bullish rally of more than 10000% for next one and a half year.
Halvening event of 2016:
Then in halvening event of 2016 we can notice that before the halving BTC started dropping down in Jun 2016. This drop was started from 19th Jun to 23rd Jun 2012. And this was another steep waterfall crash like we had before the halving of 2012. After that the Bitcoin recovered but just before the halving the BTC dropped down again from 3rd July to 2nd Aug 2016. After that we have witnessed a strong bullish rally of more than 3000% for next one and a half year.
Halvening event of 2020:
Now in current halvening event of 2020 we can again notice that before the halving BTC started dropping down from Feb to March 2020. This drop was from 15th Feb to 13th Mar 2020. And this was another waterfall crash like we had before the halving of 2012 and 2016. After that the leading cryptocurrency recovered back. But just before the halving the BTC has started dropping down again same as like before in 2012 and 2016. After this drop we can expect a long term bullish rally.
This combination of these indicators has given final sell signals:
As in my previous posts I told you that I am looking at the movement of BTC using the combination of these indicators to observe the bullish and bearish trend .
1st: Vervorrt heikin-ashi long-term candlestick oscillator.
2nd: Moving average convergence divergence (MACD).
3rd: Stochastic indicator.
Ater placing these three indicators I came to know that since October 2019 the Bitcoin is following a specific pattern for the bearish rally. The Vervorrt heikin-ashi long-term candlestick oscillator is a powerful indicator that shows that the priceline is in bullish or bearish trend . When it turns green it means that Bitcoin is in bullish trend and when it turns red color then it means that Bitcoin is in bearish trend . Now after noticing closely the daily chart it can be observe that whenever this vervoort indicator turns green then the MACD indicator 1st gives sell signal and then again it gives buy signal and again it gives sell signal and on this third sell signal if the stochastic also gives the bear cross then the BTC turns bearish and starts the bearish move. It can be witnessed form 24th of October to 25th of November 2019. Then from 23rd of Jan up to 13th of March 2020. And if we see the current situation then the vervoort is again in green color and giving indication that we are in bullish trend , and the MACD has given a sell signal and after that we have received the buying signal and at this time the MACD has given the sell signal.
Therefore we can expect that this time the bitcoin again follow the same pattern that it is following since October 2019. And it will start a bearish rally. This time I have also placed the relative strength index (RSI) oscillator. Then we can also observe that whenever we receive the final sell signal by the MACD and the BTC starts bearish rally then the RSI also visits the oversold zone. Therefore we can expect that if the Bitcoin will start a proper bearish move then the RSI will also again visit the oversold zone.
Now up to what extent the Bitcoin can drop:
Now the question is that if the Bitcoin start a bearish move then up to what extent the BTC will be dropped. For that first of all we need to watch out for an up channel formation that the Bitcoin has formed on the daily chart. This up channel is same as like the previous up channel formation that was formed from December 2019 up Feb 2020. And after breaking down the support of previous channel the price action turned very strong bearish and easily broke down the simple moving averages supports with the time period of 50, 100 and 200. And now it has a again started another up channel from March up till now. Here we can observe after a very strong attempt to break out the resistance of the channel finally the price action is likely to be filled in breaking out and now it is dropping down to hit the support of the channel. Here we have the 100 and 200 simple moving averages supports at the same level where we have the support of the channel and these supports are at $8,000. Then we have the 50 simple moving average support just below the support of the channel. And the 50 simple moving average is moving up to form the golden cross with 100 and 200 simple moving averages. If the 50 SMA will continue this upward move to form the golden then the priceline will not break down the support of this channel, however if the 50 simple moving average will not continue its upward move and it will start moving down then the price action will easily break down the 100 in 200 SMAs and the support of the channel.
The Bitcoin has failed in re-testing the resistance block as support:
We have already seen that on the daily chart the priceline was trying to breakout the resistance block from $9,000 to $9500 level. This is the most strongest support and resistance block that the Bitcoin could not breakout since after the drop off Dec 2017. Once in the month of February 2020 we have witnessed that a Bitcoin broke out this resistance block. After breaking out this resistance block the Priceline tried to retest previous resistance as support but this re-test was unsuccessful and the priceline dropped all the way down up to $4000. Now again the priceline Now I again the priceline of leading cryptocurrency has repeated the same move. The Bitcoin broke out the resistance of this block from 8th to 9th May 2020 and after breaking out the BTC tried to retest the previous resistance as support but again it has failed to retest this resistance block as support and dropped down.
The Bitcoin is likely to be failed in breaking out the resistance of channel on long term chart:
Now I would like to divert your attentions toward the down channel that has been formed on the long-term weekly chart. And we can see here that the priceline was also trying to break out the resistance of this down channel. But so far it is not successful in breaking out the resistance. If the Bitcoin will break down the support of the channel that has been formed on the daily chart then it may retest the 100 simple moving average support that we have within the down channel on this weekly chart. And this 100 SMA support is at this time at $7,100. If the price action will breakdown the 100 simple moving every support then it may retest the 200 SMA support and that is at $5700 at this time. And in case of breaking down the 200 simple moving average the Bitcoin may re-test the support of this down channel and that is at $4,800. However I'm not expecting as that much powerful downward move. In worst situation I'm expecting that the Bitcoin will take a bullish bounce from the 200 simple moving average support as we have already discussed in my previous articles that this is the strongest support ever in the history of Bitcoin that has been never broken down since it is appeared. However the further downward move depends in breaking down the support of an up channel on daily chart.
Conclusion:
All the chart patterns and the indicators are giving bearish signals, therefore the priceline of Bitcoin may turn bearish on short-term. But on long-term after the halving event we can expect a very strong bullish rally for at least 2 years.
Note: This idea is education purpose only and not intended to be investment advice, please seek a duly licensed professional and do you own research before any investment.

Bitcoin halving ? What is the chart saying ? I am still bearish on bitcoin , even if ive had some profitable scalpings during this temporary uptrend. Last one being last week ( ethereum included here ) - but im already out.
In my previous analysis regarding bitcoin- ive said that low should be tested again if we want to rally healthy. But that never happened , instead it went up directly confirming the big daily channel im showing here.
I dont see anything bullish, 11 may fits perfectly in my picture and im very curious to see what will the price do once it hits the top of that channel. But im 90% sure it will go down afterwards. So that would be : buy the rumors- sell the news situation.
Only a huge FOMO based solely on " halving " will simply take bitcoin above that channel- but that in the market terms wont be healthy , and i wont chase such things.
If you want free access to my tel channel , pm me. Above 30% profit for this year already.

Bitcoin Halving - 39 blocks left Only 39 blocks left until 3rd Bitcoin halving in 2020. Bitcoin price is 10% up from the local bottom and currently trying to pass through $9200 resistance.
Halving ETA is 19:00 UTC, block number: 630,000
I'm still in long from ~$8300.
Hit the "LIKE" button and follow to support, thank you.
Information is just for educational purposes, never financial advice. Always do your own research.
Heavy Selling or price manipulation? 😱😱😱 Comment your Idea.From last 3 days we’re witnessing price drop. Only 2 hours left in halving.
i would suggest do not open any positions just sit back and relax. This is not good time for trading. Enjoy the show 🤭🤭

BITCOIN at 20000 USD. Possible. Let's see why.BITCOIN at 20000 USD.
Possible. Let's see why.
Current situation. After 10k we have a tracking already foreseen at 9.5k, but be careful there are still positive signs and until the price drops below 8k I don't see any reversal problems.
1. The level of trust towards btc is above average, volumes still persistent and we are always in the up trend channel. In short, the tracing was expected and should not override any fear, on the contrary, after halving it is organic to expect an increase in the price.
2. Killer Whales in action. Liquidity today is on the rise again although not yet in the system and therefore not marked in the indices. Today, approximately 1,000M USD have been issued, ready to push the Bitcoin system up.
3. Mining and Infrastructure. Hardware costs and competition among miners have increased and from the point of view of infrastructure and mining, with the halving of Fees, the increase in the value of bitcoin is an obligatory step for the survival of the network itself.
4. ASIC SHA-256. The miners used for BTC are also suitable for undermining BCH, which has already passed halving recently and which today has a profitability of about 11USD / day per single mining unit against the USD 5.4 / day which would have the same machine used for bitcoin after halving. This means that all miners with electrical operating costs above 0.04 USD / Kw would have an incentive to switch from BTC mining to that of BCH which, with the same performance of mining units, would have 48% higher yields. in fact with the halving of the Fees and calculating the operating and energy costs it would be difficult for 80% of the mining farms that operate at higher costs to continue to mine bitcoins. Factor that would decrease the performance of the entire network. - So by defending the price, you defend the industry and protect Bitcoin.
5. Global crisis and financial market. Without liquidity injections by banks and governments it is collapsing. In a landscape where traditional finance has shown all its weaknesses and sailing towards a deep recession, bitcoin and gold have shown astounding resilience. Clear sign that it configures them as unique financial instruments especially in this moment of serious crisis.
So why choose to invest in bitcoin? For us Italians, the simplest comparison to understand the moment of bitcoin is the following. In the 70s, apartments were bought, today investments are made in bitcoin and many more have already understood this.
I think, also given the sudden recovery from the afterlife after the collapse due to the COVID, that the increase in the value of bitcoin to 14k / 20k in the near future is more than likely. Obviously there will be a lot of resistance and several falls, but the signs of recovery still seem clear.
Bitcoin represents the new economic and financial freedom and must be supported and protected, because it is a gift for all of us slaves of strong powers and traditional finance, I remind you that it was donated to humanity precisely to counter the financial disaster due to the collapse triggered by sub prime mortgages in 2006 that cost billions of losses, millions of unemployed and no culprits.

Bitcoin Selling Off! And Other Irrelevant Bearish Banter.Bitcoin retraces out of the 9564 to 10,168 resistance zone, but no reason to over react. The resistance zone that has been on my charts for months is a location that favors such a move, and is why we have been reducing our risk by taking partial profits at predetermined targets (8K and 9750). The mistake to avoid here is to get confused by all the bearish hype that will follow (especially the ones who are focused on smaller time frames). The structure of the broader trend is still bullish and in this video I will explain why.
When there is a retrace within a bullish trend, what should you be doing? Looking for buying opportunities. Although Bitcoin has yet to produce a new buy signal, we view this as a chance to add back to our long from 5750 (since we now only have 1/3 of the position left) Where are the inflection points? 8500 which was a previous resistance and 7695 which is the key support for the current broader bullish structure. AS LONG AS 7695 is not compromised, Bitcoin is likely to reverse higher, and at least attempt to take out the 10,200 area high. This may take a week or so to play out, but BASED on the price structure and price action, this is the higher probability scenario.
What needs to change in order for our outlook to go back to neutral from bullish? IF price takes out 7695 and closes lower. That is the evidence required by our long only swing trade strategy to adjust our expectations. Like I remind our followers regularly, you can't go into this with any kind of opinion, especially for short term timing. The market tells us what to think, and we simply listen to it, not "experts", news, or other obsolete information. What can the next buying opportunity look like? A failed low off of the 8K area would be a very compelling scenario for us to add to our long. Overall, this move does not qualify for a trend change on the TIME FRAME we evaluate. Momentum may be bearish, but that is not the same as the trend. Keeping these variables as separate and distinct pieces of information will help you to better anticipate coming opportunities.

Bitcoin : dump coming again !!! 10500 stay out MarketHi guys.
please be careful and don't trust the news more. with my 10 years of experience. don't buy in green candle. when you see more good news at this time sell. Target of bitcoin is 10500$.
Please support us : Like and follow

This Is Why The Bitcoin Is Going To Hit $300K After HalveningHi friends hope you are well. Today I'll show you the most significant move by the Bitcoin that can lead it to hit 300K. But before that I would like to show you some developments on the small time charts because these moves are interconnected with the biggest move that I'm expecting in the next one or two years.
The bull flags on daily chart:
As in my last article we have observed that the leading cryptocurrency is aggressively forming a different bull flag on the daily char. And in previous post we were expecting the 3rd bull flag. At that time the candlesticks were being consolidated to form the next bull flag. And now we can see that the priceline has moved up and now it is confirmed that the third bull flag has been formed. Now after reaching the $10,000 level the price action may consolidate at this level to form the next bull flag or it will move a little bit more up and then consolidate.
The Bitcoin may re-test the resistance block as support:
We have already seen that on the daily chart the priceline was trying to breakout the resistance block from $9,000 to $9500 level. This is the most strongest support and resistance block that the Bitcoin could breakout since after the drop off Dec 2017. Once in the month of February 2020 we have witnessed that a Bitcoin broke out this resistance block. After breaking out this resistance block the Priceline tried to retest previous resistance as support but this re-test was unsuccessful and the priceline dropped down all the way up to $4000. Now again the priceline is breaking out this resistance level. The current candlestick is opened above this block. And once the complete candlestick will be opened and closed above this bock like the priceline did this in the month of February then the first step of the breakout will be confirmed. But the final confirmation for breakout will be received when price action of BTC will retest this previous resistance as support and after a successful retest priceline will be moved up from here.
Bitcoin is likely to be failed in breaking out the up channel resistance:
On the daily chart the priceline has formed an up channel. That was started from 13th of March 2020. And this time the price action of BTC is trying to hit hard to break out the resistance of this channel. At this time we have the 3rd candlestick that is hitting at the resistance to have a breakout. Before this we had candlestick of 30th April that was reached up to $9,485 at the resistance of the channel for the breakout. Then the price action reached at $10,000 level on 7th and 8th May 2020. And now there was a strong hope that the priceline will break out the resistance. But again the price action is likely to be consolidated at this level. Now there are two possibilities that the priceline may form a bull flag at this level and move up to break out the resistance or move down again to re-test the support of this channel that is almost at $8,500.
This combination of indicators can give us best signal for bearish move:
As in my previous post I told you that I am using the combination of three indicators to watch the bullish and bearish trend of BTC on daily chart.
1st: Vervorrt heikin-ashi long-term candlestick oscillator.
2nd: MACD custom indicator multiple time frame , this is the same MACD indicators that we use normally but this indicator shows the buying and sell signals with crosses.
3rd: Stochastic indicator.
Ater placing these three indicators I came to know that since October 2019 the Bitcoin is following a certain pattern for the correction rally or bearish move.The Vervorrt heikin-ashi long-term candlestick oscillator is a powerful indicator that shows whether the priceline is in bullish or bearish trend . When it turns green it means that we are in bullish trend and when it turns in red color then it means that we are in bearish trend . Now after observing closer the daily chart it can be seen that whenever this vervoort indicator turns green then the MACD indicator 1st gives the sell signal and then again it gives buy signal and again it gives sell signal and on this third sell signal if the stochastic also gives the bear cross then the leading cryptocurrency turns bearish and starts the bearish move. It can be witnessed form 24th of October to 25th of November 2019. Then from 23rd of Jan up to 13th of March 2020. And if we see the current situation then the vervoort is again in green color and giving indication that we are in bullish trend , and the MACD has given a sell signal and after that we have received the buying signal and at this time the MACD has turned weak bullish so its mean that it is turning bearish. Once it will give a complete sell signal with stochastic bear cross then we can expect that the BTC will again repeat the same move and start a bearish rally.
The down channel on long term:
On the long term weekly chart the Bitcoin has formed a down channel and at this time the price action of BTC is trying to breakout the resistance of this channel. Once the bearish move will be started then the Bitcoin can retest the 100 simple moving average support at $7100, or the 200 simple moving average support is at $5700. But in my opinion if the price action will be dropped from here then first it will retest the support of an up channel that has been formed on the daily chart and that support is around at $8500 once that support will be broken down then we can expect the further downward move upto 100 SMA and then 200 simple moving average on the weekly chart.
The most significant signal is going to be appeared soon that can lead the BTC price to 300K:
Now I want to show you the most significant signal that is going to be appeared after the Bitcoin halving that can lead the BTC price upto $30000. For better understanding we need to see the history of this signal so let's move back to the first Bitcoin halving event in 2012.
The Bitcoin halvening 2012:
For this purpose I have used long term weekly chart and placed the four simple moving averages with the time period of 25, 50, 100, and 200. In 2012 the 100 and 200 simple moving averages were not available therefore we will find this signal using only 25 and 50 SMAs, then we can see that just before the Bitcoin halving the 25 simple moving average form the golden cross with 50 simple moving average then after the Bitcoin halving we had the strong supports these two SMAs. Further in July 2013 the 100 simple moving average was also appeared below the 25 and 50 simple moving averages. Here we had a complete a opened alligator mouth formed by these three simple moving averages. And all these SMAs lifted the price action up very aggressively and the Bitcoin started more than 10000% bullish rally and produced ROI (return on investment) with 1 : 10K ratio within one year.
The Bitcoin halvening 2016:
Now let's move forward to the next halvening event in the year of 2016. Then we can see that just before the halvening the simple moving averages formed an opened alligator’s mouth for forming goden crosses with each other, as we can see that the 200 smple moving average was below all other simple moving averages then 100 moving average was above 200 moving average, then the 50 SMA was above the 100 SMA and the smallest moving average with the time period of 25 was above all four SMAs. And after halvening all these simple moving averages lifted the Bitcoin up very aggressively and the price line of BTC produced more than 3000% return on investment ratio within one and a half year.
The Bitcoin halvening 2020:
Now when almost three days are left in the 2020 halvening event then we can observe that almost an opened alligator mouth by these four simple moving averages is formed. Only the golden cross between 25 and 50 moving averages is due. Once the smallest moving average with the time period of 25 will cross up the 50 simple moving average then we will have the order of these moving averages like 25 simple moving average above all then we will have the 50 SMA below the 25 after that we will have the 100 simple moving average below 50 and the 200 SMA will be below all other SMAs. Then a complete opened alligator mouth will be formed and after completion of this alligator mouth we can expect a really very powerful bullish rally that can be continued for next two years. If we compare the ROI ratio that was produced in the after 2016 halvening then it is 70% less than the ROI ratio that was produced after the halvening of 2012. As we have seen that in 2012 the return on investment ratio was more than 10000%.
Now in order have an estimate the next ROI ratio we can expect 70% less ROI than the ROI after halvening of 2016. And in my point of view that will be very conservative approach. And in this way the next return on investment ratio would be e 1000%. Its mean that Bitcoin can easily hit $100,000. But it is also possible that the Bitcoin will produce up to 3000% rally as it has already produced after the previous halvening of 2016.
And it this time it will be difficult for the moving averages to form a complete opened alligator mouth before the halving event. Because one candlestick is representing one week and there are only approximately 3 days are left in the next halving event. However it doesn't matter whether this alligator mouth will be oepened before the halvening or after. Whenever it will be formed it will produce a very powerful gleefully that can be continued for atleast next two years.
Conclusion:
On the daily time period chart if the price line of BTC will not break out the up channel and we will receive strong bearish signal by the MACD indicator then there are strong chances that the price action may start a correction rally, however on the long term the Bitcoin will be remain bullish and after having event it can turn more strong bullish.

Bitcoin - macro viewWhat do you think of the options?
let's take a vote:
1 option
2 option
3 option
4 option

The market pullback again.Daily analysis-2020/05/09.2ndThe market pullback again as Bitcoin fell sharply, and BCH continued to be strong. In the 1-hour level k-line chart, the volume fell below the long-term average line and fell below the support $9700. MACD has entered below the zero axis, while the 4-hour line has shown signs of top divergence, meaning that short-term will face adjustments, pay attention to 9400 below -Line support and it is recommended to absorb dips.
ETH fell again. In the 1-hour trend, the MACD index is glued near the zero axis and a dead cross appears again. It is repeatedly suppressed by long energy. Pay attention to the 210 position and leave when it is broken.

The Days of Futures Halting Bitcoin From Passing $1 Trillion.The Days of Futures Halting Bitcoin From Passing $1 Trillion Are Seemingly Over Read Full News Here

BTCUSD - I don't know!BTC about to meet resistances.
RSI also looks as if it changed direction in the bigger picture.
RSI trendlines sometimes do work and there is a resistance at these levels.
I am expecting a spike to 11800$ in the next 72 hours to fill the GBTC gap. And from there, it's time for a correction with the Halving Hype hopefully ending.
To get a bigger correction the Daily Candles shall not close above 10158$ (trendline closes) to be able to take a short in the next days.
At the end of the day, noone knows what Bitcoin does.

BTC/USD Pre-halving Rally Hits $10k
Bitcoin price breached the $10,000 hurdle but failed to sustain gains towards $10,100.
Bitcoin halving volatility set to heighten over the weekend session; retest of $9,000 seems possible.
Bitcoin price soared to highs above $10,000 for the first time since February. The impressive surge occurred following a sustained breakout above $9,500. In just two engulfing candles, the bulls had breached the $10,000 zone. A new May high has been achieved at $10,087 but BTC/USD said goodbye to the levels above $10,000 as fast as it reached there. At the time of writing, Bitcoin is trading at $9,912 amid a building bearish trend supported by the desire by the sellers to revenge.
Bitcoin Halving Is Nigh
Bitcoin is set to undergo a mining reward halving. The event takes place every four years and sees mining rewards given to miners reduced by half. This year’s halving will take place in just three days and investors across the border want to be ready for the piece of cake following the halving as its impact is predicted to ted culminate in a price rally. The surge to $10,000 during the Asian hours on Friday can be attributed to pre-halving volatility created by increased network activity.
Bitcoin Price Technical Picture
BTC/USD technical picture turned bearish as soon as it hit highs slightly above $10,000. The RSI is also retreating from the overbought and hints to a developing bearish trend. The volume has decreased as investors wait for Bitcoin to confirm the breakout past $10,000. However, if support at $9,800 fails to hold, Bitcoin could dive lower to test $9,000. The range between $9,000 and $8,500 has a higher concentration of buyers and if tested, Bitcoin could also bounce back upwards. The major support remains at $8,400.
Bitcoin Intraday Levels
Spot rate: $9,912
Relative change: -95
Percentage change: -0.95%
Trend: Bearish
Volatility: Low

BTC/USD Mooning To $10,000 Ahead Of The Halving In The Offing
Bitcoin price spikes above $9,300 in readiness for a pre-halving rally to $10,000.
As the 50-day SMA closed the gap toward 200-day SMA, incoming bullish momentum could be massive.
After plummeting to $8,400 following the breakout that almost tested $9,500, Bitcoin bulls have kept their interest in check. The desire to stick on the market mainly fueled by the halving in four days. Intriguingly, the price has recovered to settle above $9,000. Moreover, bulls are extending the action above $9,300 towards the end of the Asian session on Thursday.
A Pre-halving rally to $10,000?
As halving draws nigh, a pre-halving rally is on the table. Investors joining the market for a post-halving rally could easily push Bitcoin price above $9,500. However, BTC/USD has the potential to top $10,000 by the end of this weekend.
Bitcoin price technical picture
Bitcoin price is teetering at $9,334 at the time of writing. Its immediate upside is supported by the short term accelerated trendline (broken line). The Relative Strength Index (RSI) has made it back into the overbought region (above 70). This move would continue to encourage more buyers to join the market as their confidence grows. A break past the key hurdle at $9,400 could also boost the price above $9,500.
On the other hand, the 50-day SMA is closing the gap between the 200-day SMA to show that bullish power is coming and could be a force to be reckoned with. On the flipside, a breakout fails and Bitcoin corrects lower, support to be embraced lies at $8,800, $8,400, the 200-day SMA at $8,000 (aided by the 61.8% Fibo) and the 50-day SMA currently at $7,245.
Bitcoin Intraday Key Levels
Spot rate: $9,334
Relative change: 177
Percentage change: 1.91%
Trend: Bullish
Volatility: Expanding

Is Bitcoin Breaking Out? Bitcoin seems to have consolidated the recent rise and appears ready to test the key resistance trendline directly above. 2 hour chart shows MACD positive, Ichimoku positive, no apparent volume resistance on the VPVR indicator, and price action rallying hard. Today may see us pop through the trendline and then come back to settle on it looking for support as we approach the halving. Exciting times. Don't FOMO. Trade the technicals.

XBTUSD: Still ranging Nothing happens to BTC - we're still ranging into Halving.
Have bids in the same place, around ~$8550. If we go north - I'll short it manually.
If you believe that we will continue to move in this range for some time, you can try to short volatility like I do.
Hit the "LIKE" button and follow to support, thank you.
Information is just for educational purposes, never financial advice. Always do your own research.

Bitcoin retests Log Support 9500. Path to $1500 BitcoinSorry I haven't posted in a while. I had many of my trades banned by tradingview and it pissed me off. This one I needed to share.
Bitcoin recently lost it's log channel trend. This was a trend that had been respected for 7 years. Losing this channel was a very bearish signal IMO. Although I am MASSIVELY BULLISH on bitcoin in the long term, I believe we are on course for a multiple year bear market which will see bitcoin bottom out somewhere between $900-$1800.
On my twitter account, I posted multiple warnings in this area and I believe we have successfully retested this broken trend. However, this is a very critical time for Bitcoin. Our path to 50-100k bitcoin in the foreseeable future lies here.
Bullish
If we can reclaim this log channel, this would be a huge shakeout from losing this log trend and reclaiming it would be massively bullish. I would want to see 2 closes in the log channel for confirmation to be bullish again.
Another lesser bullish scenario would be to continually retest this channel over the coming weeks, knocking on this resistance line, makes it primed to break into the channel again. But this scenario still leaves the possibility of a dump. It would be slightly more bullish than bearish.
Bearish
This is the scenario I am leaning towards. Retesting this log channel was textbook of losing a major trend and having a successful retest. I think $9500 will not be seen for many years to come. Now that we have lost this channel, I believe we should see either a) A sharp sell off for the next year or 2 OR b) A sideways consolidation between a range (3k-6k) before a breakdown and starting a new bull trend. I think we are more likely to see a sharper sell off into the next year or 2 and then a bottoming out, and the start of a new bull channel where bitcoin can begin it's real bull market.

Monthly Close Suggests Bull's Are Strong
April's monthly candle ended as an engulfing candle, suggesting strong upside potential for a continued rally in the month or two ahead.
Waiting to see what effect the Halving has on price action this month...
Price is 23.5% away from the ATH trendline
