Bitcoin vs Tether: Structure Breakdown Trade Plan📊 BTC/USDT "BITCOIN VS TETHER" CRYPTO MARKET PROFIT PATHWAY SETUP 💰
🎯 TRADE TYPE: Day / Swing Trade - Bearish Bias w/ Bullish Rejection Signals
💡 REAL-TIME MARKET DATA (As of January 25, 2026) ✅
Bitcoin is currently trading around $88,516.85 USD, showing consolidation after recent volatility. BTC/USDT is down approximately 0.40% in the last 24 hours, with the market experiencing what analysts describe as a critical technical squeeze pattern.
🔥 TECHNICAL SETUP BREAKDOWN 🔥
📍 CURRENT PLAN: Bearish trend confirmed with multiple bullish rejection attempts at resistance zones
🎯 ENTRY ZONE: Support level breakout @ $88,000 📉
Pro Tip: Watch for volume confirmation on breakdown before entering position
🎯 TARGET 1: $85,500 (Initial profit-taking zone)
🎯 TARGET 2: $82,000 (Extended bearish target)
🛑 STOP LOSS: $91,000 placed at recent swing high resistance
⚠️ RISK DISCLOSURE ⚠️
Dear Trading OG's & Market Warriors 🏴☠️
These are MY technical levels based on current market structure. This is NOT financial advice! You're the captain of your own ship 🚢
✅ Your money, your rules, your responsibility
✅ Adjust TP/SL according to YOUR risk tolerance
✅ Never risk more than you can afford to lose
✅ Position sizing is KEY to survival in this game
📈 CORRELATED PAIRS TO WATCH 💎
Recent correlation data shows BTC exhibiting strong alignment with major cryptocurrencies, with Solana showing near-perfect correlation at 0.99, Ethereum at 0.89, and XRP at 0.86.
Monitor these pairs for confluence:
🔹 ETH/USDT (Ethereum) - Correlation: 0.89 | Trading ~$3,100
🔹 SOL/USDT (Solana) - Correlation: 0.99 (Almost identical movement!) | ~$175-$180
🔹 XRP/USDT (Ripple) - Correlation: 0.86 | Trading ~$1.89-$2.00
🔹 DOGE/USDT (Dogecoin) - Correlation: 0.87 | Meme power tracking BTC
🔹 ADA/USDT (Cardano) - Correlation: 0.86 | Parallel movement patterns
💡 KEY INSIGHT: The unusually high correlations suggest the market is moving in unison, with broad sentiment overriding individual asset characteristics. When BTC moves, expect these pairs to follow!
📰 FUNDAMENTAL & ECONOMIC FACTORS 🌍
🔴 CRITICAL MACRO EVENTS INFLUENCING THIS TRADE:
1️⃣ Regulatory Landscape Shift 🏛️
Institutional experts highlight that regulatory clarity, particularly the potential passage of the Digital Asset Market Clarity Act, could be a key driver for Bitcoin's recovery path. The CLARITY Act aims to establish the CFTC as the primary regulator for digital commodities and end "regulation by enforcement."
2️⃣ Institutional ETF Flows 💼
Bitcoin spot ETFs accumulated over $1.9 billion in net inflows during the first week of January 2026, showing continued institutional appetite despite price weakness. However, recent patterns show a $1.2 billion inflow followed by a $243 million outflow, typical of tight consolidation phases.
3️⃣ Bollinger Bands Squeeze Alert! 📊
Bitcoin's Bollinger Bands have narrowed to less than $3,500, the tightest compression since July 2025, signaling an imminent major price move in either direction. This technical pattern historically precedes significant volatility explosions.
4️⃣ Market Sentiment Analysis 😰
Current market sentiment shows "extreme fear" conditions, which can actually be a contrarian bullish indicator. Historically, periods of extreme fear have coincided with attractive entry points for long-term investors.
5️⃣ Interest Rate Environment 📉
Potential Federal Reserve rate cuts and a more accommodating monetary policy stance toward crypto could support Bitcoin in 2026, though geopolitical uncertainties and elevated equity valuations create a complex investing environment.
6️⃣ Expert Price Forecasts 🎯
Industry analysts forecast a wide range for Bitcoin in 2026, from lows of $75,000 to highs of $225,000, with major institutions like Standard Chartered and Citi projecting targets between $143,000-$150,000.
7️⃣ Supply-Demand Dynamics ⚖️
Corporate treasuries and sovereign reserves have absorbed Bitcoin's annual production by a factor of 4.7 in 2026, creating a significant supply-demand imbalance that could support long-term price appreciation.
🎲 UPCOMING CATALYSTS TO WATCH 📅
🔸 January FOMC Meeting - Fed policy decisions impacting risk assets
🔸 U.S. Midterm Elections (2026) - Political uncertainty factor
🔸 GENIUS & CLARITY Acts - Legislative developments
🔸 AI Investment Sustainability - Tech sector correlation effects
🔸 Geopolitical Tensions - Safe-haven vs risk-off dynamics
🧠 TECHNICAL CONFLUENCE CHECKLIST ✔️
✅ Multiple bearish rejections at resistance
✅ Support level identified at $88,000
✅ Volume analysis confirming selling pressure
✅ Bollinger Bands squeeze = volatility explosion incoming
✅ RSI positioned neutrally (room to move either direction)
✅ 720-day moving average intact at $86,000 as long-term support
✅ Key resistance cluster at $94,000-$95,000 zone
💪 PROFESSIONAL TRADER MINDSET 💪
Remember:
🎯 Plan your trade, trade your plan
🎯 Risk management > Being right
🎯 Markets reward patience and discipline
🎯 One trade doesn't define your career
🎯 Protect your capital like it's your last dollar
📢 FINAL THOUGHTS 🚀
This setup offers a defined risk-reward opportunity in a market experiencing historically low volatility that typically precedes major price movements. The confluence of technical patterns, institutional flows, and regulatory developments creates an intriguing setup for both day and swing traders.
Trade smart, not emotional! 🧠💎
🔔 LIKE, BOOST & FOLLOW FOR MORE PREMIUM SETUPS! 🔔
💬 DROP YOUR THOUGHTS IN THE COMMENTS! 💬
🚀 LET'S GET THESE GAINS TOGETHER! 🚀
#Bitcoin #BTCUSDT #CryptoTrading #TechnicalAnalysis #DayTrading #SwingTrading #CryptoSignals #TradingView #BTC #Cryptocurrency #PriceAction #SupportAndResistance #TradingStrategy #RiskManagement #BearishSetup #MarketAnalysis #CryptoMarket #BTCAnalysis 📊💰🎯
Bitcoinmarket
Bitcoin Top Is In — 35 Months Symmetry, Final Bottom TargetThey won't believe me even If I told them...
I’m going to state this plainly and accept that most people will dismiss it.
Bitcoin has already printed its cycle top.
Not because of vibes, not because of fear — but because the cycle math is complete.
The Core Thesis (Simple, Replicable, Unemotional)
The previous bear market bottom → bull market top duration this cycle is 35 months
That is identical to the last cycle
When cycles rhyme this precisely, it is not coincidence — it is structure
The market has already done what it historically does.
Time is the tell. Not price.
What Comes Next (The Downtrend Phase)
From here, Bitcoin enters its true bear market descent, not a “healthy pullback.”
My expectations:
Continued downside into Q4
Final capitulation window:
October (12 months) from the top
or December (14 months) from the top
I am specifically watching October 16th–26th as the most likely window for Bitcoin’s actual bottom.
That is where fear, disbelief, and exhaustion peak — not where hope lives.
Price Targets (No Sugarcoating)
$44k–$48k is a realistic and structurally sound bottom zone
Some argue Bitcoin will not break below $66k due to:
U.S. presidential election cycle effects
perceived structural support
That outcome is possible.
But my base case remains:
A deeper flush that convinces the majority that “Bitcoin is broken again.”
That is how every real bottom forms.
What Happens After the Bottom
Once the October/December bottom is in:
Bitcoin begins a parabolic recovery
Followed by exponential growth through 2027
New all-time highs projected:
Late 2027
or Early 2028
This is not bearish long-term.
This is cycle realism.
The Hard Truth (Why This Will Be Ignored)
Even if this thesis is 80–90% correct, most people will reject it.
Not because it’s wrong — but because:
Humans distrust information that comes too cleanly
They assume there must be a gimmick
They believe “nothing in life is free”
They fear being fooled more than they desire being early
I could give tomorrow’s winning lottery numbers to millions of people —
and I doubt most would even try to run them.
They’d ask:
“How could you possibly know that?”
And then do nothing.
That is human nature.
Final Note
This post is not asking for belief.
It’s documenting a cycle call — ahead of time.
If this plays out, it won’t feel impressive in hindsight.
It will feel obvious.
That’s how markets work.
Not financial advice. Just a timestamped thesis.

Bitcoin Daily Analysis #15 – December 31, 2025🚀 Let’s dive into today’s Bitcoin analysis
📌 Here we have the final analysis of the year.
Bitcoin looks primed for a move — don’t miss it!
🎄 After the Christmas and New Year holiday period comes to an end, there’s a strong possibility that market volume will return rapidly.
📊 On the 4-hour timeframe , Bitcoin is currently trading inside a defined range (box).
Price has reacted clearly to the top, bottom, and midline of this channel.
🔍 We’ve seen:
• One fake breakout from the lower boundary
• Two rejections from the top of the range
This behavior suggests that a significant move may be approaching, especially with global markets about to reopen.
🎯 The $90,000 zone isn’t a bad trigger for a long position,
but in my view, the $86,000 level is a much stronger trigger — and could serve as a solid short opportunity if broken.
🧠 As always, we’ll stay patient and wait for real-time price action and market reaction.
Based on the conditions at that moment, we’ll execute one of these scenarios with confirmation.
📈📉 Stay sharp. Stay disciplined.
-Larry D.Kohn
This content is for informational purposes only and does not constitute financial or investment advice. © DIBAPRISM

Bitcoin Approaching $114,500 Resistance, Breakout OR Rejected?At $114,500, the price of Bitcoin is currently getting close to the Classic Resistance level. As a result, there are several situations to think about. According to the Bull Case, the price of Bitcoin may continue its short-term upward trend if it breaks out of $114,500 with strong volume support. Nonetheless, there is still a chance that the price of Bitcoin will continue to drop to at least the $112,700 region if it can sustain trade and refuses the $114,500 region.

Bitcoin Daiy SMA UPDATEThis chart uses the SMA, Simple Moving Average
Red = 50, Blue = 100, Green = 128, Yellow = 200
The weekend was calm and very low trading.
PA is ranging along the 100 SMA and sitting, waiting.
PA has the potential to move in either direction right now but the Bulls are certainly present, Keeping PA static.
Daily MACD remains Bulish with room to move higher, Histogram is Green
On the shorter term 4 hour, we can see how the 50 SMA is supporting PA while the 100 is currently the line to cross at 111582
PA has support below and is avobe the VRVP POC ( red dots )
Shorter term certainly appears more Bullish
The 4 hour MACD also shows this
The MACD came down and tested neutral line as support and the Histogram here is alo Green.
But understand, this does NOT guarantee a rise further.
The lines of Resistance abive are growing.
Currently, beginning aroun 113K
The Blue line on the Daily chart is the ultimate Goal to be crossed.
This is a LONG Term line of resistance that has rejected EVERY ATH since 2011.
It is the only line that has done this and what is important to know, this is a Calculated Arc, part of a Fibonaccj Spiral ( as explained in a previous post)
This is the Bigger picture, PA from November 2009, the year after Bitcoin Was born
As you can see, PA is being Sqqueezed and HAS to react before January 2026 or face stiff rejection below that Long Term line of support ( dashed line)
What ever happens, this IS the beginning of a New Era, Cycle of Bitcoin.
And this is why we need to pay so much attention to Bitcoin right now.
We MUST rise above that blue Arc of resistance....
And Curently, we are HERE....shown in the chart below.
This is a daily chart from November 2024
PA has been trying to get above this blue Arc since then.
And we are right under it again now,
Target price to get to and hold Above this Blue Arc is around 117K
We may wait till the FED tells us its decision on interest rates this month.

Bitcoin buy Soon as soon possibleBitcoin buy Soon as soon possible
The live Bitcoin price today is $111497.14 USD with a 24-hour trading volume of $64109128491.21 USD. We update our BTC to USD price in real-time.

LINK SHORT It seems like a lower high has now formed. Following the trend positioning into a short position makes sense here.

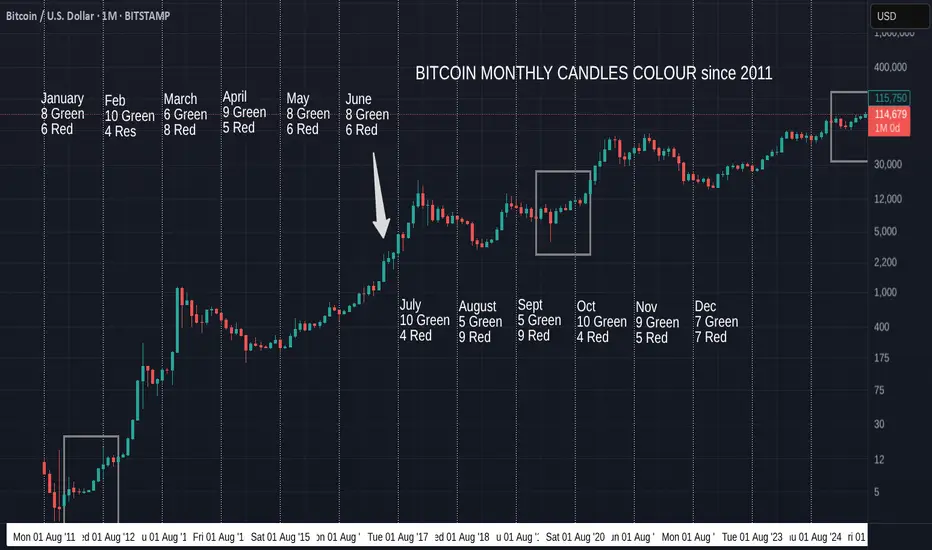
Bitcoin Monthly Candle Colour patterns and Colours since 2011
We got the expected GREEN July and so, amazingly, we continue to repeat the pattern from January to July 2012. ( Left Box )
It is almost the same pattern as 2020, apart from the Red May candle in that Year. (Right box)
The Large Arrow points towards another occasion where we had a series of consecutive Green candles from March to July, though these candles sizes are nothing like the ones we are currently experiencing.
The Boxes show us The only 2 occasions where we have had a Green December, Red January, Red February, Green March, Green April.
Then we had a Green May 2012 and a Red May 2020
Then both repeated a Green June, Green July.
The thing to note here is how all these are en-route to Cycle Highs.
So, August count currently is 5 Green to 9 Red, so the Odds are, while looking at BTC History, that we will get a RED August
HOWEVER, if we continue this run of following previous patterns, we will see a GREEN August.
In fact, 3 of those 5 Green August closes were in these 3 patterns mentioned.
Every single one of the 5 Green previous August followed a Green July, the last time was in 2021.
As mentioned in last months report, the size of the candles currently in this pattern are more like those in 2020 than the other 2 patterns talked about here.
With this in mind, we may expect a smaller Green candle close for August , Followed by a small Red candle in September. This did also happen in 2017 ( Arrow).
This August has opened Red but so far this year, many month opens were red and then changed.
So, My expectation id for a small Green August as markets cool off over the holidays and we wait for the start of Q4 in October.
We will have to wait and see as ever
Stay safe
BITCOIN Short From Resistance!
HI,Traders !
#BITCION went up sharply
Made a retest of the
Horizontal resistance level
Of 110026.5 from where we
Are already seeing a local
Bearish reaction so we
Are locally bearish biased
And we will be expecting
A local bearish correction !
Comment and subscribe to help us grow !

Bitcoin's at ALL TIME HIGHS and I'm going ALL IN!!As Bitcoin surges to new all-time highs, I've made a pivotal decision: to stop saving in dollars and start holding Bitcoin.
Why Bitcoin? Self-Custody:
Owning Bitcoin means true ownership. With self-custody, I control my private keys, ensuring my wealth isn't subject to third-party risks like bank failures or government seizures.
Declining Dollar Value: The U.S. dollar continues to depreciate due to inflation and economic policies. Holding Bitcoin, a deflationary asset, offers a hedge against this erosion of purchasing power.
Global Accessibility: Bitcoin transcends borders, providing financial inclusion for anyone with internet access, especially in regions with unstable currencies.
Security and Privacy: With proper self-custody practices, my Bitcoin holdings are secure from hacks and offer enhanced privacy compared to traditional financial systems.
As I monitor the BTC/USD daily chart, the trend is clear: Bitcoin isn't just a speculative asset; it's a movement towards financial sovereignty.

Bitcoin Weekly SetupShitty market gives shitty options.
Could be a Sweep, a fake Sweep, a similar triple top, an overextended weekly move which needs to cool down a bit.
Funding rates are slowing down/neutral.
Open Interest pretty neutral.
A word from Trump/Powell can save or kill the whole story.

FINALLY SOME SENTIMENT AFTER FED FUND RATES!! BULLISH DXY BABY!Want to see the dollar trade higher and all foreign currency Pairs to trade lower. After new release price is really starting to show us its hand making it easier for us to look for a bias.

BITCOIN HAS TO BREAK LONG TERM TREND by DEC - SQUEEZE APEX DECI have posted this before and I post it again now, just months away from a CRUCIAL point for Bitcoin PA
As with any time scale trading chart, An Apex is a point of reaction. PA usualy reacts BEFORE the Apex is met.
This Giant Apex is in DEC 2025
Every single ATH in the life span of Bitcoin has been rejected by the Arc of Resistance that is overhead.
We can also see how from the ATH in 2011, a trend line was formed that has acted as Support ever since 2012. PA has never dropped below this line.
So, as you can see, PA has been in a diminishing "Sandwich" and Now, we are coming to the Crunch
We can see how the ATH's have been a reducing % Rise ever since this point also.
And you will notice how this number on the chart reduces each time, even though the real value is increasing.
Low to ATH A ( ATH 2011) - 3,465,178%
Low to ATH B ( ATH 2013) - 49,670 %
Low to ATH C ( ATH 2017) - 9,865 %
Low to ATH D ( ATH 2021) - 2,148 %
E is not over yet but coing on current ATH we have
Low to ATH E ( ATH 2025) - 575 %
So, you see the reduction of % rise, held back all along by the ARC Of RESISTANCE
What is interesting, is that since PA has been in the chanel formed in 2011, when comapred to each other, we have been seeing a rise of 20% of the previous rise ( on average )
This closer chart shows you this in more detail
I will ignoew the A - B as thia is out of channel
C-B = 19.6 %
D-C = 21.77 %
Currently E-D = 26.7 %
As you can see, we are currently OVER that average % Rise.
And we are also heading into a tight APEX in Dec.
The expected 200K ATH this cycle will take us out of the pattern, out of the Apex and out of the 20 % average rise of previousl
This really is CRUNCH TIME for Bitcoin
The REALLY interesting thing is, What would be Next ?
This would break the Cycle routine.
We may already have broken that as described in previous charts of mine from years ago
But what IS Certain is that something HAS to happen.
This Cycle ATH will reveal a HUGE amount but we have yto Wait and see what will happen

Heikin Ashi Trade IdeaCOINBASE:BTCUSD
In this video, I’ll be sharing my analysis of BTCUSD, using my unique Heikin Ashi strategy. I’ll walk you through the reasoning behind my trade setup and highlight key areas where I’m anticipating potential opportunities.
I’m always happy to receive any feedback.
Like, share and comment! ❤️
Thank you for watching my videos! 🙏

It’s Like the Bitcoin Follows Our Predictions! 📉 In our previous post, we predicted Bitcoin would drop from 109K to 81K … And today? ✅ It bounced back from 81K to 94K , achieving a 10% gain!
🔥 Imagine if you had followed our recommendation—how much would you have profited by now?
💔 Unfortunately, those who missed our last post are now feeling the regret of a lost opportunity!
🎯 Don’t miss the next one! Follow us and turn on notifications so you never miss our upcoming predictions! 🚀
#Bitcoin #MissedOpportunity #Trading #TechnicalAnalysis #Crypto

BITCOIN WILL EXPECTED TO 125000!!!As you can see now bitcoin make 4th cycle of elliot wave, and today we're gonna wait for price hit to minor support, the minimum takeprofit will be at 98000.

$30,000 drop or $30,000 rise ?!!!This wedge can change the market outcome. If Bitcoin cannot break this wedge from above, we will see a $30k price drop. If the price breaks this wedge from above, we will see a $30k price increase. Now that most traders are disheartened by the crypto market and are selling their assets cheaply, I suspect that the price will go up.
Give me some energy !!
✨We spend hours finding potential opportunities and writing useful ideas, we would be happy if you support us.
Best regards CobraVanguard.💚
_ _ _ _ __ _ _ _ _ _ _ _ _ _ _ _ _ _ _ _ _ _ _ _ _ _ _ _ _ _ _ _
✅Thank you, and for more ideas, hit ❤️Like❤️ and 🌟Follow🌟!
⚠️Things can change...
The markets are always changing and even with all these signals, the market changes tend to be strong and fast!!

Bitcoin Falls Back to $104KThe slight surge in confidence driven by the rise of cryptocurrencies $Trump and $Melania pushed Bitcoin’s price up by more than 5% to a new high of $109K . However, the volatility caused by Trump’s inauguration day has pulled the price back to the barrier of $105K in the short term.
Short-Term Sideways Range
A consistent sideways range continues to form between the resistance at $105K and the support around the $90K zone. Recent buying oscillations have been significant in bringing the price back to the top of the lateral movement, but so far, no major breakout has occurred to invalidate the current formation.
ADX Indicator
The ADX indicator line remains below the neutral level of 20, indicating a lack of a clear trend in the current price movements on the chart. Oscillations that continue to stay below 20 could prolong the potential sideways formation in the coming sessions.
RSI Indicator
The RSI line continues to move consistently above the 50 level. However, it is now nearing the overbought zone at 70, which could pose challenges for bullish movements around the current resistance area. Readings above 70 on the RSI may signal the onset of bearish corrections on the Bitcoin chart.
Key Levels
$105K: This is the most important resistance zone at the moment. Persistent oscillations above this level could reinforce buying momentum and initiate a new phase of previous bullish trends.
$90K: The closest support zone, corresponding to the lower boundary of the current sideways range. Oscillations near this level could consolidate the current lateral movement and dampen confidence in a new sustained upward trend.
By Julian Pineda, CFA - Market Analyst

$MANTA will rebound ?OMXHEX:MANTA is coin that having huge pros & cons, while since March we see that this coin dumped so deep from $3,8 to $0,6.
Now hovering around $0,94 as i write this idea. MANTA will rebound to $1,5 at least, if market still Fear, still good.
but to reclaim $3,8 level? still we have to monitor and MANTA have to gain public trust again.
somehow, i still have to say, this crypto coin isnt that bad, good project, good prospect i think. let see MANTA at $1,5 first.

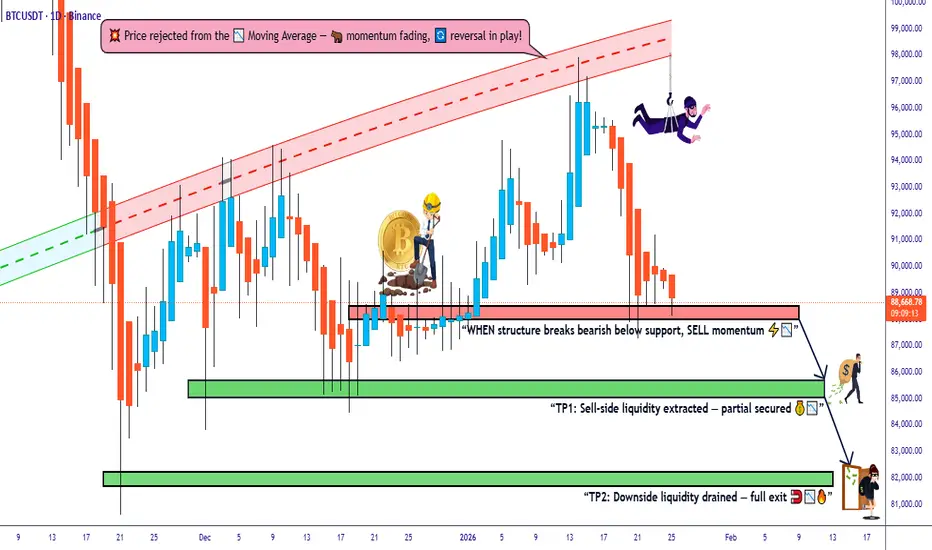
BTC/USD "Bitcoin" Crypto Market Heist Plan on Bearish Side🌟Hi! Hola! Ola! Bonjour! Hallo!🌟
Dear Money Makers & Robbers, 🤑 💰
Based on 🔥Thief Trading style technical analysis🔥, here is our master plan to heist the BTC/USD "Bitcoin" Crypto market. Please adhere to the strategy I've outlined in the chart, which emphasizes short entry. Our aim is the high-risk Green Zone. Risky level, oversold market, consolidation, trend reversal, trap at the level where traders and bullish robbers are stronger. 👀 So Be Careful, wealthy and safe trade.💪🏆🎉
Entry 📉 : You can enter a short trade at any point,
however I advise placing sell limit orders within a 15 or 30 minute timeframe. Entry from the most recent or closest high level should be in retest.
Stop Loss 🛑: Using the 4H period, the recent / nearest high level.
Goal 🎯: 90,000
Scalpers, take note : only scalp on the Short side. If you have a lot of money, you can go straight away; if not, you can join swing traders and carry out the robbery plan. Use trailing SL to safeguard your money 💰.
Warning⚠️ : Our heist strategy is incompatible with Fundamental Analysis news 📰 🗞️. We'll wreck our plan by smashing the Stop Loss 🚫🚏. Avoid entering the market right after the news release.
Take advantage of the target and get away 🎯 Swing Traders Please reserve the half amount of money and watch for the next dynamic level or order block breakout. Once it is resolved, we can go on to the next new target in our heist plan.
💖Supporting our robbery plan will enable us to effortlessly make and steal money 💰💵 Tell your friends, Colleagues and family to follow, like, and share. Boost the strength of our robbery team. Every day in this market make money with ease by using the Thief Trading Style.🏆💪🤝❤️🎉🚀
I'll see you soon with another heist plan, so stay tuned 🫂

Triangle Consolidation on Bitcoin (BTC)Hello,
Current Price: $94k.
Chart Pattern: Triangle
Trend: Consolidation/Sideways
Trade: You may try a long position if BTC stays within the triangle or breaks upwards. Breaking the triangle downward would invalidate the long position ideas and have a bearish indication.
Regards,
Ely

bitcoin hype snowballingnot everyone can be a winner in the bitcoin bull market. this miner is experiencing a clear uptrend due to higher crypto value. since noon btct has struck an equillibrium with 15 minute higher lows and lower highs. i expect this to break and into the upper $13s if above pivot, or lower $11s if below. daily i expect this stock to turn around back to bear again, even if it maintains the weekly uptrend. im looking at shorting this to $5.39 if we dont breakout on the 4hr chart. stock ahould set a weekly higher low in continuation even if bearish daily.

Bitcoin’s Path to New Highs: Targeting the $88,542 - $90,715 RanHello Folks
As Bitcoin continues its bullish momentum, the price action suggests a breakout from key resistance levels, pushing BTC towards new potential highs. The chart indicates a strong uptrend with Bitcoin breaking past significant zones, confirming the strength of buyer interest.
Based on my analysis, the next target for Bitcoin lies in the range of $88,542 to $90,715. This target range is defined by the technical breakout and current trajectory, showing potential for further upward movement. However, as always, traders should remain vigilant for any signs of reversal or correction along the way.
This level will serve as a critical area to watch, where a break above $90,000 could pave the way for Bitcoin to test even higher resistance zones, while consolidation or rejection might prompt a pullback, giving traders an opportunity to reassess entries and exits.
Keep an eye on the price action as we approach this target range—Bitcoin’s journey towards $90,000 is one to watch closely!
Once we reach 90k A new update will be shared
