LINKUSDT Inverse Head and ShouldersLINKUSDT Technical analysis update
LINK price has been forming a head and shoulders pattern over the past 30 days. Now, the price is moving towards the neckline with high volume for a breakout. If the breakout is confirmed, we can expect a strong move in LINK.
Buy Level: Above $14.70
Stop Loss: 1

Chainlink (LINK): Possible Head & Shoulder Pattern!Chainlink caught our attention in the daily timeframe, with a possible good drop to happen soon.
As you can see, we are seeing a nice H&S pattern where the price once broke the neckline zone and now went for a re-test of the EMAs and the broken zone.
From here on, we are looking for a nice reje

[LINKUSDT] - potential targets in HTF10 million link pieces were purchased in the past two weeks alone, worth $120 million Great buying power in a short period of time makes the currency's TARGETS
great in the long term
on weekly chart there is a consolidaion of falling wedge pattern after a longtime
accumulation (526 days)
key leve

LINKUSDT- more downside ahead
- targetting monthly range low
- look for bounce after monthly range low sweep in fvg

Link Big volume/Candle Incoming In my opinion, the current outlook for Link is very bullish. I anticipate further upward movement, considering that liquidity has already been taken from short traders.

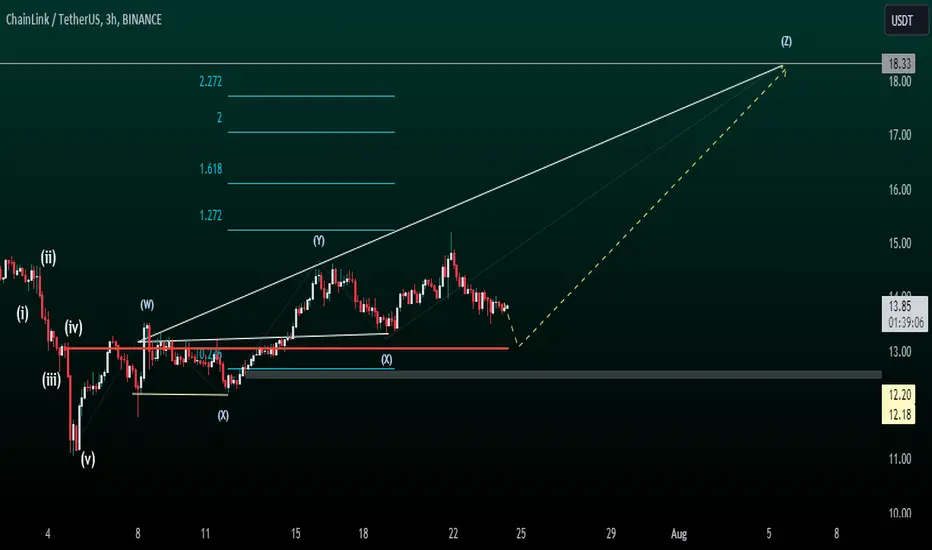
Chainlink Bullish ProjectionHello there,
Chainlink shows a potential bullish projection to 18.33, provided that 12.68 remains intact. The alphabetical sequence follows W → XYZ, with four potential bullish targets.
Note: The price could pulse down before turning up, as a piece to note. So, close monitoring will be required.
Buy LINK
LINK is at its support since November 2023.
As a result, I opened a Long with set-up as seen in chart.
Disclaimer:
This analysis is based on my personnal views and is not a financial advice. Risk is under your control.

Trade Setup: LINK Long Spot PositionMarket Context:
LINK has retraced down to the next area of support, providing a potential entry point for a long spot trade.
Trade Parameters:
Entry: Ladder into a long spot trade in the $13.00 - $13.50 area of support.
Take Profit:
First target: $14.50 - $15.30
Second target: $16.25 - $17.00
Stop

LINK Facing Crucial Resistance (Again)After initiating a promising uptrend at the beginning of July, Chainlink (LINK) is once again facing its crucial resistance at $13.
Already at the beginning of July, LINK dipped below this level after having traded above since November 2023 (except for a short dip in Jan).
Based on the chart, this

Chainlink Targets $25After a long accumulation phase, we are again backtesting the last major support where we saw previous buyers step in.
There's a higher probability we increase in price from here and target the 0.618 & weekly level above. A sweep of the lows before a move up is also possible.
Calculate Your Ris

See all ideas
Frequently Asked Questions
The current price of ChainLink / TetherUS (LINK) is 13.58 USDT — it has risen 0.44% in the past 24 hours. Try placing this info into the context by checking out what coins are also gaining and losing at the moment and seeing LINK price chart.
ChainLink / TetherUS price has fallen by 3.52% over the last week, its month performance shows a 2.42% decrease, and as for the last year, ChainLink / TetherUS has increased by 70.03%. See more dynamics on LINK price chart.
Keep track of coins' changes with our Crypto heatmap.
Keep track of coins' changes with our Crypto heatmap.
ChainLink / TetherUS (LINK) reached its highest price on May 10, 2021 — it amounted to 53.00 USDT. Find more insights on the LINK price chart.
See the list of crypto gainers and choose what best fits your strategy.
See the list of crypto gainers and choose what best fits your strategy.
ChainLink / TetherUS (LINK) reached the lowest price of 0.35 USDT on Jan 28, 2019. View more ChainLink / TetherUS dynamics on the price chart.
See the list of crypto losers to find unexpected opportunities.
See the list of crypto losers to find unexpected opportunities.
The safest choice when buying LINK is to go to a well-known crypto exchange. Some of the popular names are Binance, Coinbase, Kraken. But you'll have to find a reliable broker and create an account first. You can trade LINK right from TradingView charts — just choose a broker and connect to your account.
Crypto markets are famous for their volatility, so one should study all the available stats before adding crypto assets to their portfolio. Very often it's technical analysis that comes in handy. We prepared technical ratings for ChainLink / TetherUS (LINK): today its technical analysis shows the sell signal, and according to the 1 week rating LINK shows the sell signal. And you'd better dig deeper and study 1 month rating too — it's neutral. Find inspiration in ChainLink / TetherUS trading ideas and keep track of what's moving crypto markets with our crypto news feed.
ChainLink / TetherUS (LINK) is just as reliable as any other crypto asset — this corner of the world market is highly volatile. Today, for instance, ChainLink / TetherUS is estimated as 0.59% volatile. The only thing it means is that you must prepare and examine all available information before making a decision. And if you're not sure about ChainLink / TetherUS, you can find more inspiration in our curated watchlists.
You can discuss ChainLink / TetherUS (LINK) with other users in our public chats, Minds or in the comments to Ideas.