BITCOIN: One Last Drop And Then On The Way $200,000Dear Traders,
In our previous analysis, we predicted a price drop from 100k to 60k through multiple analyses. This prediction has come true as the price is currently plummeting sharply. We believe the price will likely fall between 63k and 58k, which would be ideal for swing buyers and a potential high volume zone.
We anticipate a final drop before the price reverses and potentially reaches a record high. Our initial targets are $100k, $150k and ultimately $200k. This is likely to be a significant reversal.
Please like and comment for more updates. Also, follow us for the latest news.
Team Setupsfx_
Bitcoinmarkets

BITCOIN - time to buy BTCUSDBITCOIN (BTC/USD) has recently dropped in price but struggled to break through a major support level which is currently holding the price. A few weeks ago the price also broke a strong resistance level (the white trend line shown on the chart) - The price is currently bouncing off the major support zone and likely to go back to the upside and hit the take profit level (drawn on the chart). Buy BTCUSD now!

BITCOIN | DANCING ON THE EDGE OF FAILURE Traders,
First of all, happy new year. I hope everyone had a great holiday season. Going into the new year, I think there is a real chance that Bitcoin is setting up for a meaningful dump. To understand why, we need to look beyond price and ask the real question: who is actually driving this move?
Market context
Since January 1st, Bitcoin has been grinding higher again. Not through impulsive expansion, but through a slow, overlapping auction into the highs. This type of price action often appears near transitions rather than continuation.
Participation and flow
Looking under the hood, participation tells an important story:
Aggregated CVD across major venues continues to make higher highs, showing persistent aggressive buying
Price, however, is not expanding with that aggression and is starting to stall
Spot participation is present, but remains reactive rather than initiatory
Derivatives are clearly the dominant driver of this move, meaning aggressive buying is getting absorbed
On top of that, we now have a hidden bearish divergence on aggregated flow. Price is printing a lower high into resistance, while aggregated CVD, especially stablecoin margined futures, continues to push higher. More aggression with less progress is typical behavior during absorption and distribution.
Structural confluence at the highs
Structurally, price is trading at a major confluence area. The current high aligns with the 1.618 Fibonacci extension of the prior impulse leg, measured from the swing low into the retracement that pulled back into the golden pocket between 0.618 and 0.65. From a mathematical perspective, this is a classic harmonic sequence where reactions are statistically common.
Price failed to accept above this level. Instead, we printed a clear SFP and liquidity sweep, briefly trading above prior highs to trigger stops before rotating back below. This suggests upside liquidity was collected rather than defended.
Higher timeframe structure and weak lows
Zooming out to the higher timeframe adds another important layer. On the daily chart, multiple weak lows stand out.
The April 7 low is weak. It is defined by multiple wicks into the same area, shows no meaningful excess, and sits just above an unfilled FVG. From an auction perspective, this is unfinished business.
In addition, there is another weak low above, formed in similar fashion with repeated tests and no clean excess. This reinforces the idea that downside structure has not been properly resolved yet.
Weak lows rarely hold indefinitely. Once distribution higher up is complete, the market tends to revisit and sweep these levels to finish the auction.
Levels and expectations
Downside expectations:
Sweep of the more recent weak lows
Continuation toward the April 7 weak low
Expansion into the lower liquidity pocket
Final downside target around 64k
Upside levels to watch:
The first overhead supply zone marked by the lower grey box (around 98k)
The higher resistance zone marked by the upper grey box (between 103-105k)
Any move into these areas without acceptance would further support a distributional environment
Conclusion
In summary, we have leverage driven upside, aggressive buying being absorbed, a hidden bearish divergence, a failed acceptance at a 1.618 extension, a confirmed liquidity sweep at the highs, and multiple weak lows below price. Until price can reclaim and hold above the current resistance area, the path of least resistance remains downward.
Remember: markets do not move because of opinions. They move to finish auctions and punish those who mistake activity for progress.
---------
If you find value in viewing the market through the lens of auctions, structure, and participation, feel free to leave a like or a comment. It helps more than you might think.
From the sands before the storm,
- ThetaNomad

Bitcoin Weekly MACD repeating the pre 2023 Push ?
I will just leave this here and let you look and form your own ideas.
For me, this is totaly possible,,,,,,,,,,,,,,,,,,we just waiting for the Daily MACD to Hit LOW and turn
All to play for here......
If GOLD continues to reset, the money HAS to go somewhere....and the option is surely BITCOIN....Over Sold. everywhere- Except on the Daily..........
Just waiting.....

Breaking: Bitcoin Dips to $70K Zone The price of the notable asset - Bitcoin ( CRYPTOCAP:BTC ) Dips to $70K Zone amidst market turmoil. The asset has broken the base of a bearish symmetrical triangle further hinting on more selling pressure in the short to long term.
Notable assets like CRYPTOCAP:ETH , CRYPTOCAP:SOL and CRYPTOCAP:XRP all experience their own fair share of the market volatility.
A major reason the sell-off became so aggressive was leverage. Many traders were using borrowed funds in Bitcoin and altcoin derivatives. When prices dropped quickly, those positions were forced to close.
These liquidations created a chain reaction. Each forced sell pushed prices lower, triggering more liquidations. This is common during sharp crypto pullbacks, especially when markets are thin and traders are over-positioned.
Traders will be watching whether Bitcoin can stay above recent support levels. If it holds, the market may slowly recover. If it breaks lower again, another wave of selling could follow.
For now, the market looks shaken but not broken. The weekend sell-off was sharp, but Bitcoin’s ability to stabilize suggests this may be a reset, not the start of a deeper collapse.

BITCOIN IS BULLISH!!!!! (but watch out for this) Yello Paradisers! Enjoy the video!
And Paradisers! Keep in mind to trade only with a proper professional trading strategy. Wait for confirmations. Play with tactics. This is the only way you can be long-term profitable.
Remember, don’t trade without confirmations. Wait for them before creating a trade. Be disciplined, patient, and emotionally controlled. Only trade the highest probability setups with the greatest risk to reward ratio. This will ensure that you become a long-term profitable professional trader.
Don't be a gambler. Don't try to get rich quick. Make sure that your trading is professionally based on proper strategies and trade tactics.

btc continued sell side pressure with long targetsSee chart for specific reference w/ buy zones corresponding to likely areas of support fib regions notated

5-Day Gaussian Channel Showing Likely 50% - 60% Bear DeclineAnd this chart of the 5-day gaussian Channel we can see that in Prior Cycles once price action has dropped below the lower edge of the gaussian channel and it's turned red typically it then drops 50 to 60% before recovering and putting in the bottom.
This also happened in the 2014 cycle from October 2014 to October 2015 when the recovery was complete, and after going down 60% also.
We can see either there's consolidation above the lower band of the Gaussian channel before the major breakdown, or it appears to be acting as resistance this cycle.
Either way, the Gaussian channel (5-Day) has flipped red and is rolling over indicating a deeper pullback for Bitcoin from here.
Typically there are counter Trend rallies so I am also looking for $74k to provide temporary support at the prior High of last cycle and the Breakout Zone from November of 2024.
And in my prior study here on the monthly chart, we can see that a head and shoulders breakdown measured move could take Bitcoin to 62k. Those are certainly possible.
Anything can happen here, but with the government shutdown, the failure to pass the Clarity Act, raising tensions in Iran, and economic worries, we could see a rapid unwinding of the Bitcoin price and potentially taking us down to the 38,000 level by July according to this chart.
Typically the midpoint of the box that I've drawn and price Cycles is where the bottom is in, and it takes just as long for the Gaussian channel to turn from Red back to green.
With so many factors that play, it's impossible to know which way this goes.
I am also starting to play around with options on crypto, which are available on the CME now and through TradingView's brokerage partners. Currently BTC, ETH, and XRP.
So we'll be looking to put on put spreads or even naked puts on these countertrend rallies in the greater scheme of things. I still think we could hit new all-time highs by the end of this year.
Let me know what you think, and if I've missed anything.
Cheers,
Brett

Bitcoin - Creating another -30% correction!🤬Bitcoin ( CRYPTO:BTCUSD ) is still in a bearish market:
🔎Analysis summary:
Just a couple of months ago, Bitcoin created its expected bullmarket all time high. Since then, we already witnessed a correction of about -30%. But looking at higher timeframe structure, this correction is not over and we might see a final push of -30% lower soon.
📝Levels to watch:
$60,000
SwingTraderPhil
SwingTrading.Simplified. | Investing.Simplified. | #LONGTERMVISION

Bitcoin Loves Bulls Right Now… Until This HappensYello Paradisers! Enjoy the video!
And Paradisers! Keep in mind to trade only with a proper professional trading strategy. Wait for confirmations. Play with tactics. This is the only way you can be long-term profitable.
Remember, don’t trade without confirmations. Wait for them before creating a trade. Be disciplined, patient, and emotionally controlled. Only trade the highest probability setups with the greatest risk to reward ratio. This will ensure that you become a long-term profitable professional trader.
Don't be a gambler. Don't try to get rich quick. Make sure that your trading is professionally based on proper strategies and trade tactics.

All the Rate Changes and their effect on BITCOIN Price
Make of it as you will but do note, there are occasions where Rate ROSE and so Did Bitcoin PA
There are occasions were Rate Dropped and Bitcoin Did not. or it Did.
Conclusion....
Bitcoin Will do what it will anyway

Bitcoin - This chart is not bullish yet!🎲Bitcoin ( CRYPTO:BTCUSD ) still remains beairsh:
🔎Analysis summary:
Bitcoin remains in an underlying bullish market. But looking at all the recent retests of resistance, it becomes quite likely that this is not the end of the bearmarket yet. Bitcoin will most likely create another move of -35% first in the next couple of weeks.
📝Levels to watch:
$65,000
SwingTraderPhil
SwingTrading.Simplified. | Investing.Simplified. | #LONGTERMVISION

Analytics: market outlook and forecasts
📈 WHAT HAPPENED?
Last week, the trading direction was clearly bearish.
Since Monday, sellers have taken the lead, driving the price through key support levels without significant resistance from buyers. It wasn't until Wednesday evening that the first signs of resistance appeared, although we expected only a local correctional rise.
As a result, Bitcoin tested the local resistance zone at $91,000-$91,700, after which the decline resumed.
💼 WHAT WILL HAPPEN: OR NOT?
The situation has become more difficult to assess and may lead to a reversal of the trend.
During the test of the local minimum, there were volume anomalies and significant buyer activity on the delta. If the price remains above the $88,000-$87,200 zone, it may indicate a return of buyer strength. In this case, the potential for movement will be directed towards the resistance zone of $92,600-$93,500 (volume anomalies).
If the price falls below this zone, the recovery may be uncertain. Despite the presence of strong supports, a full-fledged reversal may require stronger protection and additional time.
Buy Zones
$86,000–$84,800 (anomalous activity)
$84,000–$82,000 (strong volume anomalies)
Sell Zones
$92,600–$93,500 (volume anomalies)
$96,000–$97,500 (selling pressure)
$101,000–$104,000 (accumulated volumes)
📰 IMPORTANT DATES
Macroeconomic events this week:
• January 27, Tuesday, 13:30 (UTC) — speech by US President Donald Trump;
• January 27, Tuesday, 15:00 (UTC) — publication of the US Consumer Confidence Index for January;
• January 28, Wednesday, 13:30 (UTC) — speech by US President Donald Trump;
• January 28, Wednesday, 14:45 (UTC) — announcement of the Canadian interest rate decision;
• January 28, Wednesday, 19:00 (UTC) — announcement of the US Federal Reserve interest rate decision, as well as the US FOMC statement;
• January 28, Wednesday, 19:30 (UTC) — press conference by the US FOMC;
• January 29, Thursday, 13:30 (UTC) — publication of the number of initial jobless claims in the US;
• January 30, Friday, 9:00 (UTC) — publication of Germany's GDP for the fourth quarter of 2025;
• January 30, Friday, 13:00 (UTC) — publication of the German Consumer Price Index for January;
• January 30, Friday, 13:30 (UTC) — publication of the US Producer Price Index for December;
• January 31, Saturday, 1:30 (UTC) — publication of the Chinese Manufacturing Purchasing Managers Index for January.
*This post is not financial recommendation. Make decisions based on your own experience.
#analytics

GOLD, DXY and BITCOIN on the same month chart- who wins ?
GOLD is shown as the solid YELLOW line
DXY USD is the GREEN Bars
BITCOIN, the Orange Bars
The chart says it all
GOLD Could be the winner, it holds Value better than any......and that Hurts me, as a Bitcoin MAXI, However, the gains with Bitcoin Versus Gold, on Bull Runs, is unbeatable, 254% over Gold in the recent Bull run. .....But Bitcoin has a habit of - 80% Losses.
GOLD does not do that
The DXY however, lost value to Gold as soon as it walked away from the "Gold standard" in 1971.
And it continues to do so. That GOLD PA is GOLD USD.....see how Far Gold has gone Above the $ !
The ONLY thing that has given Gold a "Run for its Money" is BITCOIN.
Lets look closer.
Bitcoin was below Golds value for the first 8 years of its existence.
Then suddenly, in 2017. Boom, Bitcoin potential showed itself and Rose above Gold for a short while.
Gold and Bitcoin Value then Yo yo'd for nearly 4 years and then in late 2020. Bitcoin took off and has been Above Golds Value ever since.
And with the recent surge in Gold price, "The Catch Up" I call it, We now See GOLD and BITCOIN on a head to Head for Value.
The Last time these two were so close was at the Bottom of the Bitcoin bear market in 2022.
Could this be a sign that the Bitcoin Bear market is over ?
Could be.
So, whats Next ?
GOLD is VERY Over Bought
BITCOIN is OVER SOLD
DXY is in Deep trouble ( as pointed out in a post earlier this morning )
CONCLUSION
GOLD has cought up with the New Kid on the block, has shown incredible strength and looses less value on pull backs. A truly international Asset.
BITCOIN has bigger gains in bull runs and Larger Losses in Bear markets......Usualy.......If we are currently at the Bottom of a Bitcoin Bear market, as some suggest, this pull back has been 30% SMALLER> Bitcoin retains more value gut we need confirmation of this........BITCOIN has yet to be adopted by other countries around the world as much as it seems to have been in the USA.
DXY sailing into headwinds and with no real Magical solution to regaining the Value it has lost compared to other assets.
The WINNER ?
It is either Gold or Bitcoin, depending on your trading strategy.
But the next few months will certainly make this easier to see...
Should GOLD overtake Bitcoin for the first time since 2020, then that will show a WEAKNESS in Bitcoin.
I cannot wait to see what happens>>>>>>>>>>>>>>>>>>>>>>>>>>>
I BUY BOTH

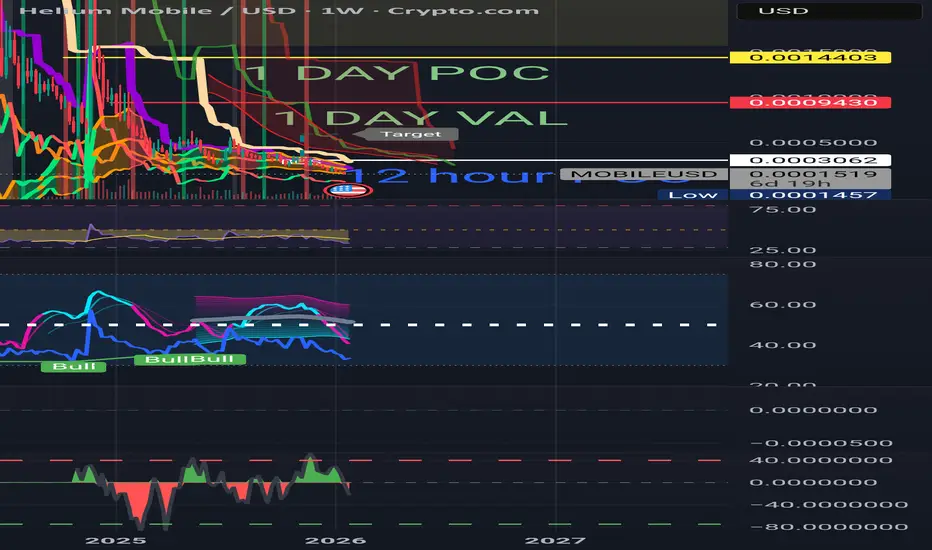
Mobile is ready againBad news & then no news for a while.....
Volume profiles on multiple time frames show some fire is coming IMO...
I lean towards the "revolution of crypto"... Look for 10 cents???
O yeah, they also did a delist and made many panic sell before & after that. Reminds me of buying a F ton of XRP below. I made money of the pump before the coinbase delisting also.
Something has me seeing massive potential beyond most our expectations or it's just another shit coin.
Good luck & REMEMBER NOTHIMGNG I SAY IS FINANCIAL ADVICE
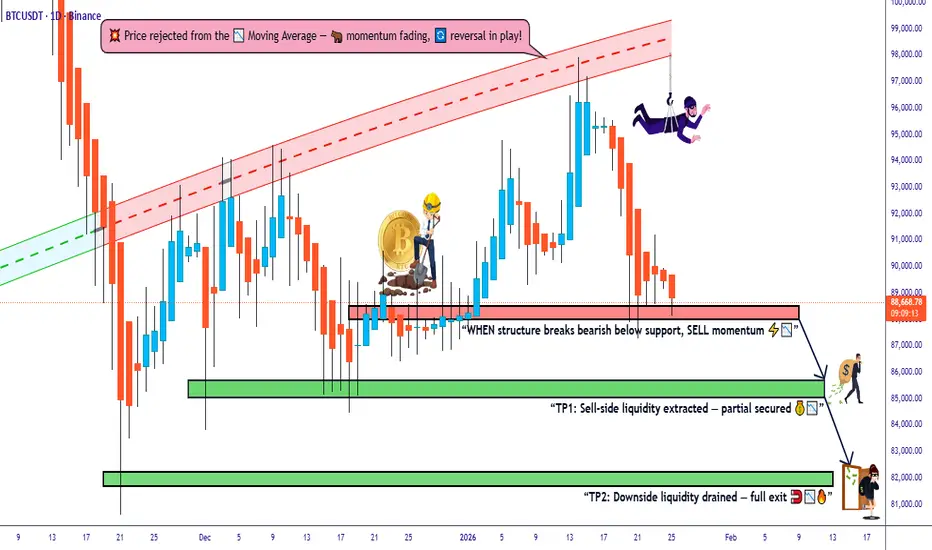
Bitcoin vs Tether: Structure Breakdown Trade Plan📊 BTC/USDT "BITCOIN VS TETHER" CRYPTO MARKET PROFIT PATHWAY SETUP 💰
🎯 TRADE TYPE: Day / Swing Trade - Bearish Bias w/ Bullish Rejection Signals
💡 REAL-TIME MARKET DATA (As of January 25, 2026) ✅
Bitcoin is currently trading around $88,516.85 USD, showing consolidation after recent volatility. BTC/USDT is down approximately 0.40% in the last 24 hours, with the market experiencing what analysts describe as a critical technical squeeze pattern.
🔥 TECHNICAL SETUP BREAKDOWN 🔥
📍 CURRENT PLAN: Bearish trend confirmed with multiple bullish rejection attempts at resistance zones
🎯 ENTRY ZONE: Support level breakout @ $88,000 📉
Pro Tip: Watch for volume confirmation on breakdown before entering position
🎯 TARGET 1: $85,500 (Initial profit-taking zone)
🎯 TARGET 2: $82,000 (Extended bearish target)
🛑 STOP LOSS: $91,000 placed at recent swing high resistance
⚠️ RISK DISCLOSURE ⚠️
Dear Trading OG's & Market Warriors 🏴☠️
These are MY technical levels based on current market structure. This is NOT financial advice! You're the captain of your own ship 🚢
✅ Your money, your rules, your responsibility
✅ Adjust TP/SL according to YOUR risk tolerance
✅ Never risk more than you can afford to lose
✅ Position sizing is KEY to survival in this game
📈 CORRELATED PAIRS TO WATCH 💎
Recent correlation data shows BTC exhibiting strong alignment with major cryptocurrencies, with Solana showing near-perfect correlation at 0.99, Ethereum at 0.89, and XRP at 0.86.
Monitor these pairs for confluence:
🔹 ETH/USDT (Ethereum) - Correlation: 0.89 | Trading ~$3,100
🔹 SOL/USDT (Solana) - Correlation: 0.99 (Almost identical movement!) | ~$175-$180
🔹 XRP/USDT (Ripple) - Correlation: 0.86 | Trading ~$1.89-$2.00
🔹 DOGE/USDT (Dogecoin) - Correlation: 0.87 | Meme power tracking BTC
🔹 ADA/USDT (Cardano) - Correlation: 0.86 | Parallel movement patterns
💡 KEY INSIGHT: The unusually high correlations suggest the market is moving in unison, with broad sentiment overriding individual asset characteristics. When BTC moves, expect these pairs to follow!
📰 FUNDAMENTAL & ECONOMIC FACTORS 🌍
🔴 CRITICAL MACRO EVENTS INFLUENCING THIS TRADE:
1️⃣ Regulatory Landscape Shift 🏛️
Institutional experts highlight that regulatory clarity, particularly the potential passage of the Digital Asset Market Clarity Act, could be a key driver for Bitcoin's recovery path. The CLARITY Act aims to establish the CFTC as the primary regulator for digital commodities and end "regulation by enforcement."
2️⃣ Institutional ETF Flows 💼
Bitcoin spot ETFs accumulated over $1.9 billion in net inflows during the first week of January 2026, showing continued institutional appetite despite price weakness. However, recent patterns show a $1.2 billion inflow followed by a $243 million outflow, typical of tight consolidation phases.
3️⃣ Bollinger Bands Squeeze Alert! 📊
Bitcoin's Bollinger Bands have narrowed to less than $3,500, the tightest compression since July 2025, signaling an imminent major price move in either direction. This technical pattern historically precedes significant volatility explosions.
4️⃣ Market Sentiment Analysis 😰
Current market sentiment shows "extreme fear" conditions, which can actually be a contrarian bullish indicator. Historically, periods of extreme fear have coincided with attractive entry points for long-term investors.
5️⃣ Interest Rate Environment 📉
Potential Federal Reserve rate cuts and a more accommodating monetary policy stance toward crypto could support Bitcoin in 2026, though geopolitical uncertainties and elevated equity valuations create a complex investing environment.
6️⃣ Expert Price Forecasts 🎯
Industry analysts forecast a wide range for Bitcoin in 2026, from lows of $75,000 to highs of $225,000, with major institutions like Standard Chartered and Citi projecting targets between $143,000-$150,000.
7️⃣ Supply-Demand Dynamics ⚖️
Corporate treasuries and sovereign reserves have absorbed Bitcoin's annual production by a factor of 4.7 in 2026, creating a significant supply-demand imbalance that could support long-term price appreciation.
🎲 UPCOMING CATALYSTS TO WATCH 📅
🔸 January FOMC Meeting - Fed policy decisions impacting risk assets
🔸 U.S. Midterm Elections (2026) - Political uncertainty factor
🔸 GENIUS & CLARITY Acts - Legislative developments
🔸 AI Investment Sustainability - Tech sector correlation effects
🔸 Geopolitical Tensions - Safe-haven vs risk-off dynamics
🧠 TECHNICAL CONFLUENCE CHECKLIST ✔️
✅ Multiple bearish rejections at resistance
✅ Support level identified at $88,000
✅ Volume analysis confirming selling pressure
✅ Bollinger Bands squeeze = volatility explosion incoming
✅ RSI positioned neutrally (room to move either direction)
✅ 720-day moving average intact at $86,000 as long-term support
✅ Key resistance cluster at $94,000-$95,000 zone
💪 PROFESSIONAL TRADER MINDSET 💪
Remember:
🎯 Plan your trade, trade your plan
🎯 Risk management > Being right
🎯 Markets reward patience and discipline
🎯 One trade doesn't define your career
🎯 Protect your capital like it's your last dollar
📢 FINAL THOUGHTS 🚀
This setup offers a defined risk-reward opportunity in a market experiencing historically low volatility that typically precedes major price movements. The confluence of technical patterns, institutional flows, and regulatory developments creates an intriguing setup for both day and swing traders.
Trade smart, not emotional! 🧠💎
🔔 LIKE, BOOST & FOLLOW FOR MORE PREMIUM SETUPS! 🔔
💬 DROP YOUR THOUGHTS IN THE COMMENTS! 💬
🚀 LET'S GET THESE GAINS TOGETHER! 🚀
#Bitcoin #BTCUSDT #CryptoTrading #TechnicalAnalysis #DayTrading #SwingTrading #CryptoSignals #TradingView #BTC #Cryptocurrency #PriceAction #SupportAndResistance #TradingStrategy #RiskManagement #BearishSetup #MarketAnalysis #CryptoMarket #BTCAnalysis 📊💰🎯
BTCUSD coming week price analysisThe bit coin is collapsing very strongly and I am looking for a buy from 86000 if holds and sell if it retraces 86000.

Bitcoin ina squeeze and heading to an Apex on FED day, 28 Jan
Easy to see how Bitcoin PA is once again in a Squeeze and even if it moves a bit Higher, there are a number of areas of similar resistance, all of which come to an Apex on FED Day, 28 Jan, when the Fed gives its decision on Rates.
The expectation is that Rates will remain unchanged and we will have to wait and see what reaction we see.
The Dashed lines are Local lines of resistance / Support. We have the Horizontal 4.618 Fib extension that has been the Hurdle to cross for a while now...and we have the descenfing Fib Circle that has yet to be seen is ot will offer Resistance or not.
The easiest place for PA to cross these lines is at the intersection. around 27 / 28 Jan,...But we know that PA usualy reacts before the APEX>...
SO, We may see a move in the next few days, even maybe today....
But where will PA go ?
There are cases for both directions.
The 4 hour MACD
MACD still rising from Oversold and has plenty of room to move higher.
The Histogram has White bars and so we see a weakening of the Rise but it appears to be leveling out....as PA keeps position ....
The Longer Term Daily MACD
This is the one to watch really. MACS is still Falling But Note the White Histogram Bar.. aWeakening of the Bullish trend maybe starting.
MACD below Neutral now and so, with the 4 hour rising, we see the continued Range of PA.
Omce that Daily get Over sold enough, we will see it rise as the weekly is down in oversold also, in a psition where we usualy see Moves higher.
Weekly MACD
So, while many are beginning to question Bitcoin as we see GOLD shoot to the stars, Bitcoin is SO VERY CLOSE to being ready to move higher.
We may yet see a drop should this local obsticle beat the Bulls but if that happens, the Daily MACD would drop further, quicker, bringing us nearer to the point where it turns UP
So, for now, hang in there, we are nearly there..................
The ONLY thing that could halt this, is Fundimentals.....And GOLD thrives on that......
Me ? I STACK SATS

Bitcoin - Starting the final -30% drop!🛟Bitcoin ( CRYPTO:BTCUSD ) is dropping another -30%:
🔎Analysis summary:
The underlying trend on Bitcoin remains clearly bullish. But following the unusual curve channel, Bitcoin perfectly rejected the upper resistance curve. Quite likely therefore that Bitcoin will now create another bullish break and retest and first drop -30%.
📝Levels to watch:
$55,000
SwingTraderPhil
SwingTrading.Simplified. | Investing.Simplified. | #LONGTERMVISION

bitcoin daily bullish outlook Like i said earlier, i have a bullish bias on bitcoin. All you have to do is zoom out.
My next buy zone is around 86k. I am going to long bitcoin from 85-86k all the way back to 103-104k, where the next daily liquidity and supply zone is located
Wait for price to form sort of a reverse head and shoulder pattern and buy from the break out.

BTC Panic: Why This Flush Out Is a MONSTER Trade OpportunityWe are revisiting our BTC Bitcoin "Monster Trade" strategy following the recent volatility spikes triggered by Donald Trump’s tariff rhetoric at the World Economic Forum. While the market panicked, we saw a significant liquidity flush.
💰 The "Monster Trade" Strategy In this video, I break down exactly how we are capitalizing on any deep retrace and more importantly, this current pullback. We are executing a systematic position-building strategy.
The main thing with this is we MUST lock in 50% profit on existing positions before opening new ones. This allows us to ride the entire trend while banking realized gains along the journey.
Because we have already banked profits, this deep retracement isn't a threat or a risk.
🚀 The Macro View Looking at the Higher Time Frame (HTF), the technicals suggest the corrective trend is exhausting and potentially reversing. This structural shift indicates we are staring at a potentially once-in-a-lifetime opportunity to load the boat before the next parabolic Bitcoin rally.
Watch now to see the exact price levels I'm watching! 👇

Bitcoin Daily heading into the 4.618 wall with potential Range
The 4.618 Fib Extension Held PA as support a number of times in the recent past and showed itself to be Strong.
But now, it is a wall that we need to cross and return it to Support.
PA does have the ability to overcome this in the shoerter term timeframes.
The 4 hour BTC chart shows us more detail of the current situation.
On the right we can see 2 occasions were PA tried to cross this 4.618, and failed. ( there were 3 in total )
Note the resulting Range that PA did while it regained momentum to try again and eventually did Cross.
See how it used that Red 236 Fib circle as a sprnigboard to get through.
PA is ina simialr position right now, with another Fib circle coming down from just above the 4.618 Fib.
Should PA try and repeat that type of move, we are looking to Early Feb to break over that Fib Line.....Hopefully.
BUT we could simply get rejected and be pushed a lot lower ...........We simply have to react to what DOES happen but be ready for all options.....
4 Hour MACD shows a Good bounce off Over Sold
Histogram also has a Green Bar and so we may hope for More....MACD crossed the Signal line Bullish. We just need this to continue.
Daily MACD shows us potential
MACD heading towards Neutral and in areas of potential support......At the same time, the Histogram is also dropping into that support line.
MACD is laggy and only shows us what HAS happened but we can see trends.........
I can see MACD dropping below Neutral but maybe not to Far.........
Daily RSI
In an area where it has had sustained bounces previously and we need to watch this. The 4 hour ( not shown ) is bouncing from the Lows and has room to move higher.
Conclusion
The fact that the Daily MACD is falling but the daily RSI is rising shows there is support and the Fact that the 4 hour MACD & RSI are rising from the lows, shows the potential for at least a ranging, potentialy a push higher.
This would fall into the idea that was presented at the start of this post, where we looked back at the previous occasions on the Right of the 4 hour chart, were PA tried to cross the 4.618 Fib, got rejected, Ranged and tried again etc etc
If this plays out, we have around 2 weeks to wait.....
But as ever, this is BITCOIN...Anything Can happren
The possibility of a deeper Drop to low 70K and more DOES exist.
Have plans and use them

BITCOIN BULLS GETTING READY!!!! SHORT SQUEEZE INCOMING? Yello Paradisers! Enjoy the video!
And Paradisers! Keep in mind to trade only with a proper professional trading strategy. Wait for confirmations. Play with tactics. This is the only way you can be long-term profitable.
Remember, don’t trade without confirmations. Wait for them before creating a trade. Be disciplined, patient, and emotionally controlled. Only trade the highest probability setups with the greatest risk to reward ratio. This will ensure that you become a long-term profitable professional trader.
Don't be a gambler. Don't try to get rich quick. Make sure that your trading is professionally based on proper strategies and trade tactics.
