Bitcoin MA Breakout Setup: What Traders Should Watch Now📈 BTC/USDT – “BITCOIN VS TETHER” | Crypto Market Opportunity Blueprint (Day Trade)
🔥 Bullish Breakout Roadmap for Active Day Traders
🧭 PLAN:
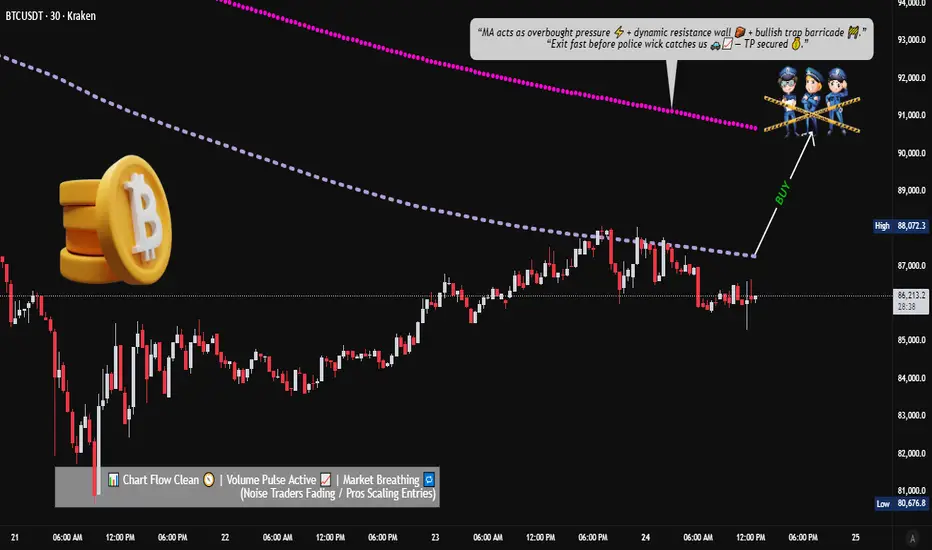
Price is attempting a bullish breakout above key moving averages. Once price clears $88,000, momentum buyers may step in and drive a continuation leg upward.
🎯 ENTRY (Breakout Confirmation):
▶ Enter at any price level AFTER a clean moving-average breakout above $88,000.
Look for strong candle closes + volume expansion.
🛑 STOP–LOSS (Risk Management First):
⚠️ This is MY thief-style SL: $84,000
Dear Ladies & Gentlemen (Thief OG’s) — manage your own risk according to your playbook.
This is only my SL, not a rule. You’re free to adjust based on your own risk appetite.
💰 TARGET:
Moving averages align as a dynamic resistance zone, combined with overbought conditions and potential bull-trap signals.
Secure profits responsibly.
▶ Target: $90,800
Again — Dear Ladies & Gentlemen (Thief OG’s), this TP is MY personal level.
Book profits your own way, at your own risk.
🔍 Related Crypto Pairs to Watch (Correlation + Key Notes)
1️⃣ ETH/USDT (Ethereum)
Highly correlated with BTC in bullish phases
Strong ETH movement often front-runs or confirms BTC breakouts
Watch for ETH strength → may add confidence to BTC breakout trades
2️⃣ BTC.D (Bitcoin Dominance)
Rising BTC dominance = Capital flowing into Bitcoin → Supports bullish continuation
Falling dominance = Altcoins gaining share → BTC breakouts may weaken or turn choppy
3️⃣ TOTAL / TOTAL2 (Crypto Market Cap Charts)
Confirms whether capital is entering the entire crypto market
TOTAL rising with BTC strength = broad market confidence
TOTAL flat/dropping during BTC’s rise = possible bull trap
4️⃣ SOL/USDT (Solana)
Solana often moves aggressively when BTC breaks out
Sharp SOL rallies can signal strong risk-on momentum across majors
5️⃣ USDT.D (USDT Dominance)
When USDT dominance drops → Traders moving out of stablecoins → Bullish risk appetite
When it spikes → Smart money hedging → BTC breakout may fail
6️⃣ BTC/USDT Perp Funding Rate
Positive & increasing funding = heavy long side → Potential squeeze
Neutral funding = healthy breakout
Negative funding = breakout might be fueled by short covering
📊 Market Tone:
BTC continues to show strong buyer interest, but resistance pockets remain.
Trade mechanically. Don’t chase candles. Let structure confirm itself.
Bitcoinmarkets
Analytics: market outlook and forecasts
WHAT HAPPENED?
Last week, the medium-term downtrend continued, and we reached the next significant volume support zone - $88,000-$82,000.
On November 21, the daily candle closed at the largest volume, comparable to the dump on October 10, 2025. However, there was no equally significant price movement, which indicates an active struggle between buyers and sellers within the framework of this candle.
WHAT WILL HAPPEN: OR NOT?
At the moment, there is an initial rebound. However, consumer activity remains weak so far, so a retest of the lower levels is possible. There are strong volume zones above, which may become targets for buyers this week.
We expect a test of the $84,000-$82,000 volume anomaly zone, either from current prices or after the test of the first resistance zone of $90,000-$92,300 (volume zone). Then we can expect a more confident resumption of buys with the potential to move towards $95,000.
If buys from the designated zone don’t resume, a test of the $74,600 level is likely with the prospect of reaching lower price levels.
Buying Zones
$97,000–$93,000 (high-volume zone)
$88,000–$82,000 (high-volume zone)
Selling Zones
$101,000–$104,000 (accumulated volume)
$105,800–$106,600 (local resistance)
$109,500–$110,700 (accumulated volume)
$112,400–$113,300 (accumulated volume)
$114,700–$115,700 (accumulated volume)
$120,900–$124,000 (high-volume zone)
IMPORTANT DATES
Macroeconomic developments this week:
• Tuesday, November 25, 7:00 a.m. (UTC) — publication of German GDP for the third quarter of 2025;
• Tuesday, November 25, 13:30 (UTC) — publication of the basic index of retail sales and their volume, as well as the US producer price index for September;
• November 25, Tuesday, 3 p.m. (UTC) — publication of the CB U.S. Consumer Confidence index for November;
• November 26, Wednesday, 1 a.m. (UTC) — announcement of the New Zealand interest rate decision;
• Wednesday, November 26, 10:00 a.m. (UTC) — UK autumn budget forecast;
• Wednesday, November 26, 13:30 (UTC) — publication of US GDP for the third quarter of 2025, as well as the number of initial applications for unemployment benefits in the United States;
• Wednesday, November 26, 15:00 (UTC) — publication of the basic price index of personal consumption expenditures and sales data new housing in the USA in September;
• Friday, November 28, 13:00 (UTC) — German consumer price index for November is published.
*This post is not financial recommendation. Make decisions based on your own experience.
#analytics

Bitcoin Weekly - PA on Cycle Base Support line and bouncing.
We are now in the last week of November and we may have hit the Low / Bottom and produced that Red candle that was suggested at month start.
PA Could Wick down in a Flash crash to Kill Longs that are mounting, before a sustained push higher in December, so remain Cautious.
This is just My opinion..It could obviously Go either way but we can see PA sitting on that Blue line, that is LONG Term support from way back in 2013
PA Fell though that line Once only, in late 2015 and recovered
The Weekly MACD
The weekly MACD is still dropping but is now approaching oversold. This has begun to open the door to it turning up. It will not drop forever
We need to watch the Histogram and wait for that to change colour, showing us that the MACD (Yellow) is getting closer to the signal line ( Red ),
The Weekly RSI
While the RSI is below Neutral, it is NOT fully over Sold yet but is a lot lower than previously.
AND we can see that it has turned Flat, stopped dropping.
This last week of November, PA could see a slight rise and so the RSI is the first thing we see moving higher.
So, For now, I think we have seen the worse of the Blood letting and now, we level out, maybe rise some, with the potential for a Flash crash to take out leverage.
I am fully waiting for December to start now.....
We are nearly out of the Woods.....Hang in there
I am not to sure how much influence the FED and its Rates decision will have over all.
We have seen in the past how BTC PA will often move independent of Rate Rises / Drops.
The chart above shows BTC PA and the Rate changes....
There ar elots of influences but , well, I am not to sure Bitcoin is finished just yet.
December and January will tell us for sure.

[WEEKLY] ANFIBO | Bitcoin BTCUSD - Downtrend? [11.24 - 11.28]Hi traders, Anfibo’s here!
BTCUSD – Technical Outlook
Overall Picture:
Last week, BITSTAMP:BTCUSD dipped into the 80,000 USD support zone, a key area that has previously acted as a structural demand region during corrective phases. The market reacted well, showing a notable bounce—though not yet strong enough to confirm a full trend reversal. Current price action remains in a broad corrective structure, and until BTC reclaims major broken levels, we treat all upward movements as retracements within a larger correction. The next week will be crucial, with clear opportunities both for strategic dip-buying and trend-continuation selling depending on how price behaves around major zones.
Weekly Trading Plan:
>>> BUY ZONE:
ENTRY: 83,000 – 85,000
SL: 80,000
TP: 96,000 → 98,000 → 102,000
(Looking to buy the retest of the previously broken structure around 98k. This is a classic “reclaim & retest” setup if momentum continues to recover.)
>>> SELL ZONE:
ENTRY: 98,000 - 102,000 (retest of breakdown)
SL: 106,000
TP: 87,000 → 80,000 → 77,000 → 72,000 → ...
(These levels align with the deeper correction targets. I will only execute these sells if BTC shows clear rejection signals, matching the purple-arrow projection.)
Risk Management:
Keep position size moderate until BTC confirms a clear trend direction.
Prioritize setups with clean invalidation points such as the 98k retest and the 76–71k demand range.
Avoid chasing price mid-range; trade only from well-defined boundaries.
Always secure partial profits once the market moves in your favor to reduce emotional pressure.
Conclusion:
BTC is showing signs of stabilizing after the bounce from 80k, but the market remains in a broad corrective phase. The plan for the upcoming week is straightforward: look to buy corrective pullbacks into the 98k retest, while also preparing to sell deeper breakdowns toward the 76–71k zone if bearish confirmation appears. Flexibility is essential—trade the chart, not the prediction.
HAVE A POWERFUL WEEK, GUYS!

Bitcoin's Death Cross is Here: A crash with a message for all!Bitcoin has just delivered one of its most significant reality ✔ checks of the year — the recent crash wasn’t simply a dip; it was a multi-layered market unwind that exposes the current fragility of the crypto ecosystem.
📉 Current Bitcoin Situation: “From Euphoria to Uncertainty”
Bitcoin’s trend shifted rapidly over the past few weeks.
Spot ETFs that once fueled relentless upside have significantly slowed inflows, with some days printing net outflows as retail enthusiasm cooled and institutions trimmed exposure.
Meanwhile:
Over billions in long liquidations hit in some days.
Funding flipped aggressively negative
Sentiment turned from greed → hesitation
High beta alts saw steeper collapses, showing risk-off behavior
This wasn’t random volatility — it was a controlled flush triggered by structural weakness.
🔥 Why Bitcoin Crashed: The Real Story
🔹 Technical Factors
BTC lost a major support cluster after multiple failed attempts to hold the mid-range.
Open interest was overheated, creating the perfect setup for a liquidation cascade.
Price rejected sharply from a supply zone that aligns with the weekly imbalance.
☠️ Death Cross on Daily Time Frame: Now Confirmed
The 50 SMA crossing below the 200 SMA is not a “doom event” by itself…
But historically, Bitcoin rarely ignores this signal, especially when paired with weakening momentum and fading liquidity.
⚠ The last major Death Cross?
2022’s brutal bear continuation, which led to several months of grinding downside before any meaningful reversal.
The current structure looks uncomfortably similar:
Lower highs printing consistently
Loss of trend strength
Distribution patterns on higher time frames
Declining demand from smart money inflows
This isn’t fearmongering — it’s observation.
🔹 Fundamental + Macro Factors
ETF inflow cooldown = reduced demand pressure
Miners started selling into strength to stabilize income post-difficulty adjustment
Global markets leaned risk-off due to macro tightening
Whales began distributing quietly (confirmed by on-chain inflow spikes into exchanges)
When technical fragility meets fundamental slowdown, crashes are not accidents — they’re consequences.
🐋 Whales Are Selling: “When the quiet money moves, the market reacts loud.”
On-chain data over the last week showed:
Increase in exchange inflows from large wallets
Spot distribution from old long-term holders
ETF issuers are reducing inventory during downswings
This behavior is classic:
Whales distribute during periods of retail excitement…
Retail panics during whale exits…
And the crash becomes a self-fulfilling cycle.
📅 4–6 Week Forecast: “Chop, Pain & Opportunity”
Over the next month or so, the market will likely experience:
Sideways-to-down structure
Failed rally attempts near the 50 SMA
Whip-saw price action due to low conviction
Accumulation pockets are forming quietly
BTC needs to reclaim the 50 SMA with strength before a clean trend resumes.
Until then, volatility ≠ strength.
🎯 Conclusion: Re-Investment Zones & Smart Accumulation
Crashes are emotional for most, but strategic for the prepared.
This is not a call to rush.
It’s a reminder:
Smart money enters when sentiment collapses.
Dumb money enters when sentiment peaks.
Analyze. Prepare. Don’t chase.
🧩 Comment down below 👇 and let’s talk about how to overcome it — build awareness together as traders, not competitors.
If this Idea gave you valuable information, then please boost it, and follow for more practical trading!
Happy Trading & Investing!
Team @TradeWithKeshhav
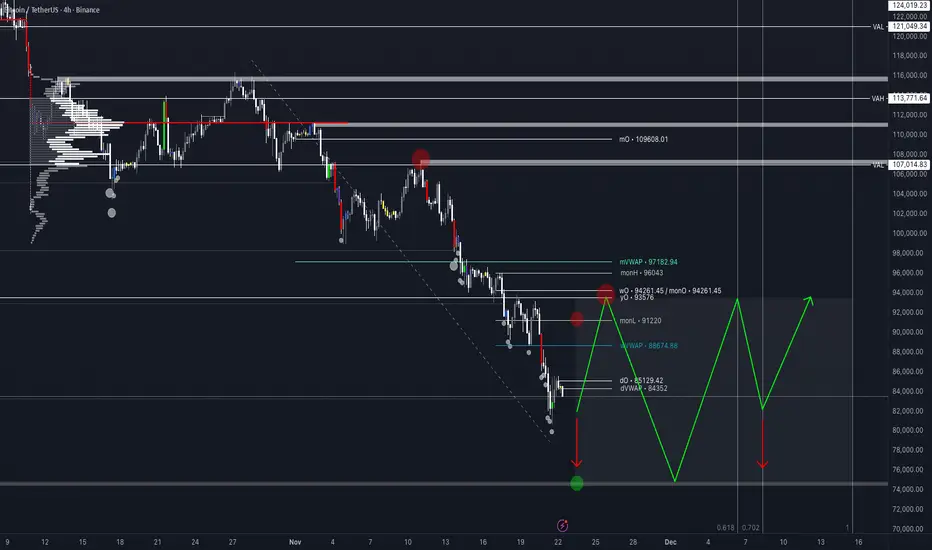
Bitcoin Toxic Flows! We need to find balance. After the violent & toxic order flow selling this week on CRYPTOCAP:BTC spot holders in pain, but as traders we have a few key levels to observe. READ PREVIOUS POST ^ for dates & timing. We have major weekly level at 75k & yOPEN 93.5k.
The cleanest outcome is to auction price with organic flows, how does the market find balance? We range. This can come from a squeeze up 1st to test the 93.5k supply or rip the band aid off & give us 75k test. From there? we simply need to observe all flows with zero bias as mercenary sharp shooting traders.
80K is well supported for now. 1.49billion aggregated. But as we have seen this week, key levels breaking one after another. Either way, I would enjoy a range here, why? it simply makes for better trading.
Have a great weekend all!
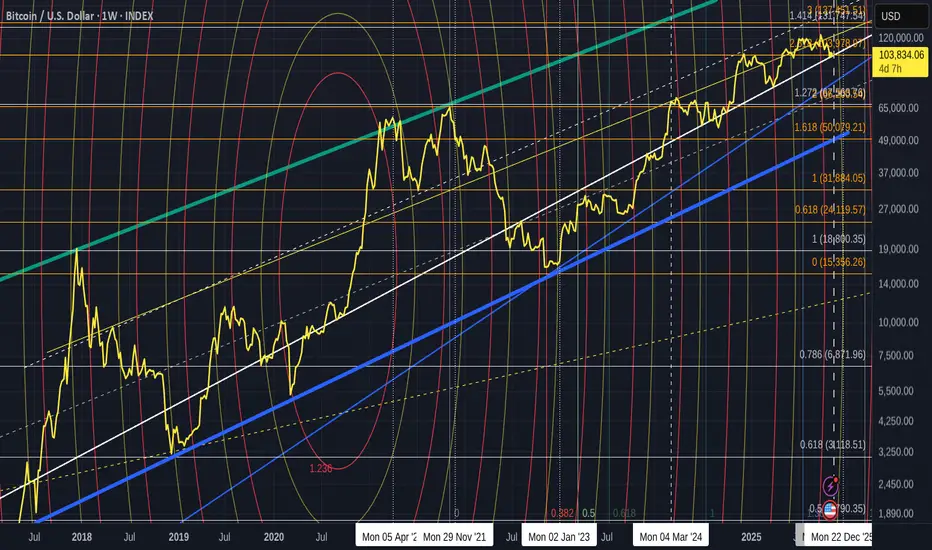
Bitcoin Bear Market Outlook🔴 INDEX:BTCUSD has confirmed a cycle peak near Target area 127K and begun correcting the entire rally from the 2022 low. This corrective phase could extend for a full year (Oct 2025 – Sep 2026), with the evolving structure defining the depth and character of the move.
🟠 The April 2025 lows (80K–75K) may trigger an initial bounce that fails, opening the path for deeper downside toward the July 2024 lows near 50K.
🟢The ideal accumulation zone lies below 50K, with the 2021–2022 support at 33K–28K acting as a critical pivot for long‑term equilibrium and the next bullish cycle.

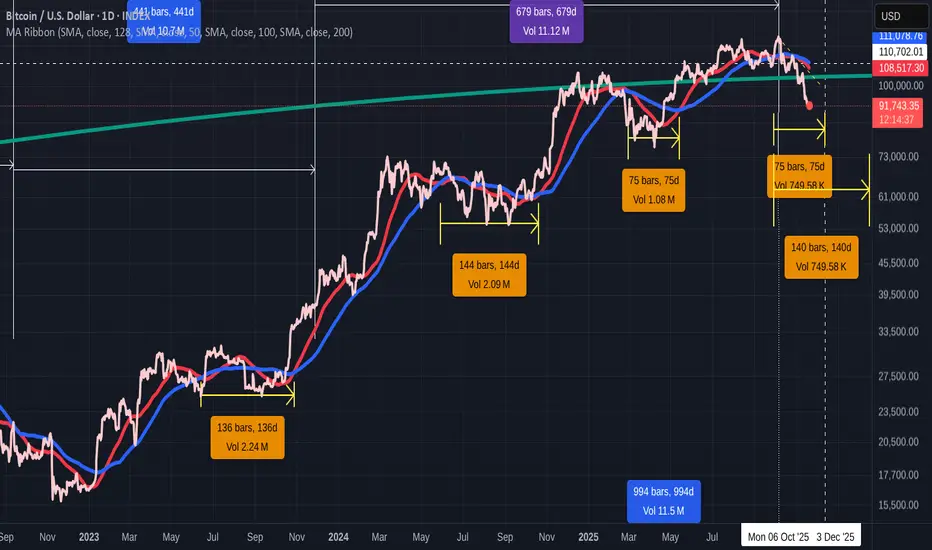
Bitcoin Daily 50 & 100 SMA day counts this cycle from crossover
This post is in conjunction with the weekly SMA I just posted.
It will predict nothing But it will give us an idea of how the "Cycle" is continuing or not, by the end of this month.
The day counts are from when the 50 SMA ( RED ) first drops below the 100 ( BLUE ) - BEARISH, to when the 50 Rises back above and remains above on the DAILY BITCOIN INDEX chart.
The First 2 occasions, since Jan 2023
2023 - 136 days
2024 - 144 days
Unusually, 2025 has 2 occasions where the 50 dropped below the 100.
The first lasted 75 Days in early 2025
And so , now, with the daily 50 having just crossed below the 100, we can maybe project forward and see when the 50 may recover back over the 100, IF the market remains Bullish
If we were to do another 75 days, we could expect the Bullish crossover at the beginning of December....which would be a similar total day count of the 50 below the 100 of the previous years this cycle ( 75 in early 2025 + 75 now )
THIS is what I think is possible as it has confluence with other charts.
If we have to wait around 140 days ( the average of the two previous longer occasions) we will be in February 2026
This Time does also have some confluence in other charts but it less strength
There is a Very Good reason Why O feel that PA HAS to climb again and that is simply that PA has fallen back below LONG TERM RESISTANCE>
As mentioned in many previous posts, that Blue Arc has rejected EVERY ATH since Bitcoin began its climb in 2011
There is also a line of resistance just below current PA position, that is squeezing PA....And it has never been crossed before.
IF PA drops much further, we WILL drop below that line of Support.
For me, THIS is what I am watching the most
Stay safe
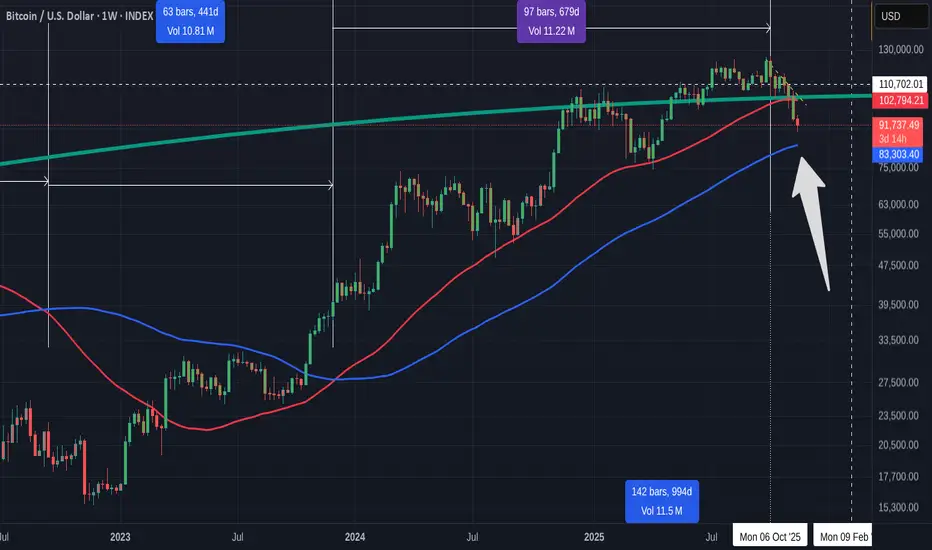
Bitcoin Weekly SMA - Next Level support at the 100 SMA 83K and..** Candle Colours are effected by a Bull Bear indicator, indicating Bull Bear sentiment...
Note THIS week is the First BEAR week Candle in a very long time, since March 2025
Bitcoin Lost the 50 SMA ( RED ), first time this Cycle.
And we see the 100 SMA ( BLUE ) running parallel and so, this s logically the next level of support should we drop lower.
What is the relevance of the 50 & 100 SMA to Bitcoin PA
This is the Bitcoin Chart since December 2013
The Labels above are the day counts from ATH, to the SMA crossing Bearish ( 50 dropping below the 100
To when the SMA cross Bullish ( 50 rises back above the 100 ) and then to ATH
The Lower day count is from when the 50 crosses above the 100 to when it crosses back below.
And Many things point to the fact that we may well have past the ATH point and are now entering the Bear Market.
Loosing the 50 backs this up to many extents.
So now we look to the 100 to see if PA holds 83K or not.
Interesting to note, that because of how Calmly this "Cycle" has preformed ,, Haw parallel the 50 and 100 are to each other, we are reaching gown to the 100 Much quicker than previous occasions. Very interested to see what happens.
SOPR has just flashed a BEARISH signal
People are capitulating, selling in Fear and making Losses.
A Sure sign of the BEAR.
But there Many things that support the idea that this is NOT the end of this Run to True ATH.
For me, this is helped by the fact that the RSI is so near OVERSOLD that it will RISE.
Not a Guarantee though
But we also have the Weekly MACD down low too
You can see on this chart how the Histogram tends to find support on this level
The MACD line has Crossed below Neutral.
We are in an area for a bounce.
This may not happen and it is impossible to predict this
We need to continue watching and see where the PA goes on that 100 SMA
I have been doing TA for many years now and I have to say, this time, Things are a lot more conveluted than normal..Many conflicting signals....
We have Short Term and Long Term ideas presenting cases for both Bullish and Bearish scenarios.
So, We wait to see what happens on the 100
Look at the Long Term chart and see what happens when the PA crosses the 100 ( Blue )
We need that Bounce for the Bulls
PA Drops below, BEARS
BTCUSD – Summary of the Higher-Timeframe Buy ScenarioBitcoin has already printed a major Break of Structure (BOS) to the upside, establishing a long-term bullish trend. The current sell-off is a corrective leg, unwinding inefficiencies created during the prior expansion phase.
Price is now gravitating toward a key daily demand zone, which is the origin of the BOS and the zone that previously launched the strong bullish impulse. This area remains unmitigated and holds institutional order-flow significance.
If price retraces into this zone, a reaction is highly probable. The expectation is for consolidation, a shift in short-term structure, and then a new bullish leg that continues the higher-timeframe trend—targeting new highs once the market rebalances.
This setup frames the demand zone as the strategic value area for long-term buyers, aligning with structural bias and discounted pricing.

Bitcoin - This chart is crumbling!⛔️Bitcoin ( CRYPTO:BTCUSD ) creates a massive top:
🔎Analysis summary:
All the previous cycles on Bitcoin have been lasting about 1,000 days. And exactly three years ago, Bitcoin retested the previous all time high, starting the next bullrun. If we soon see bearish confirmation on Bitcoin, this crypto will lead to another insane bloodbath.
📝Levels to watch:
$100,000 and $50,000
SwingTraderPhil
SwingTrading.Simplified. | Investing.Simplified. | #LONGTERMVISION

BITCOIN : First Drop Then Shoot Up To $150,000Overview🧠
Bitcoin is in a bearish trend since it reversed from our previous trading zone. We expect the price to continue declining between 60,000 and 70,000. This is a suitable time to consider buying Bitcoin. Once the trade is activated, there are three potential targets: 90,000, 120,000 and 150,000.
Please use appropriate risk management when trading Bitcoin as it is a more volatile asset.
We wish you the best of luck.
Team Setupsfx_❤️🏆

Analytics: Market Outlook and Forecasts
📈 WHAT HAPPENED?
Last week, Bitcoin reached key resistance in the $105,800-$107,400 range, from which we expected a correction. If the seller showed weakness, it would be profitable to open long positions. However, there was no noticeable protection from the buyer, and the price decreased.
We’re currently at the lower boundary of the important medium-term support zone of $97,000-$93,000 (volume zone). The selling pressure is still high, but it’s not resulting in any significant movement. There is a lack of updates within the zone, and the angle of attack has decreased, while the volumes have increased. There are limit buyers present, but their activity is insufficient to indicate strength.
💼 WHAT WILL HAPPEN: OR NOT?
The medium-term market structure appears to be short-term. But the global picture still allows for a confident resumption — it just takes time.
We can expect a long exit from the current zone when a clear setup is formed. However, another decline wave is inevitable, as there is a strong volume zone above, which should be worked out under the current structure.
In a negative scenario, if there is no buyer interest, the decline will continue until the next global support.
Buy Zones
$97,000–$93,000 (high-volume zone)
$88,000–$82,000 (high-volume zone)
Sell Zones
$101,000–$104,000 (accumulated volumes)
$105,800–$106,600 (local resistance)
$109,500–$110,700 (accumulated volumes)
$112,400–$113,300 (accumulated volumes)
$114,700–$115,700 (accumulated volumes)
$120,900–$124,000 (high-volume zone)
📰 IMPORTANT DATES
Macroeconomic events this week:
• November 19, Wednesday, 7:00 (UTC) — publication of the UK Consumer Price Index for October;
• November 19, Wednesday, 10:00 (UTC) — publication of the Eurozone Consumer Price Index for October;
• November 19, Wednesday, 19:00 (UTC) — publication of the minutes of the US FOMC meeting;
• November 20, Thursday, 13:30 (UTC) — publication of the average hourly wage for September, the number of initial unemployment claims, the change in the number of non-agricultural workers for September, the unemployment rate in the United States for September, and the Philadelphia Fed's Manufacturing Activity Index for November;
• November 20, Thursday, 15:00 (UTC) — publication of data on second-hand housing sales in the United States for October;
• November 21, Friday, 14:45 (UTC) — publication of the US manufacturing and services business activity index for November.
*This post is not financial recommendation. Make decisions based on your own experience.
#analytics
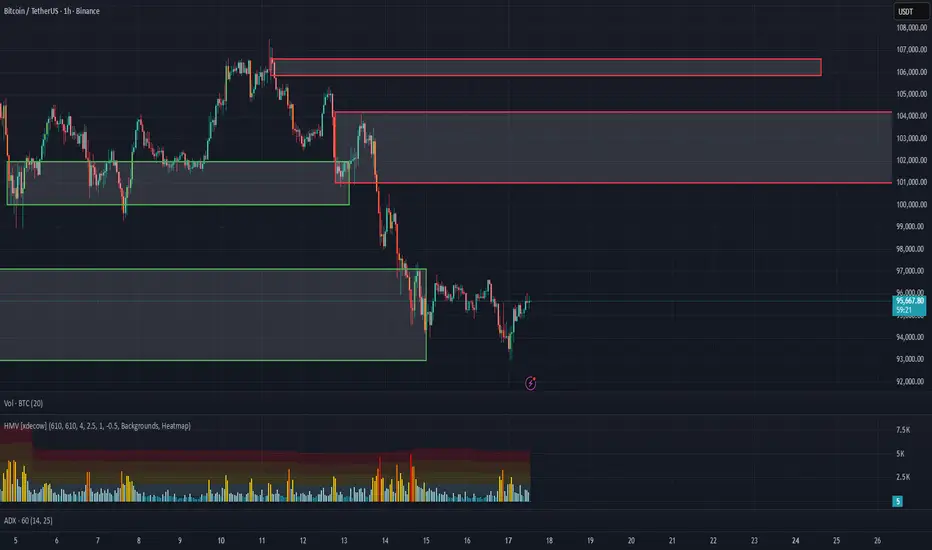

BTC Bearish Continuation, Watching 95,000 for BreakdownBitcoin on the 1D chart remains locked in a clear bearish structure since the early-October peak near 125,000. Price is printing consistent lower highs and lower lows, now hovering around the 95,000 zone after a sharp sell-off. All three key moving averages (20, 60, 120) slope downward above price, with the 20-day already below the 60-day, while MACD is deeply negative and SQZMOM prints strong red bars — a classic backdrop for trend continuation, not reversal.
For now, 95,000 is the key demand zone. A decisive daily close below 94,000 would confirm fresh downside, opening the path toward 90,000 first and then the next bearish magnet around 88,000, with 85,000 as an extended target if momentum accelerates. In this view, any bounce into 102,000–108,000 is considered a potential selling opportunity while price stays below the early-November lower high, with 97,000–102,000 acting as a practical risk zone for invalidating short-term breakdown attempts.
The bullish alternative only gains traction if buyers can force a daily close back above 105,500, reclaiming the 20-day MA and squeezing shorts. That would put 112,500 and the 111,000–113,000 moving-average cluster back in play, with a larger shift in structure only confirmed if price eventually reclaims the prior lower high and then 115,000. Until then, the path of least resistance remains lower.
Thought of the Day 💡
Strong trends often punish counter-trend trades more than they reward bravery. Trade with the dominant flow, not against it.
This is a study, not financial advice. Manage risk and invalidations

Very Simple BITCOIN Daily - Hope for the weekend existsThis is a chart I posted some weeks ago, showing the possiblr results of the classic W pattern printed by Bitcoin
We seem to be playing this out and so a Low, ultimate low of around 88K exists and I will not do anything till we pass that point, IF we pass that point.
And the MACD gives us hope that we may not do so
MACD has reached the lower trendline of its descending channel and at the same time, has reached the LOW in Oversold, that Bitcoin bounced off previously
This is not a Guarantee but it does certainly offer hope for some recovery....and we would have to wait and see if that is sustained or not.
But this IS playing out Exactly to plan and has confluence with what I said may happen at the beginning of the month
For me, this is NOT the END.... but near the beginning of the next push
BUY BITCOIN

Is BCH/USDT Setting Up a Downside Swing? Structure Explained🔻 BCH/USDT – Crypto Market Opportunity Blueprint (Swing Trade)
“Bitcoin Cash vs Tether: Bearish Structure in Focus”
📉 Trade Outlook
The bearish plan has been confirmed following a decisive weighted moving average dynamic-support breakdown, signaling potential downside momentum.
📌 Entry
You may enter at any price level that aligns with your trading framework and confirmation signals.
🛑 Stop-Loss (SL)
This setup uses a reference SL @ 520.0.
Dear Ladies & Gentleman (Thief OG’s), adjust your stop-loss according to your strategy, your confirmation, and your risk appetite.
Place the SL only after the breakout confirmation.
Note: This SL is not a recommendation. Manage your trade independently and execute based on your own risk tolerance.
🎯 Target (TP)
The moving average currently acts as a strong resistance zone, combined with overbought conditions + a potential trap setup.
Our reference target stands at 460.0 — lock in profits if the structure moves in your favor.
Note: This TP is also not mandatory. Choose your own exit based on your analysis and risk preferences.
📚 Market Structure Breakdown
Dynamic support has clearly failed → signals bearish momentum
Price retesting lower MA zones indicates weak bullish pressure
Volume profile confirming seller strength
Structure favors downside continuation if resistance holds
🔍 Related Pairs to Watch (Correlation Insights)
1. BITSTAMP:BTCUSD (Bitcoin)
BCH often mirrors BTC’s broader trend.
If BTC breaks key support levels, it can amplify downside on BCH.
Watch for MA rejections or liquidity grab zones.
2. BITSTAMP:ETHUSD (Ethereum)
ETH weakness frequently leads to crypto-wide risk-off sentiment.
ETH/BTC ratio drop usually pressures altcoins, including BCH.
3. COINBASE:LTCUSD (Litecoin)
A close competitor to BCH with similar structure behavior.
If LTC forms bearish MA crossovers or loses trendline support, BCH weakness can follow.
4. BINANCE:BNBUSDT (Binance Coin)
BNB drives exchange-based flows.
Increased selling in BNB can trigger broader altcoin corrections, hinting at BCH continuation.
5. BINANCE:BCHBTC (Bitcoin Cash vs Bitcoin)
Direct correlation indicator.
A falling BCHBTC pair signals relative weakness, strengthening the bearish case.
📌 Final Notes
This blueprint provides a structured guide for your analysis — but execution, SL, TP, and risk remain your personal decision.
Trade safe, stay disciplined, and follow your confirmation signals.

Quick Bitcoin Update - Daily Linear chartRefering to my previous post.
RED 236 Fib circle reached
PA reacted before APEX of Squeeze.
This is approaching a VERY GOOD BUYING oppertunity
We may go to 95K and possibly 88K but the Arrow is the Target I am looking at
Time will tell

Bitcoin Daily back in a Squeeze - WILL react by Nov 25th but....
And there we have it, A Working chart
"Oh No, Lots of lines" I hear you cry
But every one has relevance.
The Lines descending from left to Right are Fib Circles, Nearly Always resistance and the RED ones are 236 Fib circles....Normal rejection almost guaranteed.
You can see the current ATH got rejected off the 6.768 Fib extension and a 236 Fib circle.
So far, we have fallen through a number of Fib Circles and have found support on the 5.236 Fib extension
This has also put us under pressure from the next Fib circle and so, we are in a Squeeze that has an apex on 25th this month.
This is likely rejection
This all adds confluence to what I said at beginning of the month in my Monthly Candle colour report, that does point towards a stronger likelihood of a RED close for November,
But a Green December should Follow.
Back to this month
The Arrow points towards where I think we will land and find support IF we loose the current level.
That would be around 95K on the 5 Fib extension. It also happens to be just above the next 236 Fib circle,
Bur more importantly, that dashed line is a long Term support that has support PA previously.
see below
I removed the Fib circles for clarity
You can see how that dashed line was support, as has the 5 Fib extension.
While we are here, Take Note of the horizontal 3 & 6 Fib extensions ( bold )
And see the earlier version here.
See how the 3 rejected the 2021 ATH line, the 1 supported the bounce in 2021 and the 0.236 rejected the 2017 ATH
On this cycle, that 3 fib line was the 2024 line of rejection ( PA went over and below but always in that field )
The 2025 Run has been around the 6.
I think we could reach up to the 9 over the course of the next 12 months.
"WHAT ???" "End of 4 year cycle means we fall into a BEAR doesn't it?"
I have a feeling that this may not happen. Things are VERY different this time......and there are plenty of reasons why we simply CANNOT pull back 80% from here...all mentioned in previous posts
But I do believe November WILL close RED....But DO NOT PANIC -> BUY
The Bull Run will start again in December

BITCOIN TO $130,000 - $140,000Hello! It's me again!
My friends, it seems that BTC's price action is clearly indicating its trend and direction. Of the last five candles on the weekly chart, four have shown a very clear indication: there are buyers on the downside, it has remained above the 55-week moving average, and we've seen very strong support around $103,000.
It's also true that the uptrend on the weekly chart is already quite worn out. It has been quite long and has remained solid until now; however, this could be the bullish move that ends the trend.
At the moment, the technical analysis is simple and very clear: we are within the lower range of an upward move (I bought at $109,900 six weeks ago and I plan to hold since the movement is clear).
In conclusion, Bitcoin will be looking for the $130,000 range and, at most, $140,000. The final upward move is about to begin.
See you later! And remember, this isn't advice, it's just an opinion.

Various things point to a Bitcoin Move higher within next 9 days
There are a number of simple things, basic YA, that points towards A Move from Bitcoin.
The Pennant being printed Right now, with PA squeezed between the 2.618 Fib and a Long Term line of rising Support, could be seen as Bearish
The rising line of support is Strong however and we last touched it back in April 2025 and bounced well.
We arrived there after a long sustained Drive by the Bears to push us down, as is the case right now.
If we zoom into the 4 hour, we see more detail
There is a sustained Ceiling (2.618 fib ) and each time PA gets rejected the Bulls step in and we now are working with in a decreasing Range.
But the Bears ARE in control right now and this is why we are were we are now.
PA being Squeezed and heading to an Apex.
PA Always reacts BEFORE the Apex and I expect the latest this could happen to be around the 17Th November.
But the MACD Always shows us another side, a trend formation.
Lets look at the Weekly first
So we see how the Weekly MACD is falling Bearish still and will likely do so until it meets its first line of support around.....17 November. See the Vertical blue cashed line on the PA 4 hour chart and then look where that is on this MACD chart
Then see the rising dashed line that previous MACD Lows seem to have bounced off.
NOTE, there is a possible inaccuracy here as trends require 3 touches to be Valid....This has had 2. So, we wait to see..........
Otherwise, the projected MACD arriving at Neutral is around 22 December......
The Daily MACD
The Fact that Naily MACD has not been this low for a Long time, also points towards a Move in the near future.
In fact, the last time MACD was this low, was March 2025, just beofre PA hit long Term Support and bounced....
Bitcoin Dominance is approaching a local line of support
Conclusion
While there are Bullish signs, it should be remembered, we can still drop lower while sentiment fall and the Rotation of Money towards ALTS gains momentum. But as had happened so many times this cycle, Things can turn VERY quick and if you are selling to Buy ALTS< Remain Very cautious
As mentioned in my monthly Candle colour report, I mentioned that November could close Red......But it may not.....it is honestly a very difficult market right now....
But one thing is Certain.. BTC PA will make a bigger move soon......We just do not know for sure, in which direction but for me, the odds are that it will go higher.
Time will tell
Market analysis using bitcoin dominance & usdt dominance chartsWe aim to conduct an in-depth analysis of the correlations among four key indicators used to interpret the complex dynamics and investor sentiment in the cryptocurrency market — Bitcoin Dominance, USDT Dominance, TOTAL3, and the Coinbase Premium — and to share insights on how these can be effectively utilized in real trading strategies.
By analyzing these four indicators together, traders can identify the overall market trend, gauge the vitality of the altcoin market, and assess institutional participation, which provides a foundation for developing mid- to long-term trading strategies.
First, please click Boost (🚀) so that more people can see this post.
💡Understanding the Key Indicators
Bitcoin Dominance: CRYPTOCAP:BTC.D
The ratio of Bitcoin’s market capitalization to the total cryptocurrency market capitalization.
It represents Bitcoin’s market strength relative to altcoins.
USDT Dominance: CRYPTOCAP:USDT.D
The ratio of Tether (USDT) market capitalization to the total cryptocurrency market capitalization.
It helps identify risk-on/risk-off sentiment among investors and assess the level of market liquidity.
TOTAL3: CRYPTOCAP:TOTAL3
The total market capitalization of all altcoins excluding Bitcoin (BTC) and Ethereum (ETH).
It directly reflects the overall momentum of the altcoin market.
Coinbase Premium Index: TradingView Indicator
An indicator showing the price difference of BTC between Coinbase and other major exchanges (e.g., Binance).
It is used to indirectly gauge institutional buying pressure (positive premium) or selling pressure (negative premium) in the U.S. market.
⚙️Interaction of Indicators and Trading Strategies
These four indicators exhibit specific patterns under different market conditions.
By analyzing them comprehensively, traders can identify medium- and long-term trading opportunities.
Correlation between BTC price and indicators:
BTC price vs BTC.D: Complex correlation.
BTC price vs USDT.D: Mostly inverse correlation (USDT.D rising = market uncertainty and BTC decline)
BTC price vs TOTAL3: Mostly Positive correlation (BTC rise = TOTAL3 rise)
BTC price vs Coinbase Premium: Mostly Positive correlation (sustained positive premium = continued BTC uptrend)
✔️Scenario 1: Bullish Phase📈 (Bitcoin-led Rally)
BTC.D rises: Capital concentrates into Bitcoin
USDT.D falls: Increased risk appetite, cash inflows grow
TOTAL3 moves sideways or slightly upward: Altcoins remain weak or unresponsive
Coinbase Premium rises and stays positive: Institutional buying inflow
Interpretation:
Strong institutional buying of Bitcoin drives the market, with capital shifting from stablecoins into BTC.
Altcoins may lag behind this movement initially.
Strategy:
If the Coinbase Premium remains positive even during minor BTC corrections, it favors building long BTC positions.
When the positive premium persists and BTC breaks key resistance levels, it can be interpreted as a strong buy signal.
During early stages, focus primarily on Bitcoin rather than altcoins.
✔️Scenario 2: Strong Bull Market📈 (Altcoins Join the Rally)
BTC.D declines: Capital rotates from Bitcoin to altcoins
USDT.D declines: Ongoing risk appetite and continuous inflows
TOTAL3 rises: Peak momentum in the altcoin market
Coinbase Premium remains positive: Continuous liquidity inflow
Interpretation:
As Bitcoin stabilizes or trends upward, capital starts flowing aggressively into altcoins.
The rise in TOTAL3 reflects broad-based strength across the altcoin market.
Strategy:
Select fundamentally strong altcoins and build positions gradually.
During this phase, large-cap and small-cap thematic groups may experience rotational pumps — monitoring related narratives is crucial.
✔️Scenario 3: Bearish Market📉
BTC.D rises: Altcoins fall more sharply as BTC declines
USDT.D rises: Strengthened risk aversion and increased cash positions
TOTAL3 declines: Deepening weakness in the altcoin market
Coinbase Premium drops and stays negative: Institutional selling or halted buying
Interpretation:
Heightened market anxiety leads investors to liquidate risk assets and move into stable holdings such as USDT.
Institutional selling pressure pushes the Coinbase Premium negative or maintains it in a downward trend.
Altcoins are likely to experience the greatest losses in this phase.
Strategy:
Reduce crypto exposure or convert positions to stable assets (USDT) for risk management.
During technical rebounds, consider trimming positions or cautiously taking short opportunities (with higher risk).
✔️Scenario 4: Sideways or Correction Phase
BTC.D moves sideways: Range-bound consolidation
USDT.D moves sideways: Persistent risk aversion and lower market volume
TOTAL3 moves sideways: Altcoin market remains flat or slightly weak
Coinbase Premium stable: Fluctuates between positive and negative values
Interpretation:
The market enters a wait-and-see phase with sideways movement or mild correction.
The Coinbase Premium’s neutrality reflects uncertainty in institutional capital flows.
Strategy:
Monitor BTC and TOTAL3 reactions at major support levels before re-entering positions.
It may be prudent to stay on the sidelines until clear institutional accumulation or positive catalysts emerge to restore sentiment.
🎯TradingView Chart Setup and Usage Tips
Multi-Chart Layout: Use TradingView’s multi-chart feature to display BTCUSDT, BTC.D, USDT.D, and TOTAL3 simultaneously for comparative analysis. (Apply Coinbase Premium as an additional indicator.)
Timeframes: For short-term analysis, use 1H, 4H, or 1D; for medium- to long-term, use 1W or 1M charts. Confidence increases when multiple indicators align across the same timeframe.
Trendlines and Support/Resistance: Draw trendlines, support, and resistance on each indicator chart to identify key inflection points. Breakouts on USDT.D or BTC.D often signal major market shifts.
Supplementary Indicators: Combine RSI, MACD, or other technical indicators to detect divergences or overbought/oversold zones for added precision.
⚡Analytical Value and Considerations
Comprehensive Market Insight: Analyzing all four indicators together enhances overall market understanding.
Leading vs Lagging Indicators: Coinbase Premium can serve as a leading signal, while dominance and market cap metrics act as coincident indicators reflecting current conditions.
Probabilistic Nature: These indicators are not predictive tools but should be interpreted within a broader context of market variables.
Risk Management: Always apply stop-loss measures and manage exposure carefully. Be prepared for deviations from expected market behavior.
🌍Conclusion
Bitcoin Dominance, USDT Dominance, TOTAL3, and the Coinbase Premium Index are fundamental components in decoding the complex structure of the cryptocurrency market.
Analyzing them in conjunction enables a deeper understanding of market sentiment, anticipation of upcoming opportunities and risks, and the development of a more intelligent and stable trading strategy.
💬 If you found this analysis insightful, share your thoughts in the comments!
🚀 Don’t forget to hit Boost to support the post!
🔔 Follow to make sure you don’t miss the next market insight!
Quick Bitcoin Update - BTC entered a Squeeze. Needs to react
Simply, PA is now on a line of support that goes way back to 2017
PA Rose above it in 2019, COVID caused a Drop below but PA Recovered.
The 2022 Bear kept PA below for a Long Time but we broke back over.
And now, we test it again at te end of the 3rd Ranging period this Cycle.
There are things that Both Support and wtroy the idea that Oa can stay here and so we really do need to remain vigilant...
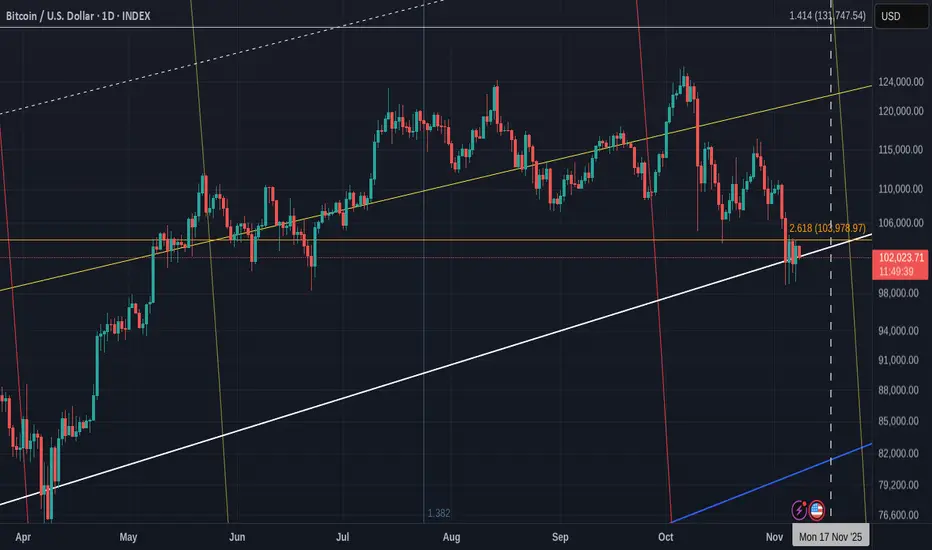
This Zoomed chart explains the situation clearly.
So we see, PA is now in a triangle, with the 2.618 Fib extension at around 103978, acting as resistance and the Long Term line f support mentioned above , as support.
This is a tight Squeeze. The Apex is around 17 November
PA ALWAYS REACTS BEFIRE THE APEX
This could be abytime from now till then.....
Be Ready
Bulls....We need you