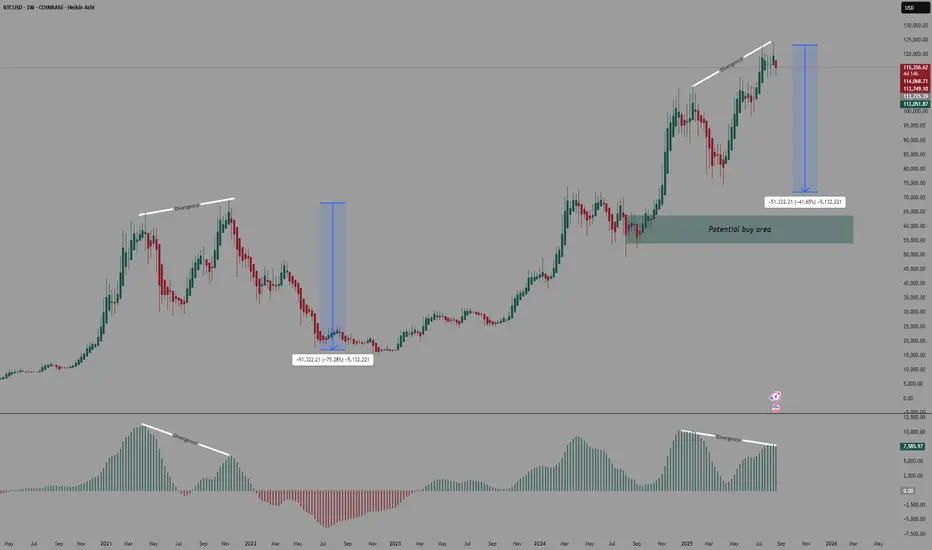
Bitcoin Price History Says BTC Needs To Crash 8% To Form New ATHAt the time of writing, Bitcoin trades at $112,221, holding firm above the $110,000 support. This resilience reinforces the four-month uptrend line and signals potential short-term gains. The momentum is intact, with BTC eyeing higher levels.
If sustained, Bitcoin could climb past $112,500 and head toward $115,000. Yet to reach a new ATH, history suggests BTC might need to drop to $101,634 first, setting the stage for a stronger breakout.
On the flip side, if profit-taking escalates, BTC could slip toward the retracement level sooner. But should fear-driven selling dominate, the price risks falling below $100,000, which would invalidate the bullish outlook and extend the correction phase.
Bitcoinmarkets

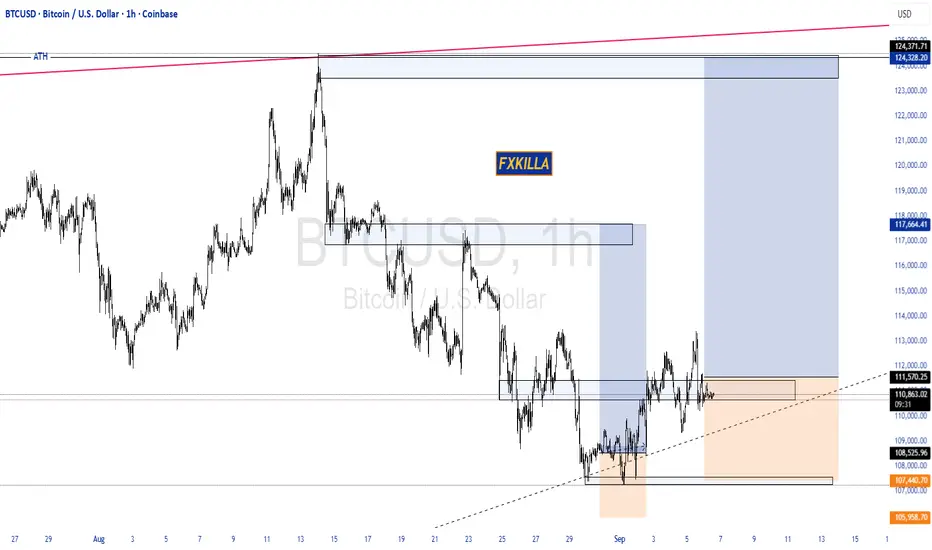
BITCOIN HIGH PROBABILITY SETUP SOON!!!🚨 BITCOIN HIGH PROBABILITY BUY SETUP 🚨
* Here We Can See The Next Potential Move For BTC Coming Hours/Days.
* Keep Your Eyes Close On Your Trading Positions.
* Happy PIP Hunting Traders.
FXKILLA.
BTC/USDT Crypto Heist - Bullish Breakout Blueprint!🔥 Thief Trading Style: BTC/USDT Bullish Heist Plan 🔥
Greetings, Money Makers & Market Robbers! 🤑
Ready to execute a daring heist in the Bitcoin vs. Tether (BTC/USDT) crypto market? 📈 Our Thief Trading Style combines technical precision and fundamental insights to target a bullish breakout. Follow this charted strategy to ride the wave and exit before the risky Red Zone. Let’s grab those profits together! 💪🎯
---
📊 Trade Setup: The Heist Plan
- Market: BTC/USDT (Crypto) 🌐
- Bias: Bullish Breakout 🌟
- Timeframe: 1D (Swing Trade) ⏰
Entry 📈:
- Breakout Entry: Wait for a clean breakout above the Moving Average (MA) at 108000. Place Buy Stop orders just above 108000 to seize the momentum. 🚀
- Pullback Entry: For lower-risk entries, set Buy Limit orders at the recent 15M/30M swing low (e.g., 105000-106000) to catch pullbacks. 📍
- Trader Tip: Set a TradingView alert for the 108000 breakout to stay ahead of the move! 🔔
Stop Loss 🛑:
- Breakout Traders: After the breakout confirms, place your Stop Loss below the recent 1D swing low at 96000 to guard against reversals. ⚠️
- Pullback Traders: Tailor your Stop Loss to your risk appetite (e.g., 1-2% of account). Adjust based on lot size and multiple orders. 📏
- Risk Alert: This heist is high-stakes! Stick to disciplined position sizing to protect your capital.🔥
Target 🎯:
- Aim for 122000, near the risky Red Zone (an overbought area prone to consolidation or reversal). 🏴☠️
- Exit Strategy: Consider taking profits early if bearish signals (e.g., high volume, reversal candles) emerge near 122000. 💸
Scalpers 👀:
- Stick to Long-side scalps with tight trailing stops. Join swing traders for the full heist or scalp quick moves if your capital allows. 💰
---
📡 Why This Heist Has Potential
BTC/USDT is in a neutral trend with strong bullish prospects, driven by:
- Technicals: A breakout above the 108000 MA, backed by higher lows on the 1D chart, signals robust momentum. 📊
- Fundamentals: Institutional buying and positive crypto sentiment (check COT reports) fuel upside potential. 📰
- Seasonal Trends: Bitcoin often rallies in Q2, aligning with our setup. 📅
- Intermarket Factors: USD weakness and altcoin strength could lift BTC higher. 🌎
---
⚠️ Risk Management: Secure Your Gains
- News Caution: Skip new trades during major news events (e.g., CPI, FOMC) to avoid volatility spikes. 🗞️
- Trailing Stops: Use trailing Stop Loss to lock in profits as price nears 122000. 🔒
- Position Sizing: Limit risk to 1-2% of your account per trade for a safe heist. 🚨
---
💥 Power Up the Heist! 💥
Join our Thief Trading Style crew by liking, commenting, and following for more high-energy trade plans! 🚀 Your support strengthens our market raids, helping us profit with precision. Let’s conquer BTC/USDT together! 🤝🏆🎉
Stay Sharp: Another heist plan is on the horizon. Keep your charts locked and loaded, traders! 🐱👤😎
#BTCUSDT #Bitcoin #Crypto #Bullish #SwingTrading #Breakout

BTC Triangle Squeeze: Next Stop $116K?Bitcoin is currently consolidating inside a symmetrical triangle, a classic squeeze that often precedes a strong breakout 💥. Price is building pressure with higher lows and lower highs, waiting for confirmation.
✅ Bullish Confluences:
Price is respecting triangle support and holding the structure.
Fibonacci retracement shows potential upside continuation.
Momentum is shifting after a prolonged corrective move.
🎯 Fibonacci Upside Targets:
🌟38.2% – $112,876
🌟61.8% – $114,195
🌟100% – $116,329
⚠️ Invalidation / Stop-Loss Zone:
If price breaks below $107,000 – $105,000, the bullish setup is invalidated ❌.
As long as BTC stays inside the triangle and above key support, the squeeze favors a bullish breakout

Quick Bitcoin Daily SMa update - PA getting rejected
As you can se, PA is getting rejected off the 50 SMA ( red)
If this rejection is confirmed, this could create a double Top and may push PA back down to create a Lower Low.
Watch this closely, it could turn if the bulls step in.
Just be Very cautious right now.
oshorter term 4 hour MACD is showing us that MACD did cross above the signal line however, this could turn down quickly as it did over on the left of the chart
Caution is advisable
Bitcoin Daily SMA update- trend line tested and heldThis chart uses the SMA, Simple Moving Average
Red = 50, Blue = 100, Green = 128, Yellow = 200
As expected, PA came down and tested the trend line that has rejected PA since 13 August and has since bounced back up.
We will have to wait and see but this may have created a Higher Low as PA rose and now sits on the 100 as support.
Should PA continue to rise from here, the 50 SMA at 113254 is the line of resistance we Need to cross and test. This would then give is a Higher High.
After that, the next Higher High will be at a price after 119
Should PA get rejected, the 128 SMA is at 108995 and then the previous Low is at 107165
The Daily MACD seems to have Crossed above its signal line
This is "only Just " and so we wait to see where it goes form here but we are certainly looking Bullish in a longer term as Bulls show us they can respond.
The 4 hour BTC PA chart
This chart makes me a little cautious for now, waiting for confirmation of this move higher,
See how that 2nd Green candle after the bounce, came up and got rejected off the 100 SMA and the current candle is having the same problem.
We do seem to have support on the 50 SMA
PA is currently in a tight range above, with the SMA's very tight.
It is easier for PA to Drop from here so today could be a battle.
The 4 hour MACD is also at a point of crossing
The MACD here has NOT yet crossed the signal line and so we wait, watching to see what happens.
The Histogram shows positive momentum.
It should be remembered that we have the USA calling the possibility of Rate cuts this month.
If the FED goes against the grain, this could be damaging and should the FED decide to cut rates, we are off to the races.
This month is Pivotal.
Long term still Bullish, short term undecided..remaining Bullish CAUTIOUS

BTCUSD 1D Bitcoin making new climbing plansAfter the summer correction Bitcoin is once again showing strength.
The chart is shaping a rising channel and the pullback to the 108500 support worked textbook-style.
Moreover, a breakout above 113000 will open the way directly to 125000.
Volume profile supports the buyers’ side while the price action looks like a healthy pause before the next impulse.
Fundamentally the backdrop stays bullish with institutional flows into ETFs and Fed rate cuts still on the table for year-end.
The irony is that while many were waiting for 94k or lower Bitcoin just secured its rope and started climbing higher.

Bitcoin Daily SMA UPDATE This daily chart uses the SMA, Simple Moving Average
Red = 50, Blue = 100, Green = 128, Yellow = 200
PA got rejected yesterday from its rise over the 100 SMA and is currently testing that as support on a Daily chart.
If that fails, we could see PA retreat down to around 108900, where we have the 128 SMA and the descending line of resistance.
This line has not been tested as support yet.
As we can see on the chart, if this rejection continues down past 107165, we will have printed a Lower high, pointing towards continued price drops. with the 200 SMA at 104348
The Daily MACD has reached up to its Signal line
This could also be a point of rejection, keep your eye on this
The 4 Hour BTC PA chart shows us more near term detail
PA is currently testing the 50 as support after getting rejected from the 128 and falling through the 100.
If this fails, we can see PA will bump into the trend line, around 108900 - 108500.
To many extents, this would be a good move providing we then found support and bounced higher as it would create a Higher Low.
The 4 hour MACD
MACD has turned down and heading towards its signal line.
This may offer support but it will continue down Bearish if PA does reach down to the trend line.
Note how the Histogram has descending sharply.
Today we must sit and wait
For me, I think we could see the 109k - 108k area tested at some point over the next few days.
Maybe sooner than later

Bitcoin Daily SMA UPDATE
This daily chart uses the SMA, Simple Moving Average
Red = 50, Blue = 100, Green = 128, Yellow = 200
Yesterday, PA broke through the descending line of resistance it had been under since 13 August.
As yet, this does not mean PA will now rise, though on a daily chart, the MACD certainly has the room to move higher, as seen below
However, given where we are in a traditionaly quiet month, I do still see PA sliding down this line in the bear future...testing it as support
This maybe supported by the fact that the shorter term 4 Hour MACD has Crossed Neutral but the Hitogram is showing White bars and not Green. This shows a weakening and the MACD line moving closer to the red signal line.
The Daily RSI is also turning over but remains above its MA for now
So for now, we see PA has broken over the Daily 100 SMA and is testing as support.
Above, we have the 50 at 113300
This could be the next line of resistance if PA rises now.
Should PA turn down now, we have the 100 SMA at 110762.
Below that , the 128 sits at 108194
To remain above that descending trend line, we need to Range in the area we currently are in and stay above that 100SMA at 110K for at least the next 24 hours
If we look at the Bitcoin 4 hour chart, we see this maybe possible
PA sits in a very tight range between the 50 and the 100 4 hour SMA and is currently sitting on the VRVP Point of control ( red dotted line )
This is all support but we have to wait and see if it remains so.
There is Very little action trading right now...we just waiting.

Bitcoin Monthly Candle Colour closes since 2013 - August Close
August closed RED and so now we have 10 red closes to 5 Green.
This has closed the possibility of continuing the pattern we had been following.
The Dashed line Boxes show us The only 2 occasions where we have had a Green December, Red January, Red February, Green March, Green April.
Then we had a Green May 2012 and a Red May 2020
Then both repeated a Green June, Green July.
They both also had had Green August but we just closed Red.
This breaks this sequence for me but I will keep the boxes in place for now just incase we revert back to Sequence.
The horizontal arrows are pointing to the previous 9 Red August Closes.
Where you see 2 Arrows is where this was followed by a Green September. This happened 4 times.
Note those double arrows on the left are in the 2016 build up to 2017 ATH and the ones on the right are in the Current cycle.
September Candle close count is currently is 5 Green to 9 Red, the same as August was.
Of those 5 Green September closes, 4 were after a Red August.
The other Green September was in the 2020 run up to the March 2021 ATH ( Middle dashed box)
Odds are on for a Red September as we see Bitcoin falling below some serious support levels but we should also note how PA is remaining above the 100k line for now.
August and September are traditionally months of Holidays and so trading slows, hence the majority of Red candles
Q4 is the ones to wait for and as you can see from the colour counts, Q4 is usually Bullish
We wait - we Hold and if PA Drops to the possible 104K line where the 200 day SMA sits, I will Buy More.
Scale in

Bitcoin testing 116k zoneIf we are successful in breaking above the 116k zone resistance. Bitcoin will pump hard to 120k and 123k next. As the high time frame trend continues to stay uptrend. Let's see if bitcoin breaks it now or has some other plans.
Stay tuned!

BTC/USDT Analysis. Testing a key low
Hello everyone! This is CryptoRobotics trader-analyst with the daily market analysis.
Yesterday, a strong market seller emerged in Bitcoin, pushing the price lower. The local zone at ~$112,000 (abnormal cluster) provided only minimal reaction.
At the moment, we have already tested the local low. Now we need to wait for a buyer’s response. If strong activity appears, the main upside potential is towards $114,400–$115,500 (volume zone). If there is no reaction, the first downside target is around $107,000.
We have updated the global buying zone on the daily chart, now defined as $108,000–$102,500. As long as the price does not consolidate below this range, the broader trend can still be considered bullish.
Buy zones:
$108,000–$102,500 (accumulated volumes).
Sell zones:
$112,400–$113,300 (local volume zone),
$114,400–$115,500 (volume zone),
~$116,500 (volume anomaly),
$117,200–$119,000 (accumulated volumes),
$121,200–$122,200 (buying absorption).
This publication does not constitute financial advice.
BITCOIN Bearish Breakout!
HI,Traders !
#BITCOIN made an epic
Bearish breakout of a very
Strong key horizontal level
Of 112340.5which is now a
Resistance and the breakout
Is confirmed so we are
Bearish biased and we will
Be expecting a further
Bearish move down !
Comment and subscribe to help us grow !

Bitcoin buy Soon as soon possibleBitcoin buy Soon as soon possible
The live Bitcoin price today is $111497.14 USD with a 24-hour trading volume of $64109128491.21 USD. We update our BTC to USD price in real-time.

Bitcoin Halts Declines Around the $111,000 ZoneThe last few trading sessions have been particularly challenging for Bitcoin’s bullish momentum in the short term, mainly because two sessions ago the price dropped by more than 6%. This pullback was driven by profit-taking, following Powell’s comments at Jackson Hole, which had sparked a brief surge in confidence toward the end of last week. However, the current scenario is different: after this sharp drop, a highly neutral sentiment has emerged on the chart, as the market continues to assess how a lower interest rate environment could impact Bitcoin demand in the coming weeks.
For now, the Crypto Fear & Greed Index remains in neutral territory, standing at 43 points, right on the threshold where a new “fear” phase could start to develop in the sentiment indicator. As long as uncertainty persists in the short term, it is likely that neutrality will continue to dominate movements in the sessions ahead.
A Significant Bearish Move Emerges
Bitcoin’s price had managed to sustain an uptrend from early April until mid-August. However, at that point a relevant bearish bias began to surface, consistently breaking through the prevailing uptrend line and putting at risk the bullish momentum that had supported the chart. Now, the predominance of selling pressure in the short term raises the risk of triggering a move that could give way to a more consistent downtrend in the coming sessions.
RSI: the RSI line has slipped slightly below the neutral 50 level, reflecting that selling momentum has started to dominate in the short term. If this pattern persists, bearish pressure could intensify in the upcoming sessions.
MACD: the MACD histogram also shows a bearish bias, as it remains below the 0 line. This indicates that the average of recent moving averages has shifted into negative territory, reinforcing the outlook for the continuation of the current correction.
Key Levels to Watch:
$122,000 – Historical High Zone: the main barrier for bullish moves. A sustained return to this level could reactivate the uptrend line that has recently been broken.
$113,000 – Immediate Resistance: corresponds to the 23.6% Fibonacci retracement and acts as the nearest barrier in the short term. A breakout above this level would end the current bearish bias and could pave the way for a more neutral scenario.
$106,000 – Definitive Support: aligns with the 100-period moving average. A break below this level would imply a deeper change in market structure, opening the door to a more solid bearish trend in the short term.
Written by Julian Pineda, CFA – Market Analyst

Bitcoin bouncing off the 100 Day SMA- Repeat as last time ?
The chaar says it alp
Arrow points to 100 day SMA. We gt a bounce to ATH last time......
Will we repeat ?
I doubt it but we may get back over some levels...
Time will tell
Bitcoin - The magical $1.000.000 level!🚀Bitcoin ( CRYPTO:BTCUSD ) is not done yet:
🔎Analysis summary:
Over the course of the past couple of months, we have been witnessing a bullish continuation on Bitcoin. After the all time high breakout, there is a high chance that this bullrun will continue and Bitcoin might even retest the resistance trendline at seven digits in the near future.
📝Levels to watch:
$1.000.000
SwingTraderPhil
SwingTrading.Simplified. | Investing.Simplified. | #LONGTERMVISION

Bitcoin possible correction?📈 Hey Traders!
Here’s a fresh outlook from my trading desk. If you’ve been following me for a while, you already know my approach:
🧩 I trade Supply & Demand zones using Heikin Ashi chart on the 4H timeframe.
🧠 I keep it mechanical and clean — no messy charts, no guessing games.
❌ No trendlines, no fixed sessions, no patterns, no indicator overload.
❌ No overanalyzing market structure or imbalances.
❌ No scalping, and no need to be glued to the screen.
✅ I trade exclusively with limit orders, so it’s more of a set-and-forget style.
✅ This means more freedom, less screen time, and a focus on quality setups.
✅ Just a simplified, structured plan and a calm mindset.
💬 Let’s Talk:
💡Do you trade supply & demand too ?
💡What’s your go-to timeframe ?
💡Ever tried Heikin Ashi ?
📩 Got questions about my strategy or setup? Drop them below — ask me anything, I’m here to share.
Let’s grow together and keep it simple. 👊
BTCUSDT H1 MARKET UPDATE A Clear Setup Bearish Signal
Bitcoin Sell From Bearish FVG Box
Bitcoin Sell From Bearish Order Block
Bitcoin Sell From Bearish FVG Box
Bitcoin Sell From Bearish Engulfing
Manage Your Trade Properly Follow Us For More trades

Can the Thief Rob BTC Pullback Before the Police Arrive?🚨 BTC/USD 💰 Bitcoin Breakout Heist Plan – Robbers in Action 🚀 🚨
Asset: BTC/USD “Bitcoin vs U.S. Dollar” — Crypto King Market
📊 Plan: BULLISH BREAKOUT RAID
🎯 Target: 123,000.00 🎯 — Police Barricade Resistance + Overbought Trap Zone
🔒 Entry: ANY PRICE LEVEL — Thief avg pullback entry at 115,000.00
🛑 Stop Loss: 113,000.00 — Below the Laser Tripwire
🎩 Thief Entry Blueprint 🕵️♂️
The vault’s trembling. The thief’s not waiting.
Layered limit orders are being deployed like smoke bombs — we strike anywhere, anytime, with stealthy precision. No begging for dip, we rob it raw. 💣🧨
📉 Risk Protocol Setup 🛡️
SL: Under local support – cut fast if alarms trigger.
Risk light, rob heavy. Use tight stops or trailing guards to escape with the loot.
📈 Why Rob Long?
Bullish momentum building like a pressure cooker 💥
Resistance zones turning into trapdoors for late bears 🐻
Liquidity pools above — ripe for raid
Sentiment flips, on-chain signals, and macro tailwinds align ⚡
📌 Robbery Reminders:
NO SHORTING — This is a one-way heist 🚷
Avoid news-time chaos ⛔
Use multiple entries (layer style) and escape plans.
Overbought ≠ exit — it’s the bait for the next raid 🧠
💖 LIKE = SUPPORT THE CREW
Every like boosts the Thief Trader movement — more heat, more setups, more wins.
Smash Boost. Share the Heist. Stay Robbing. 🐱👤📈🔥
🔔 Stay tuned. Next breakout blueprint dropping soon.
Bitcoin Market Loot Plan Activated — Watch It Climb!🔥🚨 THIEF TRADER’S ULTIMATE BTC/USD HEIST PLAN! 🚨🔥
Asset: BTC/USD "Bitcoin vs U.S. Dollar" – Crypto Market Robbery in Progress!
Plan: BULLISH HEIST – LAYERED ENTRY MASTERMINDED!
🎯 THIEF’S ENTRY STRATEGY (LAYERED LIMIT ORDERS):
"The vault is unlocked! Swipe the loot at ANY PRICE! But for elite thieves, use LAYERED LIMITS like a PRO!"
Buy Limits (Example):
🔹 122,000.00 (First Dip Grab!)
🔹 120,500.00 (Second Layer – More Stealth!)
🔹 121,500.00 (Third Strike – Smooth Criminal!)
🔸 121,000.00 (Final Trap – Max Loot!)
👉 Adjust layers based on YOUR risk appetite! More layers = More escape routes!
🛑 THIEF STOP LOSS (OG STYLE):
"SL? Yeah, we have one… but REAL THIEVES adjust on the fly!"
🔪 SL @ 117,500.00 (If Bitcoin snitches, CUT & RUN!)
⚠️ Pro Tip: Tighten SL if market flips bearish! Don’t get caught!
💰 TARGET: ESCAPE BEFORE THE COPS ARRIVE! 🚔
🎯 130,000.00 (Final Heist Zone – Police Barricade!)
🏃♂️ 129,000.00 (Early Exit? Smart Thieves Take Profit & DISAPPEAR!)
⚡ THIEF TRADER’S GOLDEN RULES:
✔ SCALPERS: Only LONG side! Quick in, Quick out!
✔ SWING THIEVES: Hold & Trailing SL for MAX LOOT!
✔ RISK? Your wallet, Your rules! Don’t blame the plan!
📢 THIEF ALERT! NEWS = VOLATILITY TRAP!
🚨 Avoid new trades during high-impact news!
🚨 Lock profits with TRAILING SL!
💥 BOOST THIS HEIST PLAN! (More boosts = More stolen money!💰)
🔥 LIKE, SHARE, & FOLLOW FOR NEXT HEIST! Stay stealthy, thieves! 🏴☠️🚀
🚀 SEE YOU AT THE NEXT CRYPTO ROBBERY! 🚀
#ThiefTrader #BitcoinHeist #LayeredEntries #CryptoGang

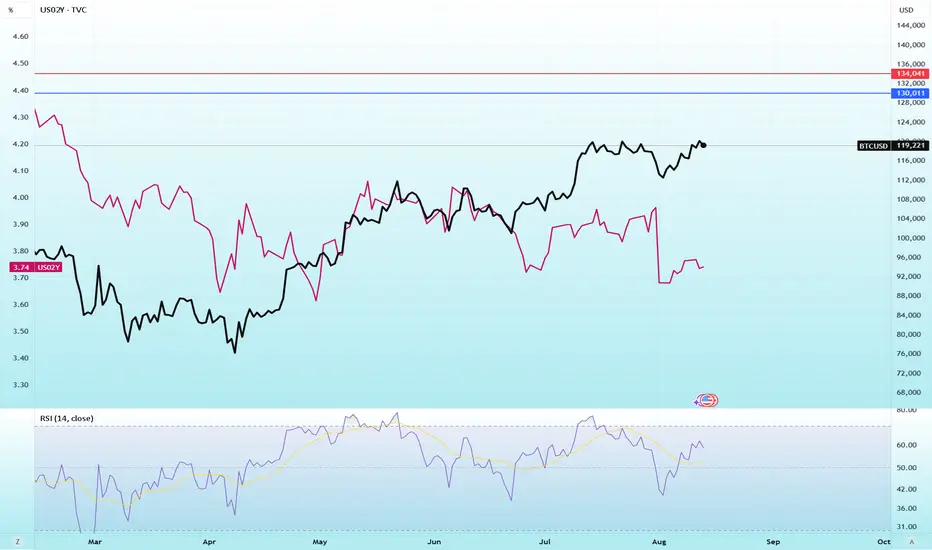
Declining 2-Year US Treasury Yields Could Fuel Bitcoin’s BullishThe follow chart is a comparison between Bitcoin CRYPTOCAP:BTC Daily Chart and the US 2 years Treasury Bonds TVC:US02Y .
The graphic shows the 2-year US Treasury yield declining from 3.7684% to 3.7308% on August 12, 2025, following a steep drop after CPI inflation in July stabilized at 2.7%. This underscores market expectations that the Federal Reserve will lower interest rates, driving up demand for bonds as a safe haven asset.
The potential on Short-Term Impact on the Bitcoin Market:
Positive: Falling rates and expectations for rate cuts weaken the US dollar, boosting capital flows into riskier assets such as Bitcoin. BTC may gain in the immediate term, testing the $130,000 resistance level, aided by new liquidity from stablecoins.
Risk: While falling yields can support Bitcoin’s bullish momentum, they may also signal recession fears. If investors interpret the decline as a warning of economic slowdown, BTC could face selling pressure—potentially dropping to $111,939. Volatility remains elevated, especially after the recent liquidation of leveraged long positions. Keep an eye on upcoming economic data for confirmation of market direction.
Bitcoin Soars Past $122K, But a "Digital Fort Knox" Threat LoomsThe cryptocurrency market is in the throes of a historic rally, a tidal wave of capital and confidence that has propelled Bitcoin beyond the formidable $122,000 mark. Now trading within 1% of its all-time high, the world’s premier digital asset is riding a powerful current shaped by two monumental events: a surprisingly favorable executive order from the White House and a relentless cascade of inflows into spot Bitcoin ETFs. This surge has ignited euphoria across the financial world, with even the second-largest cryptocurrency, Ether, touching highs not seen since its 2021 peak.
Yet, beneath the glittering surface of this bull run, a profound and unsettling question is taking shape. As institutional giants and corporate treasuries embrace Bitcoin, some of its most astute observers are sounding an alarm. They warn that this corporate adoption boom is creating a path that looks eerily similar to the one gold traveled in the 20th century—a path that ended with its effective nationalization and centralization in the vaults of Fort Knox. This growing concern posits that Bitcoin’s greatest triumph, its integration into the mainstream financial system, could become its ultimate vulnerability, presenting a new and potent centralization threat that challenges the asset's very soul. The market is now caught between the thrill of unprecedented price discovery and the chilling possibility that it is witnessing the rise of a digital Fort Knox.
The Anatomy of a Rally: A Perfect Bullish Storm
The recent price explosion was not a random event but the result of a powerful confluence of factors that have systematically validated Bitcoin’s role in the global financial landscape. The market sentiment has been overwhelmingly positive, driven by a one-two punch of regulatory encouragement and undeniable institutional demand.
First, a landmark executive order from the White House sent a clear signal that the United States is moving towards a framework of integration rather than opposition for digital assets. The order, widely seen as pro-crypto, has initiated a formal exploration of how to safely incorporate cryptocurrencies into the bedrock of American wealth: 401(k) retirement plans. For years, regulatory uncertainty has been the single greatest barrier holding back a true institutional deluge. This directive acts as a powerful de-risking event, providing a level of clarity and legitimacy that large-scale investors have been desperately seeking. The potential to unlock even a small fraction of the trillions of dollars held in retirement accounts has sent a jolt of optimism through the market, assuring corporations and funds that they are investing in an asset class with a government-acknowledged future.
Second, while the executive order provided the strategic tailwind, the tactical buying pressure has come directly from spot Bitcoin ETFs. These regulated financial products, which allow investors to gain exposure to Bitcoin through a traditional brokerage account, have been an unprecedented success. In a stunning display of demand over the last week, these funds have absorbed hundreds of millions of dollars in net inflows on consecutive days. To issue new shares, these ETFs must purchase the underlying Bitcoin from the open market, creating a massive and constant source of demand. This dynamic acts like a supply shock; as billions of dollars from mainstream investors flow through ETFs to chase a finite number of available coins, the price is algorithmically forced upward. The flow of funds into these products has become one of the most closely watched metrics, serving as a real-time indicator of institutional appetite and a direct driver of price action.
The Ghost of Gold: A Historical Warning for a Digital Age
Even as investors celebrate this new era of institutional acceptance, a chilling historical parallel offers a cautionary tale. The concern, articulated by prominent on-chain analysts, is that Bitcoin’s current trajectory is mirroring the centralization of gold that occurred in the United States, a process that ultimately subjected the precious metal to complete state control.
To grasp the gravity of this comparison, one must look back to President Franklin D. Roosevelt's Executive Order 6102, signed in 1933. Amidst the Great Depression, the order made it illegal for U.S. citizens to privately hold significant amounts of gold coins or bullion, compelling them to turn over their holdings to the Federal Reserve. The stated goal was to stabilize the economy, but the result was the mass transfer of a decentralized monetary asset from the hands of the people into the centralized vaults of the U.S. government. The nation's gold was consolidated, most famously at Fort Knox, giving the state absolute control over the physical supply.
Decades later, in 1971, President Richard Nixon delivered the final blow. With the "Nixon Shock," he unilaterally severed the U.S. dollar's convertibility to gold, effectively ending the Bretton Woods system that had anchored global finance. Having already secured control of the physical asset, the government was then free to change the rules of the system it underpinned.
The argument today is that Bitcoin could face a similar, albeit modern, fate. A 21st-century "nationalization" would not involve government agents seizing hardware wallets. It would be a far more sophisticated and systemic takeover, executed through the very financial instruments and institutions that are currently being praised for driving the bull market. The end result could be a scenario where a significant portion of the Bitcoin supply, while technically on a decentralized network, is effectively controlled by a handful of state-sanctioned entities.
This digital "Fort Knox" could be constructed through several vectors. The majority of Bitcoin purchased by ETFs and large corporations is not held in self-custody. Instead, it is entrusted to a small number of large, regulated custodians. These firms represent centralized points of control. A government could easily exert legal and regulatory pressure on these few custodians, compelling them to freeze, block, or even seize the assets they manage on behalf of millions of investors.
The ETFs themselves are a primary vehicle for this potential centralization. By concentrating hundreds of thousands of Bitcoin under the management of a few powerful financial firms like BlackRock and Fidelity, they make the asset supply vastly easier to regulate and control. It is far more efficient for a state to influence a handful of ETF issuers than to police millions of individual Bitcoin holders around the world.
Finally, the public companies that have famously added Bitcoin to their balance sheets are also part of this equation. As regulated entities, they must comply with government mandates. A state could enact policies that influence or dictate how these systemically important corporate treasuries are managed, effectively bringing them under state influence without ever formally seizing the assets.
Bitcoin’s Inherent Defense: Can Decentralization Hold the Line?
While the historical parallel to gold is compelling and sobering, it is not a perfect one. Bitcoin possesses unique technological attributes that provide a powerful defense against the kind of centralization that befell gold.
The most fundamental defense is the power of self-custody. Unlike gold, which is a physical object that is cumbersome to store and move securely, Bitcoin is pure information. An individual or entity that controls their own private keys holds a sovereign asset that is incredibly difficult to confiscate without their cooperation. This ability to "be your own bank" remains a powerful counter-force to the trend of custodial reliance.
Furthermore, the Bitcoin network is a globally distributed system. Miners, nodes, developers, and users are spread across dozens of countries, operating under a multitude of legal jurisdictions. No single government can unilaterally control the network or dictate its rules. An attempt by one major nation to implement draconian controls would likely trigger a mass exodus of capital and talent to more favorable jurisdictions, a powerful economic disincentive against overreach. The current global competition among nations to become "crypto hubs" demonstrates that governments are aware of this dynamic and are incentivized to create attractive, rather than punitive, regulatory environments.
This tension may ultimately lead to the bifurcation of the Bitcoin market. One tier could consist of the regulated, "paper" Bitcoin—held in ETFs and by public corporations, fully compliant, but subject to the rules and potential control of the traditional financial system. The other tier would be the sovereign, "physical" Bitcoin—held in self-custody by those who prioritize censorship resistance and decentralization above all else.
A Future Forged in Conflict
As Bitcoin knocks on the door of a new all-time high, the market is caught in a powerful paradox. The institutional adoption that has legitimized Bitcoin and driven its price to stratospheric levels is the very same force that introduces a systemic risk to its core principles. The celebration of the current rally is, in essence, a celebration of the construction of the very infrastructure that could be used to co-opt it.
The journey to $122,000 was paved with institutional capital and regulatory acceptance. The journey forward will be defined by a fundamental conflict: the battle between mainstream financial integration and the preservation of the decentralized ethos that made Bitcoin a revolutionary technology. The future of the world's most important digital asset will be forged in the crucible of this tension, determining whether it remains a truly sovereign asset for the people or becomes another tool in the arsenal of the centralized systems it was designed to disrupt.
