Bitcoin BTC: VWAP Extension, Three-Drive Pattern, & Trade Plan📊 Bitcoin (BTC) continues to hold a strong bullish trend, but in my view it is now overextended as we head into the end of the week ⚡.
🔎 In the video, I break down how BTC is currently trading two deviations above VWAP, highlighting its stretched positioning. We also discuss the three-drive pattern, which often precedes a correction — particularly when combined with a VWAP extension and end-of-week institutional activity as larger players wind down their trades 🏦.
📈 With that in mind, I’m anticipating a retracement. If price pulls back into support and then confirms with a bullish break of structure, I’ll be looking for a long opportunity 🎯.
⚠️ Disclaimer: This analysis is for educational purposes only and not financial advice. Always trade responsibly and manage risk carefully.
Bitcoinprediction

Bitcoin : Stay heavy on positionsBitcoin : Stay heavy on positions (2x~3x)
Maintaining the same outlook as before.
** This analysis is based solely on the quantification of crowd psychology.
It does not incorporate price action, trading volume, or macroeconomic indicators.

BITCOIN Risky Short!
HI,Traders !
#BITCOIN grew up fast
But then hit a horizontal
Resistance level of 117678.7
From where we are already
Seeing a nice pullback
And we will be expecting
A further local move down !
Comment and subscribe to help us grow !

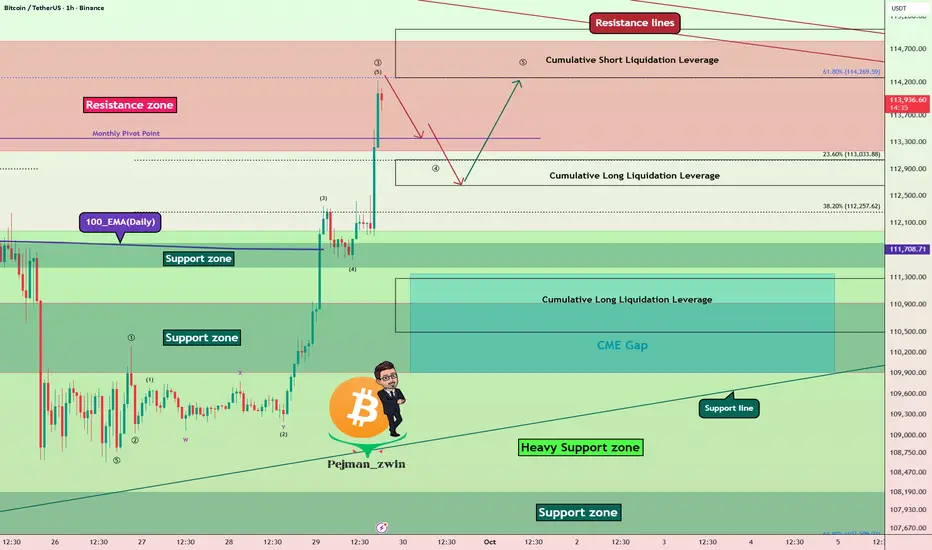
Bitcoin Resistance Zone Battle – ATH or Fakeout?Bitcoin ( BINANCE:BTCUSDT ) has shown strong momentum over the past 5 days , liquidating many traders in both Long and Short positions .
Bitcoin has now entered the Resistance zone($114,820-$113,170) and is moving near the Cumulative Short Liquidation Leverage($115,000-$114,272) and Resistance lines .
From an Elliott Wave Theory perspective, given Bitcoin’s strong bullish momentum over the past 24 hours, it appears to be completing Wave 3. This Wave 3 seems to be of the extended type.
I expect Bitcoin , after a correction , to make another attempt toward the Resistance zone($114,820-$113,170) and potentially test the Resistance lines .
Do you think this bullish move could lead to a new all-time high (ATH) for Bitcoin?
Cumulative Long Liquidation Leverage($113,037-$112,650) + Near Monthly Pivot Point($113,356): An area where Bitcoin could start rising again (if there is a correction, of course).
Cumulative Long Liquidation Leverage: $111,100-$110,500
CME Gap: $111,355-$109,915
Note: Also, Bitcoin approaching the 61.8% golden Fibonacci level could lead to a Bitcoin correction.
Please respect each other's ideas and express them politely if you agree or disagree.
Bitcoin Analysis (BTCUSDT), 1-hour time frame.
Be sure to follow the updated ideas.
Do not forget to put a Stop loss for your positions (For every position you want to open).
Please follow your strategy and updates; this is just my Idea, and I will gladly see your ideas in this post.
Please do not forget the ✅' like'✅ button 🙏😊 & Share it with your friends; thanks, and Trade safe.
BITCOIN SIGNAL: HUGE MOVE IN DIRECTION NOBODY EXPECTED INCOMING!Yello Paradisers! Let me know your thoughts in the comment section below!
And Paradisers! Keep in mind to trade only with a proper professional trading strategy. Wait for confirmations. Play with tactics. This is the only way you can be long-term profitable.
Remember, don’t trade without confirmations. Wait for them before creating a trade. Be disciplined, patient, and emotionally controlled. Only trade the highest probability setups with the greatest risk to reward ratio. This will ensure that you become a long-term profitable professional trader.
Don't be a gambler. Don't try to get rich quick. Make sure that your trading is professionally based on proper strategies and trade tactics.

BTC/USDT ; Is the shedding over?Hello friends
Due to the price correction we had, the price has bounced back into a good support area where there were many buy orders and has reacted well.
Now it remains to be seen whether it will succeed in defeating the trading pain or not.
If buyers continue to support the price, it could break the range and move towards the specified targets.
*Trade safely with us*

WHAT IF.. $BITCOIN holds? New ATH incomingHey again traders!
BTC is leaving no man alive. What everybody thinks about the 107K level ( masive bearish breakout) was invalidated by a bullish breakout to 114K.
The sad part? We are in a bearish channel.
The good one? If we hold 110K - 112K there is a high probabilty that 117K - ATH will come on the upcoming weeks.
Have to be mentioned that we are entering in Q4 historically the most bullsh Q for markets!

Bitcoin Price Eyes $120,000 as Seller Exhaustion Sets InBitcoin is trading at $116,502, attempting to hold $115,000 as a new support level. Securing this area is vital as the cryptocurrency also works to break out of the two-month downtrend that has capped its upward momentum since midsummer.
If conditions improve, Bitcoin could rally beyond $117,261. Breaching this level would open the door to $120,000. This would reinforce optimism among traders and institutions anticipating further growth in the crypto king’s valuation.
However, failure to maintain current levels would invalidate the bullish outlook. Bitcoin could fall back to $112,500 or even $110,000, extending the bear run. Such a move would dampen sentiment, signaling renewed vulnerability in the world’s largest cryptocurrency.

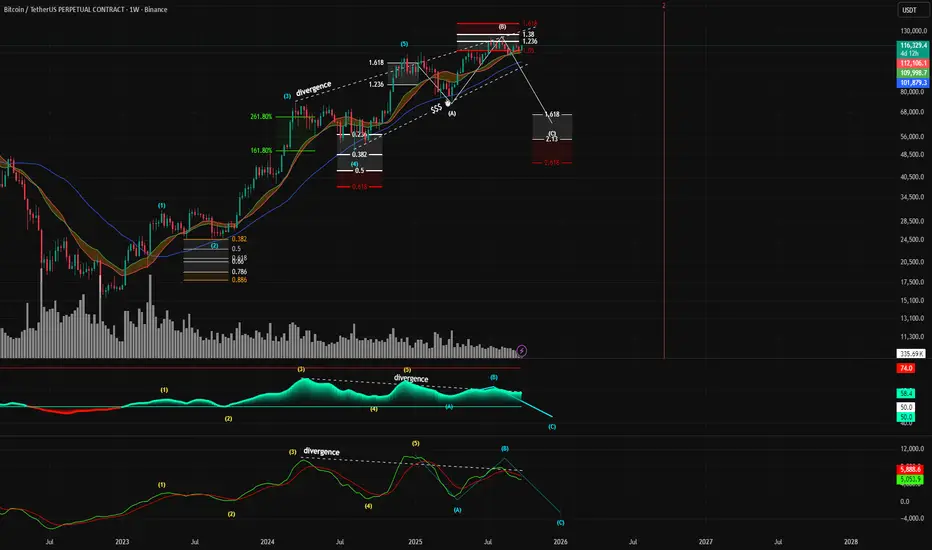
Expanding Flat Elliot wave countBitcoin may be approaching a significant macro top, with multiple technical indicators aligning to signal a potential reversal and a subsequent major corrective wave.
Key Projections:
Potential Top Formation: The current price action is forming what appears to be the peak of a corrective Wave (B), with a potential top range between $109,000 and $150,000.
Projected Corrective Target: Following the completion of Wave (B), a significant downward move, labeled as Wave (C), is anticipated. This corrective wave targets the $45,000 - $67,000 price zone.
Timeline: The entire corrective structure, from the formation of the top to the potential bottom of Wave (C), is projected to unfold by approximately September 2026.
Elliott Wave Structure: The primary thesis is based on an Elliott Wave count. The chart indicates the completion of a five-wave impulse cycle, and the market is now in a larger A-B-C corrective pattern. The current price is likely forming the peak of the B-wave.
Fibonacci Confluence: There is a strong confluence of Fibonacci extension levels at the potential top. The peak of the current Wave (B) is precisely testing the 1.618 Fibonacci extension level, a critical ratio often associated with the termination of corrective waves.
Significant Bearish Divergence (Crucial Point): This is one of the most compelling signals on the chart.While the price is making higher highs (from the peak of wave (5) to the peak of wave (B)).Both the RSI and the MACD indicators are showing lower highs. This is a classic, multi-indicator bearish divergence on a high timeframe (weekly), indicating that the upward momentum is weakening significantly and a trend reversal is becoming more likely.
BTC Analysis: Support, Market Structure & My Trade Plan📊 Bitcoin (BTC) has been rallying strongly and remains in a clear bullish trend 🚀.
🔎 At this stage, I’m watching for price to pull back into support. If BTC can hold that level and then confirm with a bullish break of market structure on the 30-minute chart ⏱️, it would provide a potential long entry setup 🎯.
📈 The broader momentum remains bullish, so I’ll be patient and wait for confirmation before getting involved.
⚠️ Disclaimer: This analysis is for educational purposes only and not financial advice. Always trade with proper risk management.

BTC Still IN GREEN ZONE - UPDATE 01-10-2025BTC/USDT Update
✅ Bitcoin has reclaimed the low time frame zone, showing renewed strength after the recent dip.
📊 As long as BTC continues holding above $113.6K support, the short-term trend remains bullish.
🚀 The next target sits around the $116K zone, where resistance could be tested in the coming sessions.
🔑 The main trend remains far below, meaning the broader structure is still secured and positive.
📌 Summary:
BTC is holding strong above the low time frame support, with momentum building toward the $116K target zone. Holding this structure keeps the outlook bullish.

Bitcoin Approaching $114,500 Resistance, Breakout OR Rejected?At $114,500, the price of Bitcoin is currently getting close to the Classic Resistance level. As a result, there are several situations to think about. According to the Bull Case, the price of Bitcoin may continue its short-term upward trend if it breaks out of $114,500 with strong volume support. Nonetheless, there is still a chance that the price of Bitcoin will continue to drop to at least the $112,700 region if it can sustain trade and refuses the $114,500 region.

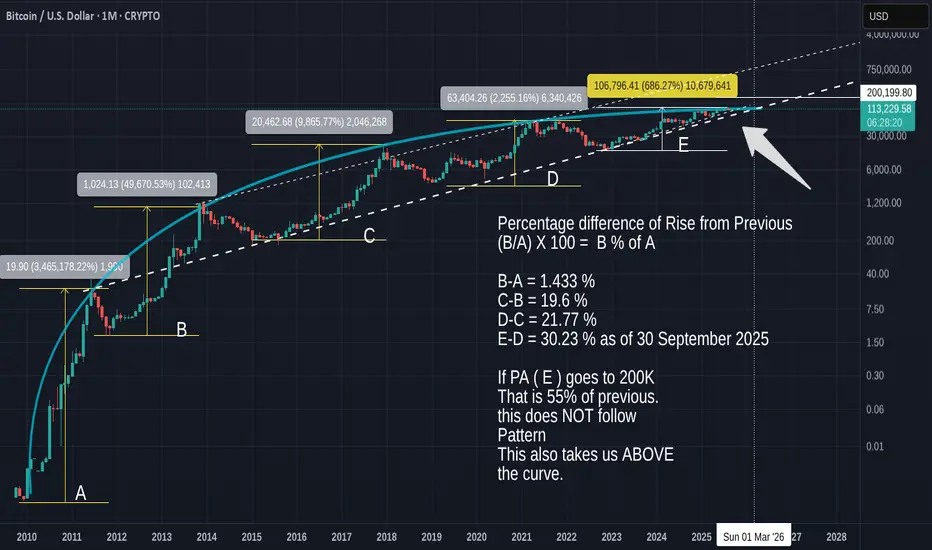
This BTC cycle has a higher % increase in PA than previous cycle
Many people are moaning about how Calm and Lazy Bitcoin is this cycle, all waiting for that mad parabolic push higher to ATH
And it may happen again, though I doubt it.
But as this post shows you, we have had already, a higher % increase over previous cycles
So, what is The % of increase over the previous cycles. Or, How much of the previous increase from Low to ATH was this cycle, in %. The same would be 100%, Half would be 50%
If you refer to the main chart for the letters.
(B/A) X 100 = B % of A
B-A = 1.433 % - The Rose from the Low to the Next ATH was only 1.4% of the previous increase.
C-B = 19.6 %
D-C = 21.77 %
E-D = 30.23 % as of 30 September 2025. A Larger increase that previously.
If PA ( E ) goes to 200K This cycle as many expect, That is 55% of previous increase.
This does NOT follow the last 2 [previous pushes that are in the long term channel of near 20 % on average.
This also takes us ABOVE the curve.
THE CURVE ( Blue) is a part of a Fibonacci spiral that has rejected every ATH since BTC began.
PA needs to rise above this Curve, as you can see, or we get pushed back down.
This Zoomed in Image of the same main monthly chart show this ckearly
PA has been trying to escape this Arc for a Long time now and is struggling a little but with the Strong line of support below, that has NEVER broken, we should be able to cross over and remain above this Arc.
We have till December 2025 before that arc begin to push PA back down in a negative Arc
I have explained in previous posts about this idea but here is the chart
So, the % increase of previous pushes WILL rise further
It has to
$BTC Wyckoff DistributionPreliminary supply, or PSY:
Occurs when significant interests start to sell lots of shares following a sharp upward trend. Volume increases and the price spread widens, indicating the possibility of a trend change.
BC:
buying climax, characterized by frequently significant rises in volume and price spread. The intensity of purchasing peaks, with professional interests filling heavy or urgent public demand at prices close to their peak. Since large operators require enormous public demand to sell their shares without reducing the stock price, a BC frequently occurs in conjunction with excellent earnings reports or other positive news.
AR:
Automatic reaction. After the BC, the strong buying significantly decreased, but the heavy supply persisted, and an AR occurred. The lower border of the distribution TR is defined in part by the selloff's low.
ST:
Stands for the secondary test, in which the price returns to the BC region to evaluate the demand/supply situation at the current price levels. Supply must exceed demand for a top to be confirmed, so volume and spread should decline as the price moves closer to BC's resistance zone. An ST could appear as an upthrust (UT), in which case the price goes above the resistance indicated by the BC and perhaps other STs before abruptly reversing to close below resistance. Price frequently tests the TR's lower boundary after a UT.
SOW—sign of weakness:
A downtrend to (or just barely past) the TR's lower border, typically accompanied by an increase in spread and volume, is an indication of weakness (SOW). The AR and the initial SOW(s) point to a shift in the stock's price movement, with supply now in control.
Last point of supply, or LPSY:
A weak rally on a tight spread following a test of support on a SOW indicates that the market is having significant difficulties advancing. Strong supply, low demand, or both may be to blame for this market's inability to recover. Before markdowns start in earnest, LPSYs signify the end of the demand cycle and the final distribution waves from large operators.

The end of Bitcoin…. begins in 40 days time @ ~$160k in Oct 2025** What the next 12 months will look like **
Let’s just start with a strong provocative title to raise the blood pressure.. “The end of Bitcoin”
…. with an explosion and then a slow erosion of relevance, that’s how.
Whether it withers through regulation, succumbs to its own technological limits, or is simply eclipsed by something faster, greener, and more useful, the end of Bitcoin will be a quiet fading of a once radical idea into the background hum of history over the next 12 years.
Can already feel the calls for his head. Take a breath, unclinch your fits, consider the possibility for a moment.
For years Bitcoin stood as a monument to a digital rebellion, a currency without borders or masters promising freedom from central banks and governments alike. Yet the freedom that was marvelled on Bitcoin’s launch was equally celebrated on its loss the day the ETF was active. A currency available to all they chanted, now controlled by the few. The irony.
Diminishing returns
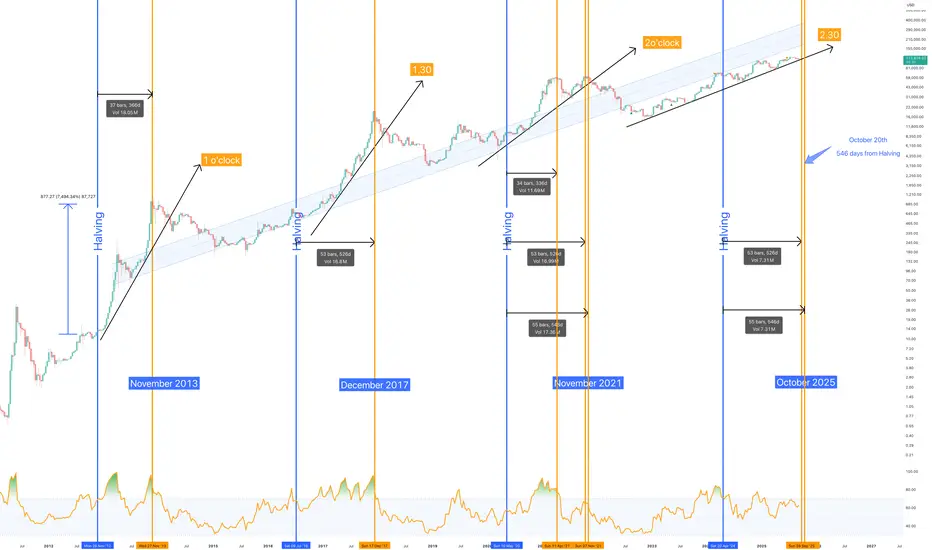
The bitcoin Halving cycles are a great place to start on the story of “How Bitcoin ends”. Bitcoin maximalists will themselves acknowledge this technical observation, post cycle returns are not only diminishing but on the road to disappear forever. It is the reason we've seen 2010-2012 wallets unload on the market those past 2 months. They know.
On the above 2 week chart it is fairly evident the momentum of each cycle is losing steam as the line of support rotates another hour of the clock face for every two cycles. The next halving cycle will complete at 3 o’clock with no measurable return from the 2025 cycle top. Consider that as the talking heads call for $1m+ by 2030.
The influencers and 40 days
Have you noticed influencers talk about the amazing things quarter 4 will bring? “October through December to mint millionaires!” The cringe.
At the height of every market top we see the same smoke and mirrors, “New paradigm” shift mantra. Every other day a new News article on crypto, ft.com is full of them. All red flags as the market top grows closer. Although euphoria is still to return, the time until the top is deterministic.
There’s never been a market top post halving (vertical blue lines) greater than 546 days (vertical orange lines). This value also includes the +/- 5 days price trades at the peak. The last two cycles (2017 and 2021) took 526 days to reach the peak. 2021 gave traders an additional 20 days to exit at the peak. Few accepted while the rest signed up for the 2 year bag holding challenge.
The market top is now between September 28th to October 20th, at most 40 days away from today, if you’re reading this on September 10th, 2025. Yes, perhaps this time will be different, however there’s now 3 out of 4 cycles with less than 546 days (at max) until the cycle top, and the Bitcoin bull market is approaching that value fast. Is this time really going to be different? Influencers certainly think so.
PS: Notice the monthly reduction in market peaks? 2017 = December, 2021 = November, 2025 = October!
40 days / October 20th to $160k - Seriously?
Historical halving to market peaks
2012 Halving: +9,300% to $1,150 in November 2013
2016 Halving: +2,930% to $19,700 in December 2017
2020 Halving: +702% to $69,000 in November 2021
Lower limit
*** 2024 Halving: +160% to $160k in October 2025 ***
Upper limt
*** 2024 Halving: +180% to $180k in October 2025 ***
There’s a whole host of reasons or should I say confluence for this price action forecast too numerous to go into detail. However here’s a couple of standout reasons:
Reason 1
Each new cycle’s return is roughly ~25–30% of the prior cycle’s return. This means the halving to peak return is compressing by a fairly consistent factor in each cycle, close to a “quartering” effect. For this reason the 2025 market top falls between $160k to $180k.
It would also mean the end of Bitcoin as the next cycle peak would be a macro lower high. Consider a cycle 5 (2028 halving) with ~25% of Cycle 4’s return: 25% × 170% ≈ 40–45% return from the 2028 halving to its peak.
A market correction beginning in October 2025 for a new bear market would not be over until the $40-50k area. A 40% return in cycle 5 peaks out at $70k after the 2028 halving, a macro lower high! Remember talking heads are calling for $1m and beyond 2 years later.
If that becomes true, Bitcoin has entered a confirmed macro multi year bear market. A bear market just as long as the bull market from 2010. Such a bear market would not see price action arrested until around $6k in 2039! A long way from Michael Saylor’s $13 million per coin in 2045.
Welcome to the Ponzi scheme.
Reason 2
The Fibonacci 1.618 extension has been an excellent marker for the cycle top, as were previous extensions in previous cycle tops. The market will always react to Fibonacci extensions regardless. Even if you believe Bitcoin will continue to print higher highs and 2026 is going to a very green year for price action.. you must accept price action will react strongly with those extensions, it always has.
But there’s more…. the 1.618 extension for this cycle shares confluence with point number 1. Yes, the quarterly reduction in return forecast of 160% for this Halving is also the 1.618. Dazzled? You should be!
There are many other studies for considering this level as the market top, which is discussed elsewhere.
Conclusions
If history continues to rhyme, the next 40 days may mark not only the top of this cycle, but also the start of Bitcoin’s long fade into irrelevance. A projected move to the $160k–$180k range would appear spectacular on headlines, yet within the broader arc of Bitcoin’s halving mechanics, it represents nothing more than the final gasp of exponential returns before the math itself runs out of road.
Each halving cycle has delivered progressively weaker gains, compressing the dream from life-changing multiples to mere percentages. At this trajectory, the next cycle risks producing a macro lower high, the first true sign of a terminal bear market. Beyond that lies the possibility of decades-long decline, where the legend of “digital gold” becomes just another case study in market psychology and technological obsolescence.
The irony is inescapable: what was once celebrated as unshackled freedom from centralised control now trades under the thumb of ETFs, influencers, and institutional flows. The rebellion has been monetised, the revolution syndicated. If October 2025 plays out as expected, we will look back not at the rise of Bitcoin to a million dollars per coin, but at its slow descent into being just another ticker on the screen, remembered more for what it symbolised than for what it ever achieved.
Ww
ETH : Accumulation Before Next Big Rally??Ethereum continues to show strength on the weekly timeframe.
Weekly structure remains firmly bullish, IMO. Pullbacks are natural, but the weekly structure favors continuation.
Weekly closing about 4.2-4.3K could trigger massive rally on weekly TF.
Chart is self explanatory. This is purely my interpretation of the chart and it could go wrong.
Note: This post reflects my personal views for educational purposes. It is not financial advice. Always DYOR before making any and every decision.

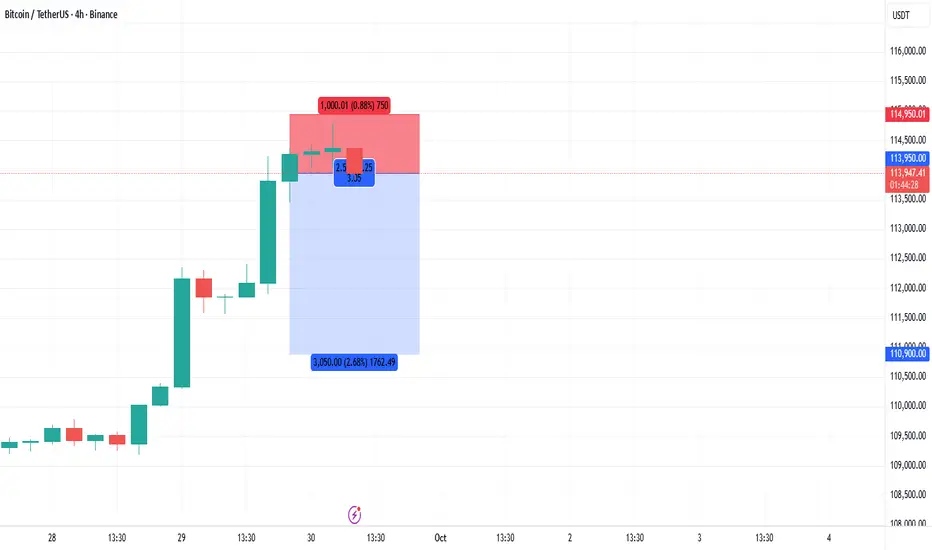
BTCUSDT Short Position on futuresBitcoin seems to have a downtrend below 114,000. Opened a short position around these important levels
Entry Price: 113,950
SL: 114,950
TP1: 112,000
TP2: 110,950
$Btc Turning PointBitcoin has bounced from its lower low and is now pressing toward the upper wall, but here’s the catch — it still hasn’t printed a higher high. The market seems to be preparing for a potential higher low formation, yet the RSI slipping from the overbought zone hints at profit-taking.
What does this mean? If CRYPTOCAP:BTC confirms a new lower high and holds, we could witness a push upward as buyers regain control. But if that setup fails and a fresh lower low forms, a clear bearish phase might kick in. The coming sessions will reveal whether Bitcoin is setting up for a healthy continuation or a deeper downturn.
Keep a close watch — this zone could define the next big move.
#Bitcoin #CryptoMarket #BTCAnalysis #TradingView

BTC Trade Setup: Dip Buy Zone at 113.8K, Breakout Above 115K1. Trend
BTC is currently in a short-term uptrend (multiple BOS and higher highs).
Price is stalling around Fib 0.5–0.618 zone (114,800 – 114,900).
The uptrend line is still holding for now.
2. Key Levels
Resistance: 114,800 – 115,000 (Fib 0.5–0.618).
Support zones:
113,800 – 114,000 (nearest FVG).
113,200 – 113,400 (previous structure + FVG).
111,800 – 112,200 (deeper FVG if correction extends).
3. Trading Plan (scenarios)
Scenario 1 – Buy with trend:
Wait for retracement into 113,800 – 114,000 zone.
Entry: Buy inside this zone.
SL: Below 113,600.
TP1: 114,800 – 115,000.
TP2: 115,500+.
Scenario 2 – Short-term Sell:
If price breaks below the trendline + closes under 114,000.
Entry: Sell on pullback.
TP1: 113,200.
TP2: 112,200.
4. Outlook
Short-term: Likely to retrace into 113,800 – 114,000 FVG before retesting 114,800 – 115,000 resistance.
If breaks above 115,000, next bullish target is 115,600 – 116,000.
If loses 113,800, a deeper correction toward 113,200 – 112,200 is expected.

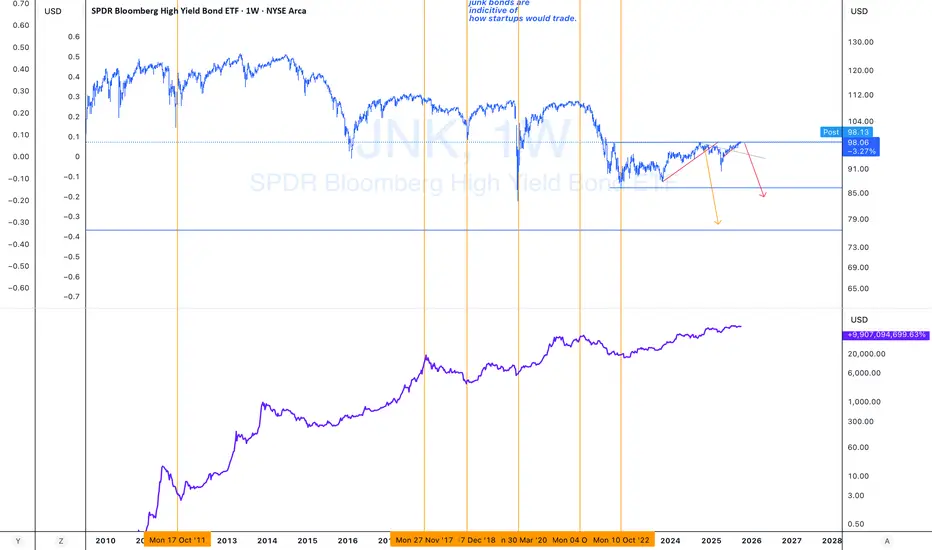
BREAKING: Crypto Is A Junk Security! $JNKJust a quick PSA showing the correlation between #junk debt and #crypto.
Notice the highs and lows are all undeniably correlated.
Proceed with extreme caution. As data releases are suspended (covered up), expect the high-risk junk stuff to collapse into oblivion.
Godspeed.
$BTC Lower highs....too early to celebrateBTC gets a golf clap today for wedging itself from 3 days of staying flat and doing nothing. Zooming out, we're seeing something a little different. Downward channel, and price movements swinging back and forth. Mid-week with the gov shutdown, we may see a bit pull down below 110k. This short squeeze does not compensate for the ~10% drop we've been seeing.

Bitcoin Bounces Strongly from Key Support – What’s Next?🔎 Technical Outlook (BTC/USDT, 4H):
1. Key Support: Bitcoin held the 110K – 112K zone, a historically strong demand area that triggered a solid rebound.
2. Channel Breakout: Price has broken out of a short-term descending channel, shifting momentum in favor of the bulls.
3. Immediate Resistances:
• First resistance: 115.5K – 116K
• Next major resistance: 118K – 120K (upper channel boundary)
4. Scenarios:
• 🟢 A confirmed breakout above 115.5K opens the path toward 118K → 120K.
• 🔻 Failure to clear resistance could trigger another pullback toward 112K or even a retest of 110K.
📌 Summary: Bitcoin has defended its major support and is showing bullish momentum in the short term. However, the upcoming tests at 115K+ will decide whether this move evolves into a stronger rally or just a corrective bounce.

BTC Rally – New Highs or Bull Trap?Hey Traders, IG:BITCOIN is currently trading within established descending channel since August highs at $124k , The recent bounce has now pushed price back up, currently sitting at the 38.2% Fibonacci retracement and likely heading into a critical supply zone at 115K–116K , which also aligns with the 50% Fib level .
This confluence, combined with RSI nearing overbought territory and the potential formation of a hidden bearish divergence (price making lower highs while RSI makes higher highs), suggests that momentum is weakening as we approach resistance. Historically on this chart, bearish divergences have often preceded meaningful pullbacks.
Unless bulls can break decisively above this zone and invalidate the channel structure, the probability favors rejection and continuation lower . My short‑term outlook points toward a move back into the demand zone, with Target 1 and Target 2 marked as key levels to watch for the next leg down.
Scenarios
🔴 Bearish (Higher Probability)
Rejection from 115K–116K supply zone (Fib 50–61.8 + channel resistance).
Short-term correction toward 110K, with deeper moves into 107K–105K demand zone.
🟢 Bullish Alternative
Break & close above 116K (channel + supply + 61.8 Fib) would invalidate this setup.
Opens room for a rally toward 120K+, but less likely given RSI divergence and supply pressure.
