Bitcoin Price Update and Trading Plan
**Current Situation**:
Bitcoin (BTC) is at a critical level, and its weekly closing price is highly important for traders. A strong bounce from the current price, followed by a weekly close above **$114,500**, is needed to confirm bullish momentum. This could lead to a significant upward move, allowing traders to capitalize on the next strong price movement. However, BTC should first retest its key support level, which it previously broke, to confirm its strength. If rejected at this support, a downward move toward **$108,000** is possible.
**Trading Plan**:
1. **Bullish Case**:
- **Condition**: If BTC bounces from its current level and closes above **$114,500** on the weekly chart, it signals strong bullish momentum.
- **Action**: Enter a long position targeting higher levels, such as **$117,200-$120,000**.
- **Stop Loss**: Place below **$114,000** to manage risk.
- **Rationale**: A close above **$114,500** confirms support and sets the stage for the next upward move.
2. **Bearish Case**:
- **Condition**: If BTC fails to hold above **$114,500** and breaks below the key support, it may retest the **$108,000-$110,000** zone, where it previously found support.
- **Action**: Wait for confirmation of a bounce at **$108,000** for a potential long trade, or short if rejection occurs at this level.
- **Stop Loss**: For shorts, place above **$115,000** to limit risk.
- **Target**: A downward move could target **$108,000**, with further declines possible if selling pressure increases.
- **Rationale**: A rejection at **$108,000** after breaking key support indicates bearish pressure, potentially leading to a deeper correction.
**Key Levels to Monitor**:
- **Support**: **$114,500** (immediate), **$108,000-$110,000** (major support zone).
- **Resistance**: **$117,200-$118,000** (immediate), **$120,000+** (next target).
- **Weekly Close**: The weekly close on September 28, 2025, will determine whether BTC confirms bullish strength or signals a deeper pullback.
**Conclusion**:
For a bullish outlook, BTC needs to close above **$114,500** to confirm a bounce and target higher levels. If it fails, traders should prepare for a potential retest of **$108,000**, where a rejection could lead to further downside. Monitor price action closely and use tight risk management due to BTC’s volatility.
*Disclaimer*: Cryptocurrency trading is highly risky. This is not financial advice; always conduct your own research before trading.
Bitcoinprediction
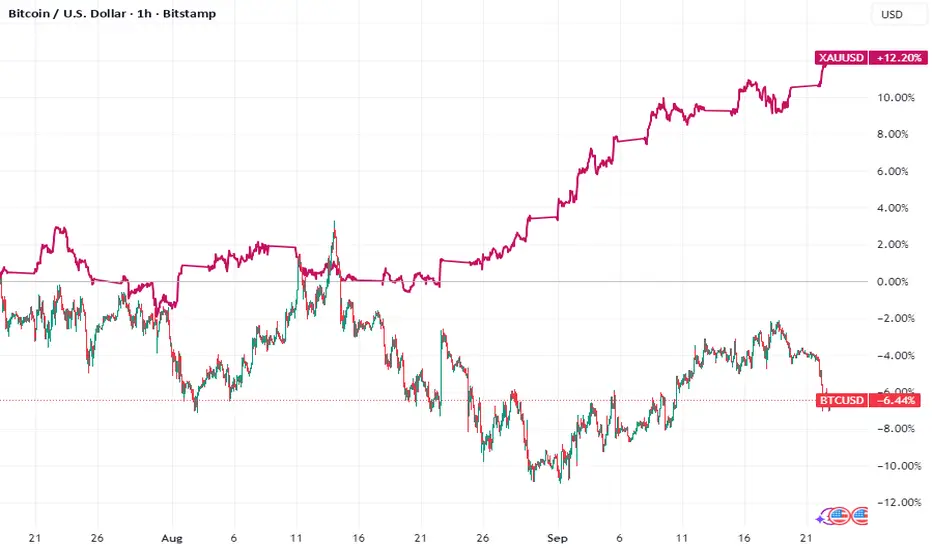
How Bitcoin Profits Are Fueling Gold's Record Surge
In the intricate dance of global markets, a subtle yet significant choreography unfolded, revealing a profound shift in investor sentiment. As Bitcoin, the volatile flag-bearer of the digital asset revolution, stumbled, a powerful wave of capital appeared to flow into a more ancient store of value. Roughly an hour after Bitcoin’s pronounced drop, gold, the timeless emblem of wealth and stability, surged to notch yet another record high. This sequence of events was more than a random fluctuation; it was a clear signal of a sophisticated market maneuver: a profit rotation from the speculative froth of cryptocurrency into the hard certainty of precious metals.
The divergence highlights a critical test of the "digital gold" narrative that has propelled Bitcoin for years. While safe-haven flows have traditionally sought refuge in bullion during times of uncertainty, the recent price action suggests a more complex, multi-layered dynamic is at play. Investors, having reaped substantial gains from the crypto market, appear to be de-risking and preserving those profits in an asset benefiting from its own powerful macroeconomic tailwinds. This "digital-to-physical shuffle" offers a compelling glimpse into the evolving relationship between these two assets and the strategic thinking of modern investors navigating a landscape of persistent inflation, geopolitical tension, and shifting monetary policy.
Anatomy of the Divergence: Why Bitcoin Stumbled While Gold Rallied
The recent price action did not occur in a vacuum. Bitcoin’s slide was a culmination of factors signaling potential "cycle exhaustion." The drop triggered a brutal leverage washout, with a massive volume of bullish crypto wagers liquidated, hitting smaller tokens particularly hard. This cascade of liquidations suggests that the recent rally was fueled by speculative excess, making it vulnerable to a sharp correction. The narrative of Bitcoin as a stable safe haven has been challenged, as its behavior mirrored that of a high-beta risk asset, sensitive to shifts in market liquidity and sentiment.
Conversely, gold's ascent to a record high is built on a much firmer, multifaceted foundation. The rally is powerfully supported by several key drivers. A primary driver is the aggressive and sustained accumulation by the world’s central banks. For several years running, official sector buying has reached historic levels, with institutions in emerging markets leading the charge to diversify their reserves away from the U.S. dollar and hedge against geopolitical risk. This sustained, large-scale demand creates a strong underlying price support that is independent of speculative flows.
Furthermore, expectations of monetary easing have further fueled gold's appeal. Lower interest rates decrease the opportunity cost of holding non-yielding bullion, making it more attractive to investors. With markets anticipating a cycle of rate cuts, the macroeconomic environment appears highly conducive to further gold upside. Finally, ongoing geopolitical conflicts and stubborn inflation have amplified demand for gold as the ultimate monetary insurance policy. Faced with currency devaluation risks and systemic uncertainty, both institutional and retail investors have flocked to the yellow metal, which has a multi-millennia track record as a reliable store of value. This confluence of factors has propelled gold's rally, leading many market observers to revise their forecasts upward.
The Rotation Thesis: Locking in Digital Profits in Physical Metal
The most compelling aspect of the market action was the timing. The roughly one-hour lag between Bitcoin’s significant drop and gold’s subsequent rally is a tell-tale sign of a deliberate capital rotation. This is not the instantaneous reaction of an algorithmic panic, but the considered move of traders and fund managers observing a trend, assessing the risk-off sentiment, and redeploying capital.
This is not the first time this pattern has emerged. In previous market cycles, steep liquidations in cryptocurrency futures have often been followed by noticeable inflows into gold-backed investment vehicles. The current scenario appears to be a larger, more pronounced version of this dynamic. Traders who have enjoyed Bitcoin's run-up are choosing to lock in those volatile, digital gains by moving them into a more stable asset that is itself in a powerful bull market.
This rotation challenges the simplistic notion that Bitcoin is a direct substitute for gold. While both are seen as hedges against fiat currency debasement, their behavior reveals different risk profiles. Bitcoin's recent performance confirms its status as a high-risk, high-reward asset, often correlated with speculative liquidity and risk appetite. Gold, meanwhile, is reasserting its traditional role as a core wealth preservation tool and a hedge against systemic risk, supported by the immense and steady buying pressure from the world's central banks. The market seems to be making a clear distinction: Bitcoin is for speculation; gold is for preservation.
Broader Implications: A New Dance for Modern Investors
The divergence between gold and Bitcoin carries significant implications for investors and asset allocators. It serves as a powerful reminder that despite the maturation of the crypto market, gold’s role in a diversified portfolio remains unique and irreplaceable. The "digital-to-physical shuffle" is a new market dynamic that investors must understand and navigate.
For institutional players, this rotation represents a sophisticated strategy to manage portfolio risk. After a period of high returns in a speculative asset, rebalancing into a stable asset with strong fundamentals is a prudent move. The rise of regulated investment vehicles for both gold and Bitcoin has made executing such cross-asset strategies more seamless than ever, suggesting this dynamic will become a more common feature of market corrections.
Looking ahead, the outlook for both assets remains complex. Some analysts believe Bitcoin's correction is a healthy cleansing of speculative excess before it continues its upward trajectory. Others argue that Bitcoin's volatility and regulatory hurdles continue to limit its appeal as a true safe haven compared to gold.
What is undeniable, however, is the structural bull case for gold. The powerful trend of de-dollarization and reserve diversification by central banks is not a cyclical fad but a long-term strategic shift. As nations continue to seek a neutral reserve asset to insulate themselves from geopolitical pressures and the weaponization of finance, gold is re-emerging as a tangible monetary anchor.
In conclusion, the recent market events were a masterclass in modern market dynamics. Bitcoin's stumble, met with gold's powerful rally, was not a sign of the crypto market's demise, but rather its integration into a more sophisticated global financial ecosystem. It revealed a class of investors capable of harvesting profits from high-risk digital ventures and strategically redeploying them into the time-tested security of precious metals. While Bitcoin continues its volatile journey toward maturity, the episode was a resounding affirmation of gold's enduring power. In a world of increasing uncertainty, the ancient allure of physical gold is not just holding its own—it is shining brighter than ever.
D
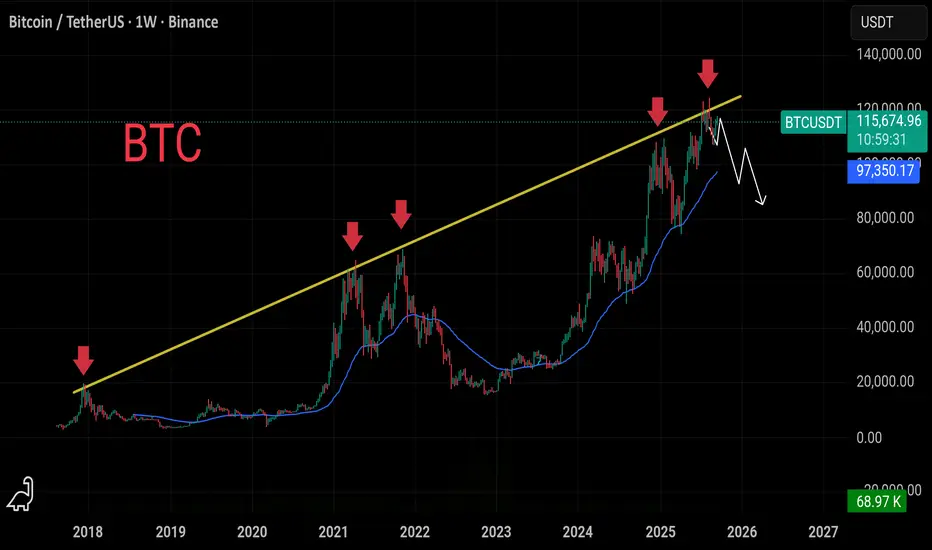
Bitcoin Bearish Supercycle 📉 Bearish Bitcoin Supercycle: 8-Year Bear Market Ahead?
Ticker: BTCUSD
Timeframe: Weekly/Monthly
Sentiment: Bearish 🐻
💡 Main Thesis
We are at a critical turning point in Bitcoin's supercycle. After years of bull market, we're seeing concerning signals that suggest the possible beginning of an extremely long-term bearish supercycle - double the standard 4-year cycle.
🏦 Institutional Concentration
Major institutions, funds, and whales have accumulated massive amounts of BTC over recent years:
MicroStrategy, Tesla, BlackRock ETF and others hold hundreds of thousands of BTC
Approximately 20% of all bitcoins are now in institutional hands
This concentration creates a dangerous situation for retail investors
⚠️ Coordinated Sell-off Risk
Key Concerns:
Liquidity trap: Institutions could coordinate massive sell-offs
Market manipulation: Large players have the power to drastically influence price
Systemic risk: Massive selling could trigger an avalanche of further sales
🏛️ Historical Context
Traditional banking elites have long viewed Bitcoin as a threat:
Decentralization undermines their monetary monopoly
Several attempts to "kill" Bitcoin have failed
Current situation provides them with an ideal opportunity
📊 Technical Indicators
RSI: Overbought territory on higher timeframes
On-chain metrics: Decreasing long-term holder activity
Whale watching: Increased large wallet activity
🎯 Scenario
If this supercycle unfolds, we can expect:
Gradual institutional sell-off over first 2 years
Massive break below all key support levels
Extremely long-term bear market lasting 8 years
Target level: $3,000 - $8,000 (return to pre-2017 levels)
Complete market structure reset

Bitcoin BTC: Watching for Support and Accumulation📊 Bitcoin (BTC) has been pushing lower and is now appearing overextended to the downside. Recently, price has staged a deep correction that may be nearing exhaustion.
🔎 I’ll be watching closely to see if BTC can hold key support levels and potentially begin forming an accumulation base 🏗️.
📈 Should price confirm strength with a bullish break of market structure, that would signal a possible long opportunity 🚀. Until then, patience is required to let the setup fully develop.
⚠️ Disclaimer: This is educational analysis only and not financial advice. Always trade responsibly and manage risk carefully.

Analytics: Market Outlook and Forecasts
📈 WHAT HAPPENED?
Last week, Bitcoin spent most of its time trading sideways. Towards the end of the week, there was a long entry, and Bitcoin reached the resistance zone of $117,500-$119,000 (accumulated volumes).
There was a rebound from this range, but we didn’t observe any selling initiative. Therefore, the scenario was based on a repeated, deeper filling of the aforementioned zone. However, the situation took a different turn.
Tonight, there was an impulsive breakout of two support levels. Below one of them, a large number of liquidations were released, leading to the formation of a new key volume support point and disrupting the long-term trend structure.
💼 WHAT WILL HAPPEN: OR NOT?
It’s important to closely monitor the buyer's reaction.
Today, we may see a resumption of buys and a test of the mirror sales level of ~$113,800 (market imbalance). This may be followed by a re-test of the current volume anomaly zone.
If the $113,000-$112,400 zone is successfully defended, there is a possibility of recovery to the $116,000 level. However, the focus remains on sales.
Alternative scenario: test of the buyer zone below the level of $111,600-$110,500 (accumulated volumes) and the development of a local sideways pattern between the two nearest volume zones.
Buy Zones:
$111,600–$110,500 (accumulated volume)
~$108,400 (cluster anomalies)
$108,000–$102,500 (accumulated volume)
Sell Zones:
~$113,800 (market imbalance, mirror zone)
$115,000–$116,000 (accumulated volume)
$118,000–$119,000 (accumulated volume)
$121,200–$122,200 (buy absorption)
📰 IMPORTANT DATES
This week, we expect the following macroeconomic events:
• September 23, Tuesday, 13:45 (UTC) — publication of the US Manufacturing and Services PMI for September;
• September 23, Tuesday, 16:35 (UTC) — speech by US Federal Reserve Chairman Jerome Powell;
• September 24, Wednesday, 14:00 (UTC) — publication of US August New Home Sales data;
• September 25, Thursday, 7:30 (UTC) — announcement of the Swiss interest rate decision;
• September 25, Thursday, 8:00 (UTC) — press conference of the National Bank of Switzerland;
• September 25, Thursday, 12:30 (UTC) — publication of the US GDP for the second quarter of 2025 and the number of initial applications for unemployment benefits in the US;
• September 25, Thursday, 14:00 (UTC) — publication of data on US second-hand housing sales for August;
• September 26, Friday, 12:30 (UTC) — publication of the US basic price index for personal consumption expenditures for August.
*This post is not a financial recommendation. Make decisions based on your own experience.
#analytics

BTC - WEEKLY OUTLOOK - ON POINT!!#BITCOIN - Weekly Outlook 🚨
Mastercall again! 🔥
As expected, we saw a solid rejection with a dump towards the $112,000 mark mentioned in my previous outlook ✅🎯
H1 trend: Still bearish in the short term 📉Price action remains weak below key resistance zones.
Key support to watch:
🔸Primary support: $110,500 – $110,000
🔸Clean break below $110,000 (with volume) could trigger a sharp move down toward $107,000+
However, the broader trend remains bullish on the weekly and monthly timeframes.
Above $110,000, bulls retain control according to my previous updates. A consolidation above $110,000 would be a positive signal for #alts recovery.
Scenarios:
⚠️ Loss of $110k support = possible accelerated drop to 107k+
🟩 Hold/Consolidation above $110k = base for #alts to rebound
Stay nimble, manage your risk!

BTC 4H👁👁The pullback we were waiting for, pay attention to the 113K area, although I already have a position at 114200

$BTC Sunday Update Nothing has changed, structure still intactCRYPTOCAP:BTC Sunday Update
Nothing has changed, structure still intact I’m still holding my short, staying patient for the lower targets ahead. If BTC makes a push into 120, 125K, that’s where I’ll load more. My downside map stays the same: 105K → 100K → 95K → 90K. Altcoin pumps look like nothing more than liquidity traps set by market makers before the real drop unfolds.
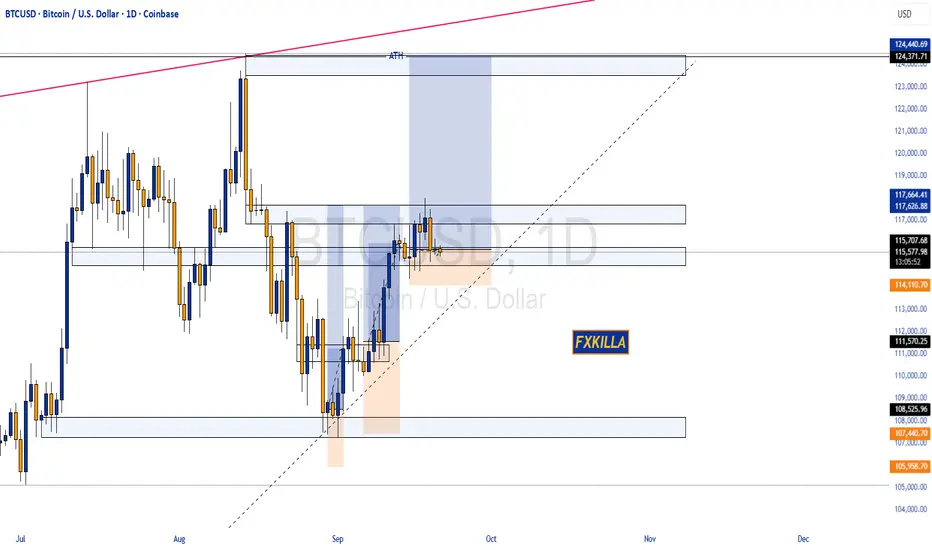
BITCON HIGH PROBABILITY SETUP SOON!!!🚨 BTCUSD HIGH PROBABILITY BUY SETUP 🚨
* Here We Can See Clearly The Next Potential Move For BTC Coming Hours/Days.
* Keep Your Eyes Close On Your Trading Positions.
* Happy PIP Hunting Traders.
FXKILLA.
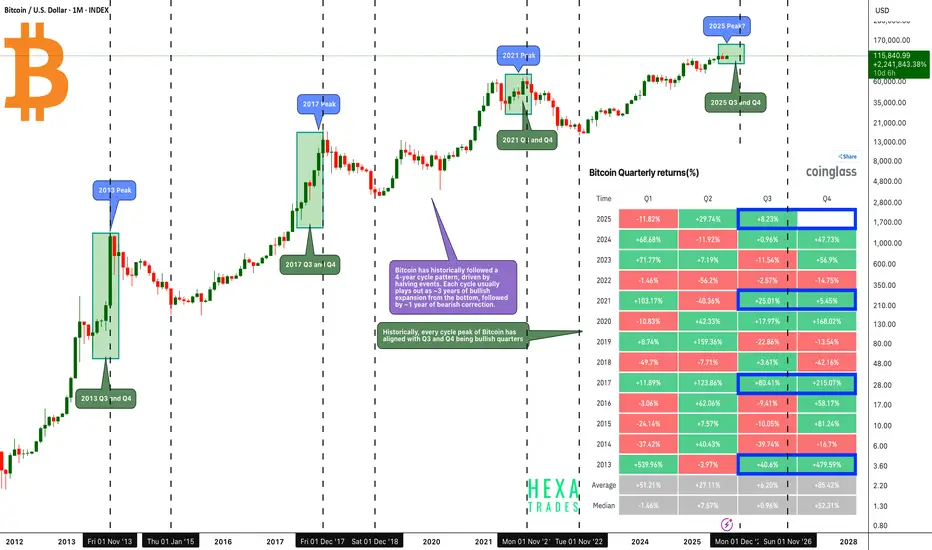
Bitcoin - Final Pump Before the Crash?Bitcoin has historically followed a 4-year cycle pattern, driven by halving events. Each cycle usually plays out as ~3 years of bullish expansion from the bottom, followed by ~1 year of bearish correction.
Historically, every cycle peak of Bitcoin has aligned with Q3 and Q4 being bullish quarters, making the second half of the year the most critical period for cycle tops.
Key Observations from Previous Cycle Peaks:
🔶 2013 Peak:
- Q3: +40.6%
- Q4: +479.59%
Strong acceleration into year-end marked the cycle top.
🔶 2017 Peak:
- Q3: +80.41%
- Q4: +215.07%
A similar explosive move as Bitcoin entered the mania phase.
🔶 2021 Peak:
- Q3: +25.01%
- Q4: +5.45% .
🔶 Current Cycle (2025 Peak?):
- Q3 2025 is already up +8.23% with 15 days remaining until the quarter ends.
- If history repeats, Q4 could be the blow-off phase where Bitcoin accelerates sharply to its peak.
🔶 Potential 2025 Target:
Bitcoin’s Q4 2025 peak could realistically reach the $140K–$160K range before entering the next corrective phase.
Conclusion: If Bitcoin follows its established 4-year cycle structure, we could be entering the final bullish leg of this cycle. History suggests Q3 and Q4 have the highest probability of producing outsized gains, with Q4 especially aligning with cycle peaks.
Cheers
Hexa
BINANCE:BTCUSDT CRYPTOCAP:BTC BITSTAMP:BTCUSD BINANCE:BTCUSDC
2-Month High Bitcoin Accumulation Could Push Price To $120,000Bitcoin is trading at $116,027, maintaining steady gains since the start of the month. The crypto king is now facing resistance at $117,261, a key level that has kept upward progress capped in recent sessions. Breaking this barrier will be crucial for Bitcoin’s next move.
If Bitcoin manages to breach and flip $117,261 into support, it could rally toward $120,000 in the coming days. Strong buying pressure and favorable momentum indicators make this outcome highly plausible.
However, a loss of momentum could bring renewed selling pressure. Should BTC fall through the $115,000 support, the price risks slipping to $112,500, invalidating the bullish outlook.

BTC DOMINANCE ALERT! 🚨 BTC DOMINANCE ALERT! 🚨
My chart analysis shows BTC dominance dropping from 58% to a projected 42% / 40%
I’m calling it the "END OF BULL RUN"! 📉
RobottoMACD signals bearish momentum, and our premium indicator, Robotto OG, also gave a clear, precise signal of this dominance drop—proof our tools are on point! 💡
But hold up, declining dominance could spark an ALTPSEASON!
💥 With BTC at $115K and crypto cap at $4T, the bull might rage into Q4 2025!
Watch 50% support, break it, and alts explode! 🚀
What’s your take? Drop it below!

Bitcoin and the WeekendCRYPTOCAP:BTC
There have been positive inflows into exchanges over the past four hours. Bitcoin has broken its trend. All signals are pointing to a decline for now. We'll be monitoring and reporting on this.

BTC/USDT Long Position – Clean R/R SetupThis chart represents a planned buy entry on BTC/USDT based on market structure and recent price action.
Entry Zone (Buy): 115,937.92
Take Profit (TP): 117,920.25
Stop Loss (SL): 115,023.24
The setup is built on a clear retracement entry, providing a favorable risk-to-reward ratio. Market recently showed a pullback after a drop, and this zone aligns with potential liquidity grab, making it a strong entry point for buyers.
📌 Plan:
Enter long around 115,937.92
Risk is strictly limited with SL below recent liquidity sweep at 115,023.24
Upside target is set at 117,920.25 for a clean R:R opportunity
This is a technical setup only, not financial advice. Always manage your own risk
BTC crossing DEATH CROSS (SMA200)You can't say I didn't tell you so. BTC and Nasdaq are highly correlated and the market is just wayyy too hot. All the FOMO in the world won't help now. Overnight we saw a big dip in the Japanese market and the cracks are starting to show. Next will the long term yields spiking as risk goes up and investors want to be compensated for long term risk. Strategy is using VIX, MSTZ, BTCZ as relatively cheap "insurance." The volatility is great, but many don't know how to enter and exit.
The technicals here show weakness at the top, and going from a historical / fundamental perspective we are bound for a nice / deep pullback. When short term rates are cut, and the market bumps up long term rates it is big FU and we all know what happens next. Could be wrong, but worse case you bought into cheap insurance with a massive high reward / risk ratio!
Best of luck out there....!

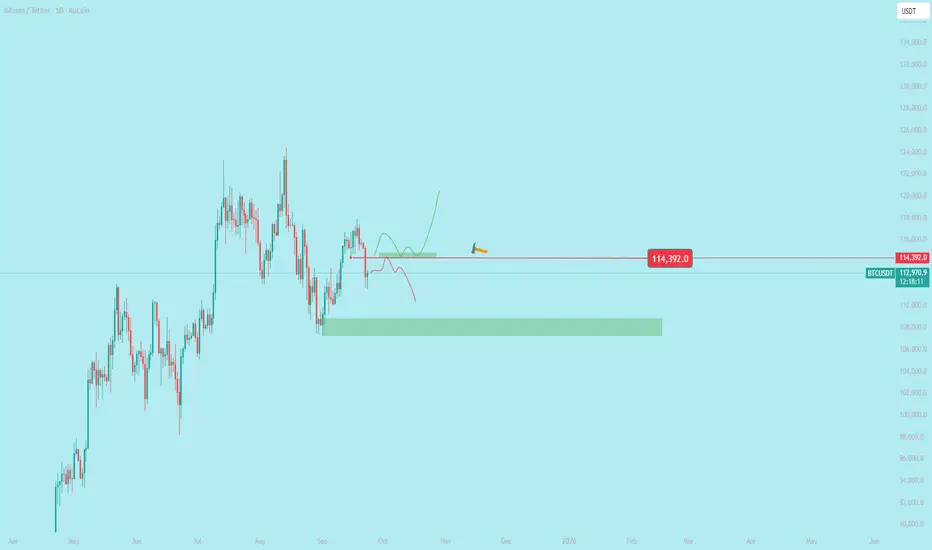
BTC/USDT Analysis. Decision-Making Zones
Hello everyone! This is the CryptoRobotics trader-analyst with your daily market update.
Yesterday, we outlined two possible scenarios — and the market followed the second one. Bitcoin moved lower, testing the nearest buy zone, from which we can now reasonably expect renewed buying activity.
The current selling wave looks weak, so even a small reaction from buyers may lead to a retest of the local high. From that level, we will closely monitor price action, as a deeper correction could follow.
Buy Zones:
$116,200–$115,400 (accumulated volume, volume anomaly)
$114,300–$113,500 (volume zone)
$111,600–$110,500 (accumulated volume)
~$108,400 (cluster anomalies)
$108,000–$102,500 (accumulated volume)
Sell Zones:
$117,500–$119,000 (accumulated volume)
$121,200–$122,200 (buy absorption)
This publication is not financial advice.

BITCOIN PREDICTION: THIS IS THE NEXT TARGET (scary) Yello Paradisers! Enjoy the video!
And Paradisers! Keep in mind to trade only with a proper professional trading strategy. Wait for confirmations. Play with tactics. This is the only way you can be long-term profitable.
Remember, don’t trade without confirmations. Wait for them before creating a trade. Be disciplined, patient, and emotionally controlled. Only trade the highest probability setups with the greatest risk to reward ratio. This will ensure that you become a long-term profitable professional trader.
Don't be a gambler. Don't try to get rich quick. Make sure that your trading is professionally based on proper strategies and trade tactics.

Bitcoin Price Prediction: Will BTC Hit $119K Next?Bitcoin Price Prediction: Will BTC Hit $119K Next?
Bitcoin’s journey has been nothing less than a roller coaster, marked by dramatic rises and sharp falls. As of late, the cryptocurrency has seen fluctuations influenced heavily by broader economic signals, particularly the policy decisions from the United States Federal Reserve. The latest buzz in the crypto community revolves around whether Bitcoin can breach a new milestone of $119,000. This speculation is fueled by recent shifts in the market and macroeconomic policies that could either propel or hinder this ascent.
Current Market Overview
Key Resistance and the $118K Threshold
Bitcoin currently faces a significant resistance level at $118,000. This figure is not just a random high point; it represents a critical psychological and technical barrier. A break above this level could signal a strong bullish momentum, potentially setting the stage for reaching new heights. The resistance has formed due to various factors including profit-taking, historical resistance levels, and speculative trading behaviors.
The Role of the US Federal Reserve
The Federal Reserve's policies, particularly interest rate cuts, have a profound impact on investment in risk assets like cryptocurrencies. Lower interest rates generally decrease the yield on safer investments like bonds, making higher-risk investments more attractive. The anticipation around the Fed's decisions can lead to increased volatility in the Bitcoin market.
Liquidity and Market Sentiment
The liquidity in the Bitcoin market, evidenced by the influx of both buy and sell orders, plays a crucial role in its price movements. High liquidity leads to less price manipulation and more stability, whereas low liquidity can lead to higher volatility. Currently, the market is witnessing substantial liquidity, indicating active participation from both retail and institutional investors.
Factors Influencing Bitcoin's Price Trajectory
Institutional Adoption
One of the primary drivers behind Bitcoin’s potential rise to $119K is the increasing adoption by institutional investors. As more firms enter the market, their substantial buying power can significantly push the price upwards. This adoption also adds legitimacy to Bitcoin, encouraging more cautious investors to dip their toes in the crypto waters.
Technological Advances
Improvements in blockchain technology and the introduction of new features can also influence Bitcoin's price. For instance, enhancements in scalability and security can make Bitcoin more attractive to both investors and users.
Regulatory Environment
Regulations play a pivotal role in shaping the cryptocurrency landscape. Positive regulatory developments, or lack of negative ones, could boost investor confidence and push the price of Bitcoin higher.
Economic Indicators and Market Sentiments
Inflation and the Dollar Index
Inflation levels and the strength of the dollar also influence Bitcoin’s value. Typically, Bitcoin has been seen as a hedge against inflation. A weaker dollar often makes Bitcoin more attractive to international buyers, potentially pushing its price up.
Sentiment Analysis
Market sentiment, driven by news and social media, significantly impacts Bitcoin’s price. Positive news can lead to fear of missing out (FOMO), driving the price up, while negative news can trigger panic selling.
Technical Analysis and Future Predictions
Chart Patterns and Indicators
From a technical standpoint, Bitcoin has shown resilience by bouncing back from several corrections. The formation of a bullish flag pattern, combined with strong support levels being tested and held, suggests upward momentum.
Predictive Models
Various predictive models based on historical price data, market cycles, and external economic factors suggest a bullish outlook for Bitcoin. These models often incorporate elements like stock-to-flow ratios which have been historically accurate in predicting Bitcoin’s long-term price movements.
Expert Opinions
Many industry experts and analysts have weighed in on Bitcoin’s potential to hit $119K. While opinions vary, the prevailing sentiment is cautiously optimistic, contingent on market conditions and macroeconomic factors remaining favorable.
Conclusion
The question of whether Bitcoin will reach $119K is complex and laden with variables. Key factors include Federal Reserve policies, market liquidity, institutional investment, and broader economic indicators. While the short-term journey may be volatile, the long-term outlook for Bitcoin remains bullish, with many paths potentially leading to new all-time highs. As always in the crypto world, only time will tell, but the signs are promising for those betting on Bitcoin’s success.

BTC/USDT Analysis. Trend After the Fed Decision
Hello everyone! This is the CryptoRobotics trader-analyst with your daily market update.
Yesterday evening, the U.S. Federal Reserve cut the key interest rate by 25 bps. The move was widely expected, so the market reaction was muted: volatility briefly spiked, but the overall trend direction remained unchanged.
When testing $116,000, we saw an initial reaction, but during the FOMC meeting volatility increased, and this level was eventually broken. At the moment, a significant volume zone has formed at $116,200–$115,400 (accumulated volume, volume anomaly), and price has consolidated above it.
Although most key volumes are located below, we are currently testing the $117,500–$119,000 sell zone (accumulated volume). There has been no strong selling reaction so far, but buying activity has weakened: price action remains sluggish, and new highs are difficult to achieve.
Base scenario: a deeper test of the sell zone followed by a pullback to nearby support zones, where long entries can be considered.
Alternative scenario: first a move down to test these support zones, followed by renewed buying and a retest of the sell zone.
Buy Zones:
$116,200–$115,400 (accumulated volume, volume anomaly)
$114,300–$113,500 (volume zone)
$111,600–$110,500 (accumulated volume)
~$108,400 (cluster anomalies)
$108,000–$102,500 (accumulated volume)
Sell Zones:
$117,500–$119,000 (accumulated volume)
$121,200–$122,200 (buy absorption)
This publication is not financial advice.

FOMC Day: Prepare for Potential Bitcoin Volatility!Today is a big day for the markets – the US Federal Funds Rate decision and the FOMC Press Conference are scheduled, events that could potentially change the game for Bitcoin ( BINANCE:BTCUSDT ) and other assets .
But until the meeting begins , we still have time to analyze the charts and prepare.
Keep in mind : as we get closer to the announcement and especially during the release, the market could turn highly volatile. Manage your positions wisely and don’t forget your stop-loss levels .
-------------------------------------------
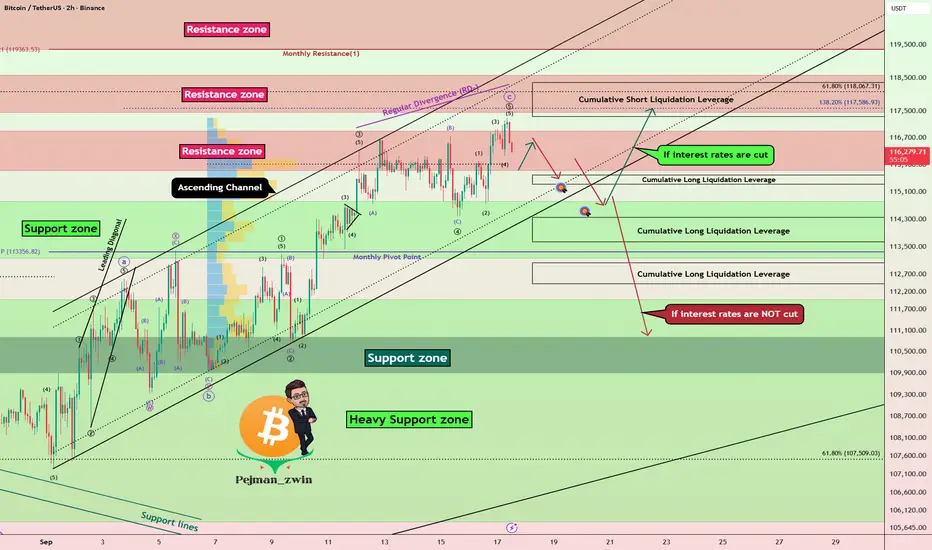
Bitcoin rose about +2% yesterday on the news that " Trump Family's American Bitcoin just went public on the Nasdaq ."
Bitcoin is currently trading in an ascending channel and Resistance zone($116,900-$115,730) near the Cumulative Short Liquidation Leverage($118,354-$117,329) .
In terms of Elliott Wave theory , if interest rates cut , Bitcoin could be completing wave 4 and then rising again and possibly forming a new All-Time High(ATH) . On the other hand, if interest rates do NOT cut , Bitcoin appears to have completed wave C of the Zigzag Correction structure(ABC/5-3-5) .
Also, we can see the Regular Divergence(RD-) between Consecutive Peaks .
I expect Bitcoin to drop to at least $114,860(First Target) before the Fed meeting starts , and if interest rates are not cut , we will see a further and more sudden drop in Bitcoin . And if interest rates CUT , there is a high probability of a Bitcoin pump, so stick to the first target($114,860) for now.
Second Target: $114,470
Cumulative Long Liquidation Leverage: $115,597-$115,330
Cumulative Long Liquidation Leverage: $114,351-$113,640
Cumulative Long Liquidation Leverage: $113,031-$112,430
Do you think the Federal Reserve will cut interest rates?
Please respect each other's ideas and express them politely if you agree or disagree.
Bitcoin Analysis (BTCUSDT), 2-hour time frame.
Be sure to follow the updated ideas.
Do not forget to put a Stop loss for your positions (For every position you want to open).
Please follow your strategy and updates; this is just my Idea, and I will gladly see your ideas in this post.
Please do not forget the ✅' like '✅ button 🙏😊 & Share it with your friends; thanks, and Trade safe.
Bitcoin Price Crosses $117,000 Post-Fed’s 35 bps Rate CutBitcoin is currently trading at $117,182, continuing its uptrend since the beginning of the month. The immediate challenge lies in flipping $117,261 into support, which would give the cryptocurrency the base it needs for further upside.
If successful, Bitcoin could target $120,000 as its next milestone. A breach and consolidation above that level could set the stage for further gains. This is likely, particularly if ETF inflows continue reinforcing investor confidence.
However, risks remain. Should selling pressure increase, Bitcoin may struggle to hold above key levels. A drop below $115,000 could open the door to a correction toward $112,500, invalidating the bullish thesis and cooling near-term momentum.

BitCoin $BTC weekly demand level helping the strong rallyWeekly demand imbalance is still in control and is playing out well. A third large bullish candlestick body is being created. Trying to break the resistance level and the all-time highs.

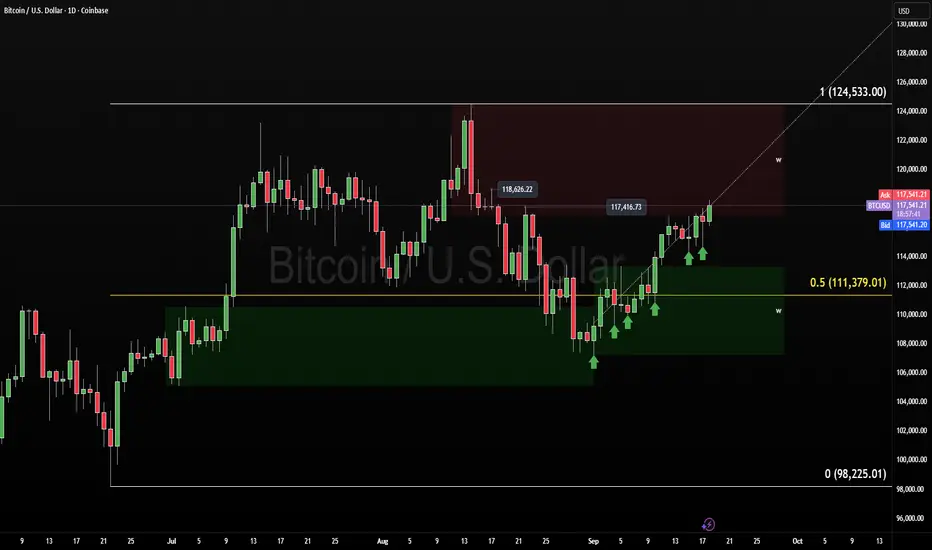
Bitcoin vs. Dollar – AFTER-FOMC CheckBTC holding firm while DXY chops.
🎯 117,416 target tagged overnight.
Next magnet sits near 118,626 if market makers keep grinding.
Overnight action printed a volume discount zone—I missed that fill and won’t chase.
I’m simply trailing yesterday’s entry, no new adds.
Red zone above is weekly bearish distribution, so after a 15-hour trading day yesterday it’s time to let the market work.