BITCOIN NEXT MOVE REVEALED!!!!! (this will make you scream) Yello Paradisers! In this video, we went through multiple timeframes as professional traders. We assumed things to analyze in Elliott Wave and other important indicators and advanced technical analysis tools. What's the next movement going to be with the highest probability!
Paradisers! Keep in mind to trade only with a proper professional trading strategy. Wait for confirmations. Play with tactics. This is the only way you can be long-term profitable.
Remember, don’t trade without confirmations. Wait for them before creating a trade. Be disciplined, patient, and emotionally controlled. Only trade the highest probability setups with the greatest risk to reward ratio. This will ensure that you become a long-term profitable professional trader.
Don't be a gambler. Don't try to get rich quick. Make sure that your trading is professionally based on proper strategies and trade tactics.
Bitcoinprediction

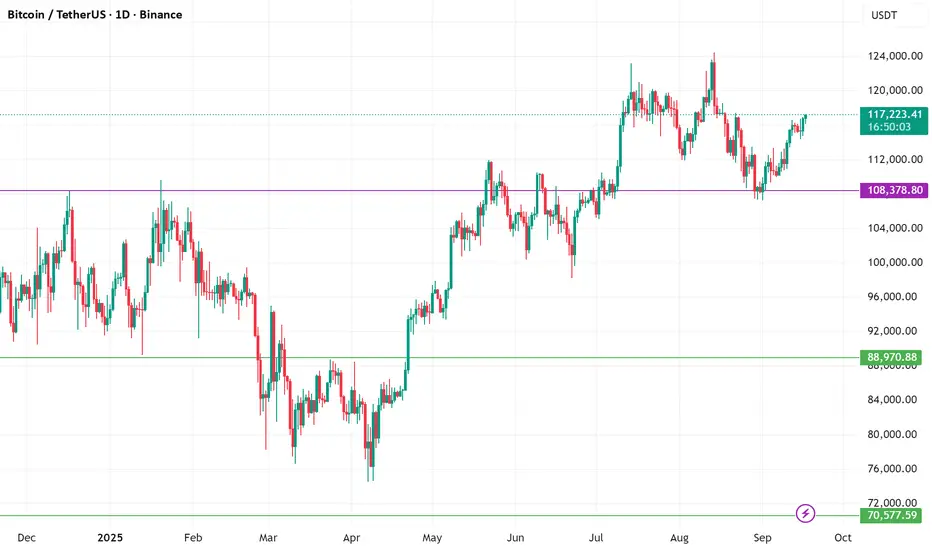
Rate Cuts, Liquidity, and BTC: Why 120K Is the Danger ZoneYesterday , while everyone was screaming about a Bitcoin dump, we caught the breakout of that resistance I showed you.
Today, I want to talk about the upcoming rate cut news , what could happen after it, and what we should do with our open positions.
Now personally, I’m still holding the breakout position we entered a week ago . I didn’t secure any profits, and honestly—I didn’t even want to. Because if the Fed cuts rates, we could kick off the next leg of this uptrend.
But keep this in mind: opening fresh positions around 120K IS NOT EASY AT ALL. Why?
Because there’s massive liquidity up there, huge volatility, and the chances of getting stopped out are very high. That’s exactly why I’d rather hold my position from earlier than be forced to open new ones in that zone.
👉 Let’s look at yesterday’s daily candle: it closed super bullish. This shows the market is leaning positive on the idea of a rate cut. But is this candle just front-running the news? Hard to say. We can’t exactly go ask every trader if they bought because of the Fed. So, better not overthink it.
I personally expect a short-term dip after the news drops. But more important than the cut itself are Powell’s words. If he signals more cuts are coming, markets could explode higher. If he says “not anytime soon,” we might get a pullback.
⚠️ My advice:
If you don’t already have a position, stay on the sidelines for a few hours. Any stop loss you put now has a big chance of getting hit.
But if, like me, you’re already in from the earlier triggers, just hold. It’s worth it.
For me, I’m also long on GBP/USD, and I didn’t secure profits there either—I’m waiting to see how it reacts.
👉 Quick look at BTC.D: dominance is rising with Bitcoin, which means it’s smarter to keep focus on BTC rather than altcoins. When dominance turns bearish again, that’s when we’ll shift back to alts.
This is why for the past few days I’ve been saying: stick with Bitcoin. Liquidity is flowing into it.
Ethereum? It gave back almost 70% of its recent move.
LONG STORY SHORT: don’t do anything stupid here. The best play, if you don’t have an open position, is to stay patient. Don’t FOMO.
Remember: the most important thing is not Bitcoin’s price itself. It’s stop-loss size, liquidity zones, and momentum. here in Skeptic Lab, that’s exactly what we dig into.
I’ll try to post another update after the Fed news drops.
Until then, stay safe. Peace ✌️

BTC/USDT Analysis. Caution: Rising Volatility
Hello everyone! This is CryptoRobotics’ trader-analyst with your daily market update.
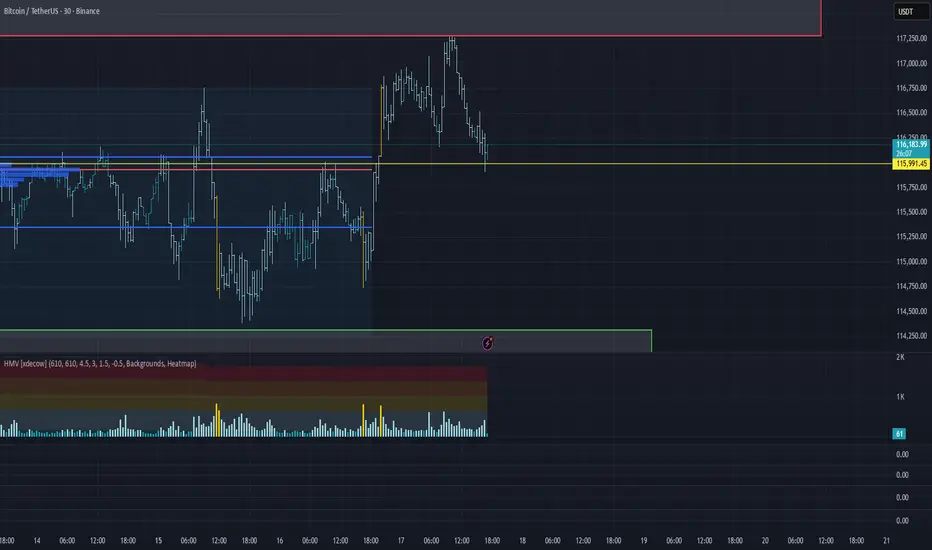
As expected, Bitcoin tested the recent local high yesterday. Before reaching the sell zone, sellers began to take control of the short-term momentum.
The current wave of selling is accompanied by increased negative delta, which signals strong selling pressure — however, the price reaction has been relatively muted so far. If buyers regain control near the POC of the recent consolidation at ~$116,000, we expect a full test of the $117,500–$119,000 sell zone (accumulated volumes). If there is no buying reaction, we could see a continuation of the decline toward the $114,300-$113,500 support zone (volume area).
Keep in mind that today at 21:00 (GMT+3), the US Federal Reserve will announce its key interest rate decision, which could trigger significant volatility and invalidate the current short-term scenario. Watch price reaction carefully at the mentioned zones.
Buy Zones:
$114,300-$113,500 (volume zone)
$111,600-$110,500 (accumulated volumes)
~$108,400 (cluster anomalies)
$108,000–$102,500 (accumulated volumes)
Sell Zones:
$117,500–$119,000 (accumulated volumes)
$121,200–$122,200 (buy absorption)
This publication is not financial advice.
Bitcoin: Is it time?Being a crypto enthusiast, these are exciting times!
We have seen Bitcoin hit all time highs just a couple of weeks back, topping out $124,580 before retracing down to $107,000.
Many questioned: HAS THE BITCOIN BUBBLE BURST?
I would like to disagree with that.
With the rate cuts being 'almost' certain today, we expect risk assets (such as BTC) to be more attractive investments for both firms and investors globally.
After reaching the all-time highs and with the news event scheduled for mid-September, the sell off into the discount zone (as shown in the chart) was expected from my end and we have rebalanced the impulsive price action that led to the all-time high.
What I appreciated from the price driving down into the discount zone was the reaction the market gave us, it has reacted positively and that specific price region has invited investors and firms like Michael Saylor (MicroStrategy) to reinforce their position and increase their Bitcoin holdings.
Will the market explode as soon as the rate cuts news is released? I don't think so.
The market will experience liquidity stress, especially with how the economy is holding up at the moment and the 'almost certain' news outcome to both retail and institutional.
We may see spikes towards both directions, so my advice? Wait for the market to cool down once the news is released and position yourself accordingly.
The news will give us a direction until the end of the year, giving you a clear bias.
Trade safely and good luck to all!

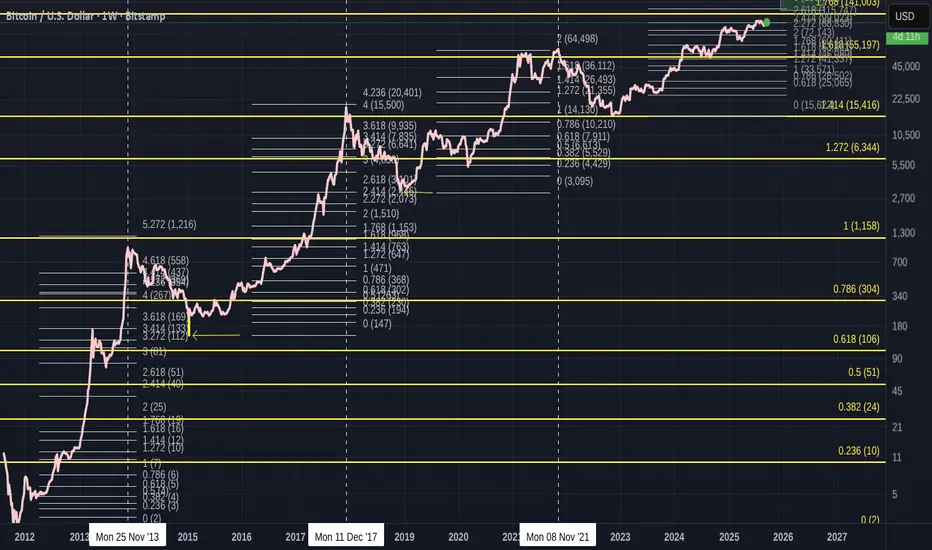
Bitcoin Global / Local Fib Levels point to the TOP area to watch
Each Low to ATH has a "Local" Fib extension Set
And the Yellow Fib extension is from the 2011 Low to the 2013 ATH and I use this as a "Global" Fib as that was, in reality, the first ever Low to ATH before a sustained draw back.
Please Note that as Candles would not show very clearly at this scale, I have used a Line. This has some inaccuracy as to true candle Ends. As a result, it looks like some Fibs are misplaced but I assure you, each are placed accurately, using candles and then the Line is used.
The Fibs are accuratly placed.
Local Fib extension ATH Fib number
2013 November - 5.272
2017 December - 4.236
2021 November - 2
2025 Current just above 2.618
Global Fib extension ATH number
NOTE- See on chart how ATH is just above this Fib level, except for Fib 1.
2013 November - 1
2017 December- 1.414
2021 November - 1.618
2025 Current Fib just below 1,758 - if we follow trend, I expect ATH to be using this 1.768 line, the next in sequence of Fib numbers.
Local Fib charts
2011 low to 2013 ATH
2015 low to 2017 ATH
2019 low to 2021 ATH
2023 low to current position
To me, there are a number of things to see here.
More than anything, what is plain to see is how Bitcoin has used the Global Fib numbers like stepping Stones. Currently just below the 1.768, which is the next in sequence. ( Yellow lines )
All but the First ATH were recorded just above the Global Fib lines ( the First was on the line ) and I have little doubt we will do this again.
And if we look at the pattern of the Local Fib lines, we can see that we missed the 3.236 line in 2021
We went from 5 to 4 to 2. ( ignoring the 236 bit for now.)
We missed 3
See how the first 2 Local Fibs dropped by nearly one complete Fib number, from 5.272 to 4.236
By the time we headed towards the 2021 ATH, the market accelerated hugely, mostly due to the idea of Get Rich quick and no tax rules..GREED WAS UPMOST.
Even at the time, I considered this cycle Abnormal. Many charts show why, and I will not expand further here.
The Local Fib level for that run was distorted by the swift recovery from the low in 2019.
While this was not a bad thing, it changed the cycle dynamics.
This cycle, currently, we have returned to a more sensible approach and we appear to be heading to the 3 local Fib zone, maybe as we should have done in 2021.
This also happens to be just above the 1.768 Global Fib line, The next expected Global ATH line.
So, we are currently approaching that 1.7668 Global Fib line and we can expect the ATH to be above this, if we follow the previous 2 ATH.
And if we go above that Global line the same as we have in the last 2 previous cycles, we find the Local 3 Fib extension.
IF we were to follow previous, this could be expected ro be the 3.236, at around 190K
I think this is doubtful and maybe the 3 itself is more realistic at 155K
So, there you have it.
Bitcoin and its Fibs have a pattern, it get broken and it looks like it is trying to regain that pattern.
And this is all done by Humans trading........
Astounding.
and that 2 Global Fin line in 2029 ? Will we get there ?
Given the introductions of ETF and Corprate Long term holders....Will we see a bear market before we rech that 2 Global Fib ?
So many questions...
One real answer is BUY BITCOIN AND HOLD ON TO IT
BTC - WEEKLY OUTLOOK 🚀 #BITCOIN - Weekly Price Update 🚀
Trend: Bullish on the monthly chart, still marching higher!
Weekly outlook: The charts are flashing a bull‑continuation signal, but we’ll need next week’s candles to lock it in.
Daily vibe: Neutral territory.
Key daily resistance zones:
🔹 118,500 $
🔹 120,000 $
🔹 123,000 $ – 123,500 $
Right now the bulls dominate above 107k $ and 100k $. If we keep consolidating there, a fresh all‑time high could erupt soon.
Short‑term forecast: Expect a few sideways days with occasional rejections 📉.
My take:
🔸 A retest around 112,500 $ –-112,000 $ looks likely next.
🔸 For a solid long‑term play, we need a weekly candle closing above 120,000 $ backed by strong buying volume, that’s the green light for the next big upward wave!
🌐 #ALTS - Altcoin Market
With Bitcoin holding steady above the 110k $ mark, altcoins stand to gain from the added stability and resilience.
💡 Stay tuned, keep those alerts on, and ride the momentum!

BTC 2017 All Over Again? Is It About to Go Parabolic?Forbes just ran with a headline about a Bitcoin “death spiral.” The wording might be sensational, but the risk they are pointing to is real. It is sitting inside Bitcoin treasuries.
Companies like MicroStrategy (NASDAQ:MSTR) and Nakamoto are being packaged as safe institutional gateways to Bitcoin. The truth is, they are not just buying and holding. They are borrowing, issuing debt, and selling shares to continue buying more BTC. That structure works brilliantly when the price is running higher. When BTC pulls back, the debt remains while the value of the collateral falls. If their share prices sink at the same time, they cannot raise fresh equity. That is when forced selling begins, and the pressure feeds on itself.
This is where the LUNA comparison fits. LUNA collapsed because the system relied on TWAP buying to keep its peg alive. It needed a constant programmed demand. The second confidence cracked that demand disappeared, the mechanism broke, and the whole structure fell into a reflexive death spiral. Bitcoin treasuries carry a similar fragility.
They look strong on the way up because debt and dilution keep the system fed. But if one cracks, others will likely follow, and the forced selling could cascade through the market. It is history repeating in a new form.
The Cycle Overlap
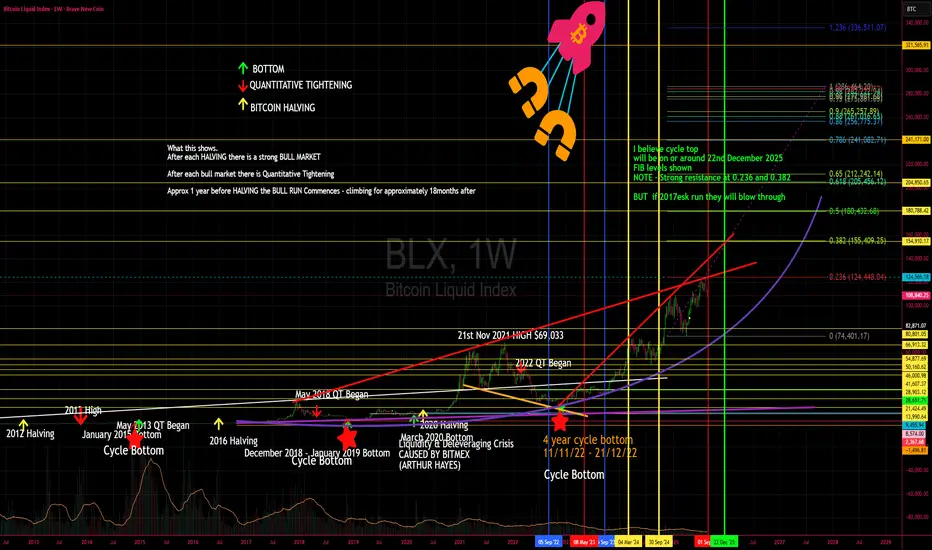
Now layer in the cycles. December 2024 marked the rollover of the 8-year stress cycle in traditional markets. That signal has already triggered. But treasuries are not following that rhythm. They are moving in line with Bitcoin’s 4-year cycle. Every halving is followed by a strong run, a cycle top, and then a correction. That puts the real pressure point into December 2025. If treasuries hit the wall at the same time Bitcoin’s bull cycle peaks, the overlap could accelerate a blow-off followed by a brutal correction.
The 8-Year Stress Cycle (Traditional Markets)
2000 → Dot-com bubble rollover. Fed started cutting rates, but equities crashed hard into 2001–2002.
2008 → Global Financial Crisis. Fed slashed rates aggressively, but markets fell into a full-blown meltdown before recovery. 2009 was the brutal washout before recovery.
2016 → Global growth scare, China devaluation, Fed hiking cycle wobble. Markets pulled back, stress showed, then liquidity stepped in.
2024 → December rollover. The signal of cracks returning: inflation sticky, rate cuts being prepped, credit stress building, and leveraged players under pressure.
The pattern - every 8 years, traditional markets hit a rollover point where stress shows up, liquidity shifts, and the system resets.
The 4-Year Bitcoin Cycle
2013 → Top after 2012 halving, deep correction.
2017 → Top after 2016 halving, brutal correction in 2018.
2021 → Top after 2020 halving, correction in 2022.
2025 → Halving cycle points to a top window in December 2025, with correction risk into 2026.
Where Tether Fits
Tether (CRYPTOCAP:USDT) is not just minting stablecoins. It has become one of the largest buyers of short-dated US Treasuries on the planet, with more than 120 billion US dollars worth on its books.
In calm conditions, that makes sense, they clip yield and backstop redemptions. But if markets crash and liquidity dries up, redemptions spike. To meet them, Tether must raise dollars by selling or repo’ing those T-bills. Normally, that is seamless. In stress, selling can add to liquidity drains at the edges of both the Treasury market and crypto. If redemptions surge at the same time treasuries are being forced to sell BTC, you get a double liquidity squeeze.
The Technical Picture
Look at the Fibonacci structure on the chart. The key levels line up with what could be a wave 3 of 3 in Elliott Wave terms — the most explosive part of any trend. That explains the sharp upside move this year. It is powerful, but it is also the phase where leverage and euphoria get stretched the furthest. If this lines up with treasuries cracking and Tether redemptions spiking, the volatility on both sides will be extreme.
2016–2017 vs 2024–2025
In 2016, traditional markets were rattled by China’s devaluation, an oil price collapse, and Fed policy missteps. Liquidity reset the system. For Bitcoin, that reset coincided with the halving and set up the most explosive run in its history. By 2017, equities were making new ATHs and Bitcoin went parabolic to nearly $20k before the brutal 2018 correction.
Now in 2025 we are seeing the same setup. Stress triggered in December 2024, but liquidity is flowing back. Markets everywhere are hitting new ATHs. Bitcoin has surged and is acting like it is in its 2017 phase right now, the blow-off leg of the 4-year cycle.
That puts the risk squarely into December 2025 for a cycle top followed by a correction.
The Cycle Top Target
I believe the cycle top for Bitcoin will land on or around 22nd December 2025.
The Fibonacci levels line up cleanly with this window:
Strong resistance at 0.236 and 0.382.
Under normal conditions, these zones would cap the move, but if we are truly in a 2017-style run, price can blow straight through them in a parabolic surge before the eventual correction. Fibs left on the chart for reference.
Key points
BTC treasuries are leveraged and debt-loaded.
Many treasuries exist, not just one, so cascades are possible.
December 2024 = 8-year rollover in traditional markets.
December 2025 = 4-year BTC cycle top window.
Tether can flip from stabiliser to amplifier if redemptions rise.
Fibonacci shows a potential wave 3 of 3, explosive but unsustainable.
2025 mirrors 2017: markets at ATHs, Bitcoin in parabolic mode.
Target: 22nd December 2025 as the likely top.
Stop losses and capital protection are critical.
It looks like BTC 2017 all over again.
The parabolic phase may not be finished yet, but the closer we get to December 2025, the sharper the risk of a brutal correction. This is not Bitcoin dying. This is a test of leverage and liquidity. If treasuries and Tether both get squeezed into the cycle top, the correction could be brutal. But as always, it will clear the field for the next 4-year cycle if you survive the next brutal 2026 BEAR Market.
Thanks for Reading, and please let me know your thoughts
<3 Lisa
Bitcoin - It is bullish either way!💎Bitcoin ( CRYPTO:BTCUSD ) still remains bullish:
🔎Analysis summary:
Yes, over the past couple of days we have been seeing a quite negative correction on Bitcoin. However, looking at the higher timeframe, Bitcoin remains totally bullish. So even if Bitcoin continues with the recent correction, it would ultimately result in a bullish all time high break and retest.
📝Levels to watch:
$60.000
SwingTraderPhil
SwingTrading.Simplified. | Investing.Simplified. | #LONGTERMVISION

UPDATES ON BITCOIN.As previously stated, Bitcoin is respecting structure and direction based on previous analysis, which suggests sellers are still in control, but in the short term, as we are headed further downwards, keep watching! {Not Financial Advice, trade responsibly}

Analytics: Market outlook and forecasts
📈 WHAT HAPPENED?
Last week, Bitcoin continued its upward movement to the resistance zones. However, the seller didn’t show any activity, and the market only paused.
We’re currently trading in a narrow sideways pattern, but the buyer still has the initiative, despite being in the selling zone.
When trying to resume sales, there was a confident absorption at the $115,000 level, as shown on the cluster chart. We noted this level in our review on TradingView.
💼 WHAT WILL HAPPEN: OR NOT?
The priority scenario is an upward exit and a test of the next resistance level within today.
However, there is still a high probability of a sharp correction. Trading volumes have decreased, and seller activity could trigger a sharp downward move to the $111,000 level at any time.
The Federal Reserve meeting and interest rate decision on September 17 could increase volatility and the likelihood of a test of lower levels. Therefore, it is important to exercise caution when opening any positions this week.
Buy Zones:
$114,300–$113,500 (volume zone)
$111,600–$110,500 (accumulated volumes)
~$108,400 (cluster anomalies)
$108,000–$102,500 (accumulated volumes)
Sell Zones:
$117,500–$119,000 (accumulated volumes)
$121,200–$122,200 (buy absorption)
📰 IMPORTANT DATES
This week, we’ll be following these macroeconomic events:
• September 16, Tuesday, 12:30 (UTC) — publication of the volume and core index of US retail sales for August;
• September 17, Wednesday, 6:00 (UTC) — publication of the UK consumer price index for August;
• September 17, Wednesday, 9:00 (UTC) — publication of the Eurozone consumer price index for August;
• September 17, Wednesday, 13:45 (UTC) — announcement of the Canadian interest rate decision;
• September 17, Wednesday, 18:00 (UTC) — statement and economic forecasts from the US FOMC, as well as announcement of the US Federal Reserve interest rate decision;
• September 17, Wednesday, 18:30 (UTC) — US FOMC press conference;
• September 18, Thursday, 11:00 (UTC) — UK interest rate decision announcement;
• September 18, Thursday, 12:30 (UTC) — release of the US initial jobless claims and the US Philadelphia Fed's September Manufacturing Activity Index;
• Friday, September 19, 3:00 (UTC) — announcement of Japan's interest rate decision.
*This post is not a financial recommendation. Make decisions based on your own experience.
#analytics
Bitcoin : Stay heavy on positionsBitcoin : Stay heavy on positions (2x~3x)
Maintaining the same outlook as before.
** This analysis is based solely on the quantification of crowd psychology.
It does not incorporate price action, trading volume, or macroeconomic indicators.

BitCoin $BTC weekly demand from $110,500 is playing out wellBitCoin CRYPTOCAP:BTC weekly demand from $110,500 is playing out well. Trying to reach the resitance level overhead and hopefully break all-time highs.

Bitcoin Roadmap | Short termBitcoin ( BINANCE:BTCUSDT ) has been experiencing a lot of volatility over the past 10 days, and the reasons for these movements could be the announcement of US indices + geopolitical issues Those who were in favor of Bitcoin caused Bitcoin to pump .
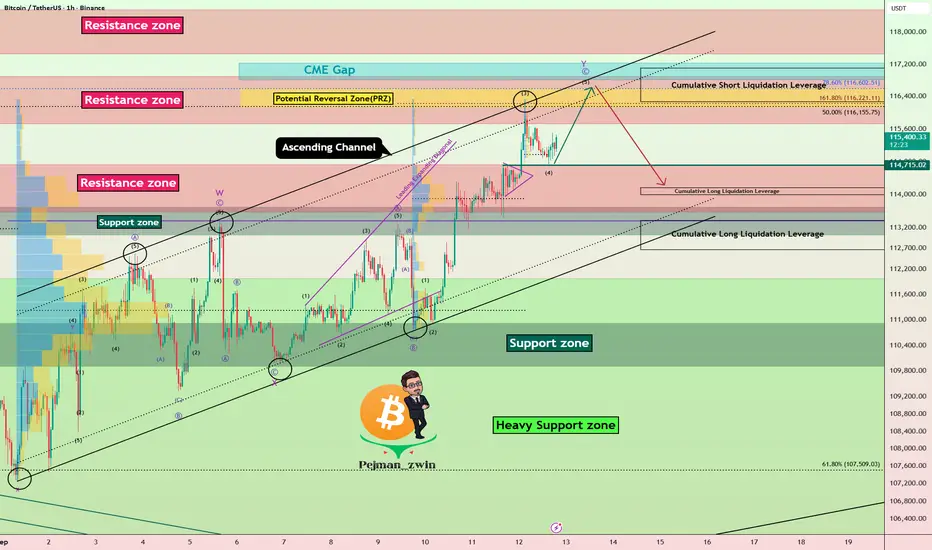
Bitcoin's movements over the past 10 days have managed to form an Ascending Channel .
In terms of Elliott Wave theory , Bitcoin appears to be completing microwave 5 of microwave C of the main wave Y .
I expect Bitcoin to try to complete main wave Y , and if we find signs of a reversal in the Resistance zone($116,900-$115,730) and Potential Reversal Zone(PRZ) , we can expect a further decline . Also, it is expected that the CME Gap($117,235-$116,820) will eventually be completed in the main wave Y .
Cumulative Long Liquidation Leverage: $114,165-$113,989
Cumulative Long Liquidation Leverage: $113,370-$112,664
Cumulative Short Liquidation Leverage: $117,102-$116,266
Please respect each other's ideas and express them politely if you agree or disagree.
Bitcoin Analysis (BTCUSDT), 1-hour time frame.
Be sure to follow the updated ideas.
Do not forget to put a Stop loss for your positions (For every position you want to open).
Please follow your strategy and updates; this is just my Idea, and I will gladly see your ideas in this post.
Please do not forget the ✅' like '✅ button 🙏😊 & Share it with your friends; thanks, and Trade safe.
BITCOIN PREDICTION: NOBODY is EXPECTING THIS!!! (this will hurt)Yello Paradisers! In this video, we are going through multiple timeframes. We are taking a look at the CME futures gap that has closed. As professional traders, we are going through the ultra-high timeframe chart I'm sharing with you, including the channel reclaim and retest, the bearish divergence, and the decrease in volume. On a high timeframe chart, I'm sharing with you the zigzag.The possible start of the impulse is now in the secondary wave. The bearish divergence means we need to wait for a cross, a shooting star candle on the daily, and nice volume as well. If we look at the medium timeframe, we are seeing the bearish divergence, plus the cross, plus the resistance, the Elliott wave, the shooting star, and the double top formation.
Paradisers! Keep in mind to trade only with a proper professional trading strategy. Wait for confirmations. Play with tactics. This is the only way you can be long-term profitable.
Remember, don’t trade without confirmations. Wait for them before creating a trade. Be disciplined, patient, and emotionally controlled. Only trade the highest probability setups with the greatest risk to reward ratio. This will ensure that you become a long-term profitable professional trader.
Don't be a gambler. Don't try to get rich quick. Make sure that your trading is professionally based on proper strategies and trade tactics.

Bitcoin Next Step Towards LiquidityI guessed a little wrong with the time. But the probability theory works as usual. Because the thoughts of the market maker cannot be guessed more accurately.

Bitcoin Price’s Grip on $115,000 Weakens—Here's the RiskBitcoin is trading at $114,770, slipping below the $115,000 support level in the process. Should bearish sentiment persist, BTC may fall further, potentially testing the uptrend line that has supported its rise since the start of the month. This would mark a crucial point for investors.
If selling pressure intensifies, Bitcoin could struggle to hold $115,000 as support and slide toward $112,500. This would represent a critical setback, reinforcing the ongoing distribution phase observed among holders and limiting near-term upside potential for BTC.
On the other hand, if Bitcoin absorbs the selling pressure and regains momentum, reclaiming $115,000 as support could trigger another rally. In this case, BTC would target $117,261 in the coming days, reaffirming its bullish outlook and reinforcing investor confidence.

Bitcoin & Ethereum Daily Analysis|Ready for Wednesday’s Fed News📊 In today’s daily Bitcoin & Ethereum analysis, we break down the critical levels to watch before Wednesday’s Federal Funds Rate decision.
🔥 Will the Fed’s move push Bitcoin into a new uptrend — or trigger a sharp correction?
👉 Stay tuned as we explore the multi-timeframe structure, key triggers, and setups you can actually use.

Bitcoin Price To Climb Higher Amid Rising Institutional AdoptionBitcoin Price To Climb Higher Amid Rising Institutional Adoption, Yet Ethereum's Relative Value Puzzles Investors
The digital asset landscape presents a fascinating dichotomy. Bitcoin, the undisputed leader, appears poised for a significant ascent, with analysts increasingly confident in a rally toward the coveted $120,000 mark. This optimism is overwhelmingly fueled by a powerful and sustained wave of institutional adoption, underscored by staggering inflows into U.S. spot Bitcoin Exchange-Traded Funds (ETFs). However, a perplexing counter-narrative is unfolding with Ethereum. Despite its own significant institutional embrace and the successful launch of its own ETFs, the ETH/BTC price ratio remains stubbornly low, signaling a relative weakness against Bitcoin that has left many investors searching for answers.
Bitcoin's Bullish Momentum: The Unstoppable Force of Institutional Capital
The sentiment surrounding Bitcoin is palpably bullish. After a period of consolidation, the cryptocurrency has shown remarkable resilience, holding key support levels and demonstrating renewed strength. Bitcoin is trading at elevated levels, with technical analysts and market experts setting their sights on the next major psychological barrier of $120,000. A sustained break above this level is widely expected to trigger a fresh wave of buying pressure, potentially propelling the price toward new all-time highs.
A flurry of price predictions from various financial institutions and seasoned analysts paints a picture of widespread optimism. Forecasts range from conservative six-figure targets to highly bullish projections well above $200,000. These predictions are united by a common thread: the transformative impact of institutional adoption.
The primary engine driving this bullish outlook is the unprecedented success of U.S. spot Bitcoin ETFs. These investment vehicles have served as a regulated and accessible bridge for institutional capital to flow into the digital asset space. Recent weekly net inflows have been measured in the billions of dollars, reversing previous outflows and signaling a renewed and voracious investor appetite. Leading funds from major asset managers have been the primary beneficiaries, consistently attracting hundreds of millions in fresh capital.
This influx of institutional money represents a fundamental shift in how Bitcoin is perceived. Major institutions are actively adding exposure and incorporating Bitcoin into their long-term investment strategies. This is evidenced by the behavior of "whales"—large Bitcoin holders—who have been accumulating significant amounts, viewing price dips as buying opportunities. The growing institutional presence is also contributing to a reduction in Bitcoin's notorious volatility, making it a more attractive asset for diversified portfolios.
Further bolstering the bullish case are favorable macroeconomic conditions. With expectations for lower interest rates, the appeal of risk assets like Bitcoin is on the rise. A weaker U.S. dollar and lower borrowing costs historically create a fertile environment for assets with a fixed supply to thrive. The confluence of massive ETF inflows, strategic institutional accumulation, and a supportive macroeconomic backdrop has created a powerful tailwind for Bitcoin.
The Ethereum Conundrum: High Adoption, Low Ratio
While Bitcoin basks in the glow of institutional validation, the story for Ethereum is more nuanced. On the surface, Ethereum is experiencing its own institutional renaissance. The approval of spot Ethereum ETFs has been met with considerable enthusiasm, attracting billions in capital and providing a regulated pathway for traditional investors to gain exposure to the world's leading smart contract platform.
The inflow data for Ethereum ETFs has been impressive, at times even surpassing Bitcoin's on a monthly basis. Cumulative inflows have reached a significant figure, a clear testament to the growing recognition of Ethereum's value proposition, which extends beyond a simple store of value to encompass the vast ecosystems of decentralized finance (DeFi), non-fungible tokens (NFTs), and real-world asset (RWA) tokenization.
Institutions are not just buying ETH through ETFs; they are also actively participating in the network's staking mechanism. An unprecedented surge in staking activity has seen a significant portion of ETH's circulating supply locked away to secure the network and earn yield. This "supply squeeze" is fueled by both institutional players and large individual holders, underscoring the long-term conviction in Ethereum's future. With a large percentage of the total supply staked, the available liquidity on exchanges has dwindled, a factor that would typically be expected to exert strong upward pressure on the price.
Given this backdrop of robust adoption, significant ETF inflows, and a tightening supply, one would expect Ethereum to be gaining ground on Bitcoin. However, the ETH/BTC price ratio, a key metric that reflects the relative value of Ethereum to Bitcoin, tells a different story. This ratio has remained stubbornly below the 0.05 mark, a level that signals relative weakness for ETH. It currently hovers at a low level, far from its historical peak.
This persistent underperformance is a source of considerable debate. A higher ratio indicates that ETH is appreciating faster than BTC. The current suppression suggests that while absolute demand for Ethereum is strong, the demand for Bitcoin is even stronger.
Several factors may be contributing to this conundrum. Bitcoin's established brand and its narrative as "digital gold" give it a powerful first-mover advantage, particularly among institutional investors taking a conservative, phased approach. For many, Bitcoin is the initial and primary allocation.
Secondly, Ethereum's utility introduces complexities and risks compared to Bitcoin's simpler value proposition. The ongoing evolution of the network, while bullish long-term, may present a steeper learning curve for some investors.
Furthermore, a historical trend of Bitcoin outperforming Ethereum may have created market inertia, with capital continuing to flow into the asset with stronger recent relative performance. In essence, both assets are appreciating, but Bitcoin is doing so at a faster rate, keeping the ratio suppressed.
Beyond the Big Two: Other Trending Cryptos to Watch
While Bitcoin and Ethereum dominate, the broader cryptocurrency market is a hotbed of innovation. Investors are exploring a diverse range of projects with potential for significant growth, driven by several key trends.
Layer-2 Scaling Solutions: As Ethereum faces demand-driven congestion, Layer-2 solutions have become indispensable. Projects offering faster, cheaper, and more scalable environments for decentralized applications are capturing a growing share of activity and represent a crucial investment theme for ecosystem growth.
Integration of Artificial Intelligence and Blockchain: The convergence of AI and blockchain is gaining considerable traction, creating new possibilities in automated trading, decentralized organizations, and sophisticated dApps. Projects leveraging AI to enhance blockchain capabilities are attracting significant attention.
Tokenization of Real-World Assets (RWA): This is poised to be one of the most transformative trends. Representing physical assets like real estate and commodities as digital tokens on a blockchain has the potential to unlock trillions in illiquid assets, making them more accessible and tradable globally. This is expected to drive a new wave of adoption.
Meme Coins and Community-Driven Projects: While often speculative, meme coins continue to exert significant influence, demonstrating the power of community and viral marketing. Their enduring popularity highlights the importance of cultural relevance in the crypto space.
The altcoin market is characterized by higher volatility and risk. However, for investors with a high-risk tolerance, it offers the potential for outsized returns based on technological adoption and market trends.
The Road Ahead: A Market at a Crossroads
The cryptocurrency market is a study in contrasts. The overwhelming force of institutional adoption is propelling Bitcoin toward potentially historic highs. The success of Bitcoin ETFs has fundamentally altered the market structure, creating a sustained demand that shows no signs of abating.
Conversely, the curious case of the ETH/BTC ratio serves as a reminder of the market's complexity. While Ethereum's own institutional story is compelling, it has yet to translate into sustained outperformance against Bitcoin.
Looking ahead, the market's trajectory will be shaped by key factors. Central bank monetary policy will continue to play a crucial role. The continued growth of the ETF market will be a primary indicator of institutional sentiment. And ongoing innovation in scaling, AI, and tokenization will determine the next generation of leading projects.
For investors, the current environment offers both immense opportunity and significant risk. The bullish case for Bitcoin appears robust, but volatility remains. Ethereum's long-term value is undeniable, but its short-to-medium-term performance relative to Bitcoin is less certain. The altcoin market holds promise but requires careful navigation.
In conclusion, the narrative of rising institutional adoption is powerfully reshaping the digital asset landscape. As Bitcoin bulls eye their next target, the broader market watches closely, navigating the crosscurrents of innovation, regulation, and macroeconomic forces that will define the future of this transformative technology.

BITCOIN HIGH PROBABILITY SETUP!!!🚨 BTCUSD HIGH PROBABILITY BUY SETUP 🚨
* Here We Can See The Next Potential Move For BTCUSD Coming Hours/Days.
* Keep Your Eyes Close On Your Trading Positions.
* Happy PIP Hunting Traders.
FXKILLA.

The ray of hope doesn't last longI think in about 2 hours we will see a new downward movement.
Only the market maker knows of course.
But these are calculations using probability theory.
Always look at all the details when analyzing, don't look at the fact that the candle is green.
It lures you psychologically to buy. But it's still early.
There are few liquidations on the market. They are not being written about yet.
There are still strong token inflows to the exchanges

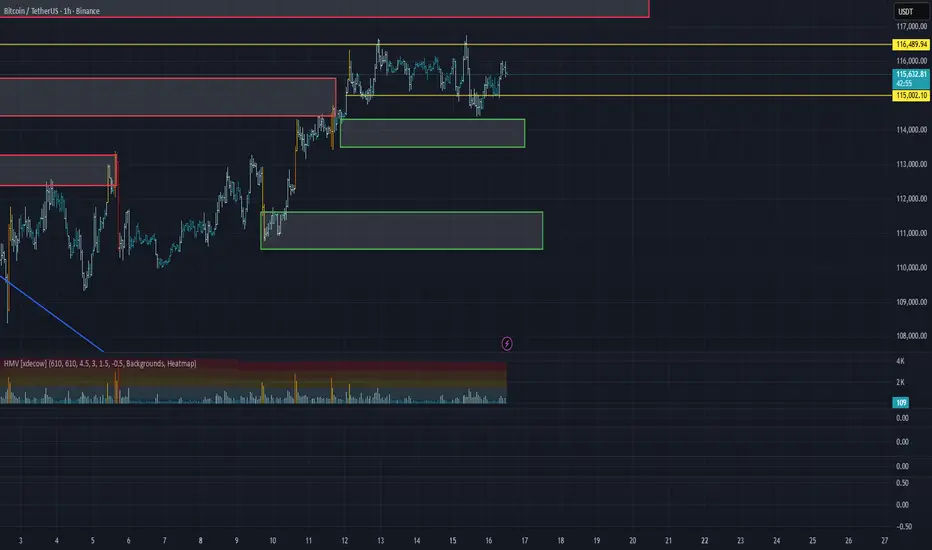
What I see...I assume an upward to around 119K and then down to get stable around 111K before breakout. How do you see the chart?

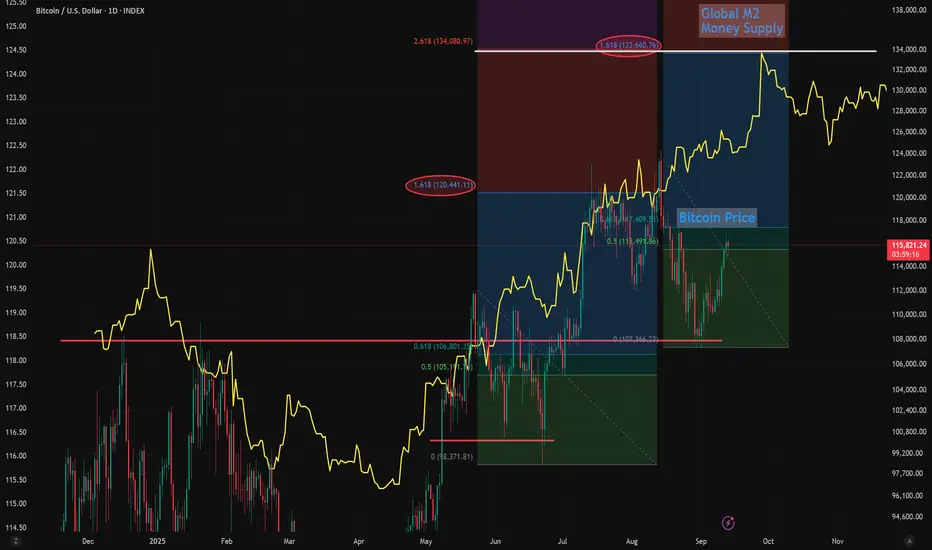
Global M2 and Bitcoin Fib Bounce Targets Point to $134K Next Global M2 has been leading Bitcoin which has been diverging, mostly due to an economic slowdown and waiting for interest rates to start dropping as a catalyst.
Since we're pricing in and high probability of 3 rate cuts starting in September, I expect Bitcoin to start pushing higher and several studies point toward $134k - $135k from here.
These Fibs studies aren't exactly correct, b/c I drew the high / low using the wiicks vs the real bocy, but still interesting.
The first Fib swing high/low correction forecast the pump to the 1.618 target.
So using the most recent high/low swing, points toward around $134k on the 1.618 which is coincidentally the 2.618 extension from the first Fibonacci.
My bull-flag targets on Bitcoin also point to a measured move of $134k-$135k as the next likely profit target, before another pullback and ultimately on the way to $150k this year I think.
Let me know your thoughts below.
- Brett