BTC/USD Eyes 50-Week EMA with Bearish MACD CrossoverSo, we just had a bearish cross on the MACD 1-Week chart.
Looking at the long history of BTC price action, this has happened 15 times. In 12 instances, this resulted in a pullback to the 50-Week EMA. In 3 other instances, price was already at or below the EMA and experienced even deeper drawdowns.
In the current cycle, this has already occurred 3 times. During the last cycle this happened 5 times, with the fourth crash marking the cycle top.
Conclusion: 100% of such MACD crossovers resulted in significant pullbacks to or well below the 50-Week EMA.
I hate to bear post, but charts are saying we dip to the 50-Week EMA in 1-5 weeks. Could be a good buying opportunity if price dips that low.
I am new to TA, so always happy to learn your thoughts and criticisms. NFA. DYOR.
Bitcoinprediction

Bitcoin Profits Hit 2-Month Low, How Are Investors Reacting?BINANCE:BTCUSDT current price is $111,653, falling through the $112,500 support level. This zone has held strong since early August, offering a key buffer against deeper losses. For now, price action shows consolidation rather than collapse.
In the span of one week, BINANCE:BTCUSDT profits have declined sharply, hitting a two-month low. The price drop has pushed several addresses out of profit, reducing overall realized gains. Such drawdowns often follow overheated conditions, which may have marked a recent market top.
Given the current sentiment and net accumulation, BINANCE:BTCUSDT could see a bounce to $115,000 . If buying pressure increases and macro support builds, BTC might stabilize above this resistance. Alternatively, it may continue to trade sideways between $112,500 and $115,000 until clarity returns.
However, if accumulation slows and selling resumes, BINANCE:BTCUSDT may drop to $110,000. A move this low would mark a near two-month bottom and could expose BTC to increased downside risk.

Bitcoin on Edge: Bearish Momentum Building Below $111,800🚨 Bitcoin Alert: Key Support Cracks! 🚨
Bitcoin has slipped below the crucial $111,800 support on the 4H chart, even as rate cut cues try to lift sentiment.
📉 If BTC closes another 4H candle under $111,800, this breakdown could gain momentum, eyeing the $105,000–$107,000 zone as the next major support area.
⚠️ Watch price action closely — failure to reclaim this level may accelerate the bearish move.

Analytics: market outlook and forecasts
📈 WHAT HAPPENED?
Last week, Bitcoin declined to a significant low of $112,000, where it formed a small false breakout.
Amid news of a potential key rate cut in September, the price broke through the descending trendline. The first volume zone was passed without a reaction; however, in the $117,200-$119,000 zone (accumulated volumes), Bitcoin corrected and subsequently found no support until it formed a new low.
The overall context is now shifting back to the bearish side. The key support zone of $110,000-$105,000 (accumulated volumes) has still not been tested, and its proximity makes this range a natural "magnet" for the price. At the same time, significant resistance levels based on volume have formed above the current price.
💼 WHAT WILL HAPPEN: OR NOT?
The current market situation appears highly manipulative, and the lack of reaction in the mirror volume zone around ~$115,000 only reinforces this impression.
We anticipate a test below the $110,000-$105,000 support zone. From this level, buyers will most likely resume their activity.
Buy Zones:
$110,000–$105,000 (accumulated volumes)
Sell Zones:
$114,400-$115,500 (volume zone)
~$116,500 (volume anomaly)
$117,200–$119,000 (accumulated volumes)
$121,200–$122,200 (buy absorption)
📰 IMPORTANT DATES
This week, we expect the following macroeconomic developments:
• Monday, August 25th, 14:00 (UTC) — US New Home Sales for July.
• Tuesday, August 26th, 14:00 (UTC) — US CB Consumer Confidence Index for August.
• Thursday, August 28th, 12:30 (UTC) — US GDP for Q2 and US Initial Jobless Claims for August.
• Friday, August 29th, 12:00 (UTC) — German Consumer Price Index (CPI) for August.
• Friday, August 29th, 12:30 (UTC) — US Core PCE Price Index for July and the year-over-year comparison (July 2024).
*This post is not financial recommendation. Make decisions based on your own experience.
#analytics

Bitcoin back at 112k: Bullish Illusion or Bearish Truth?1. What happened lately
In my previous BTC analysis, I mentioned that as long as the 110k zone holds, the bullish structure technically remains intact.
On Friday, Powell’s speech lifted the market precisely from that zone, as the possibility of rate cuts injected optimism across risk assets, including crypto.
2. The psychological trap
But here’s the question I keep asking myself: is this genuine strength, or just wishful thinking? I’ve said it many times — trade what you see, not what you hope for . And what the charts are showing right now is not as promising as the initial bounce might suggest.
3. Technical signals
- BTC quickly returned to the 112k support level, erasing the Friday rally.
- Price remains under the trendline that started in April.
- The bounce looks more like a retest of broken levels than a new impulsive leg.
- Structurally, we can even identify a head and shoulders pattern with the neckline around the 110k zone, although not perfectly shaped.
4. Reading between the lines
It’s hard for me to believe that Bitcoin came back to the same support just to give latecomers another easy buying opportunity. More likely, the “rate cut euphoria” was dead cat bounce, and the market is telling us something different than the headlines.
5. Conclusion
At this moment, I remain neutral in my positioning but leaning bearish in my outlook. Optimism is tempting, but discipline requires us to trust the charts, not our hopes.
And... if it looks like a duck, walks like a duck, and quacks like a duck… it’s probably a duck. 🦆

BTC: Trend or Trap? A Deep Dive AnalysisDisclaimer: In the past, my analyses have frequently deviated due to the erratic movements of BTC whales. Therefore, I advise you to read this study not as investment advice, but purely as a technical explanation.
With growing institutional interest in BTC (ETFs, corporate investments, etc.), I hope it will gain more stable potential. For this reason, I expect it to exhibit fewer "erratic" movements and become more predictable compared to the past. However, the manipulative strategies of large investors, whom we call "whales," have always been devastating for retail investors. Still, money talks, and we can't predict how whales will move. When taking a position, if you are not a large investor, I recommend you never forget that you are a small fish.
With the hope of long-term stability supported by ETFs and institutional investors, we can begin to examine BTC using classic technical tools.
When we look at the monthly timeframe over a wide period, a typical Elliott Wave structure stands out:
In compliance with all impulse rules, I believe BTC is about to complete the 5th wave. But when we look at the momentum oscillators, do they confirm this 5th wave?
Looking at the RSI value, while the price makes a new high, the RSI has formed a lower high. This indicates a bearish divergence.
If we were to check for a signal of a trend reversal or a decrease in wallet data:
Neither the wallet data nor the transaction volumes show an outlook that supports the chart's positive sentiment. Based solely on this data, it's plausible to say that a downtrend might begin.
I recommend that instead of immediately interpreting upward breaks at these levels as a "bull trend," you should first confirm whether it's a fakeout.
Volume and money flow indicators are signaling a clear lack of interest, consolidation, and energy accumulation. This environment provides a very suitable ground for a potential climactic volume. The longer the consolidation and low volume, the more violent the subsequent move can be.
Here too, the negative divergence is clearly visible.
In summary: Although the market appears strong and healthy from the outside, it is exhibiting an uptrend that is running out of energy from the inside. The record-breaking prices are creating a dissonant picture with the decreasing money flow and weakening volume momentum. This increases the probability that the trend is not sustainable and may soon experience exhaustion, a correction, or a reversal.
The ADX shows that the trend still maintains its strength.
The Aroon indicator signals that buyers remain strong while sellers continue to weaken.
When we include the Bollinger Bands and Keltner Channel, an interesting picture emerges:
Price-Volume-Momentum indicators → signal risk.
ADX, Aroon, Bollinger, and Keltner → suggest the trend remains strong.
As I said at the beginning, BTC has always had its "erratic" movements. We can interpret this contradiction as the schizophrenic behavior of an "anarchist" asset.
In short, in my opinion, the trend is not strong; on the contrary, it is weakening, and the chart does not fully reflect reality. However, we cannot say that the trend is completely over either. In a trend that seems to be forcing its way up, avoiding FOMO (Fear Of Missing Out) would be the wisest strategy.
Strategy and Risk Management
If you open a short position, you risk getting caught in a climactic volume, which is highly risky.
If you open a long position, you might find yourself falling off a cliff on the back of the trend after the final surges.
Therefore, what will protect you more than my or any other analyst's comments are your own stop-loss and take-profit strategies.
If the price moves upward contrary to my expectation, your loss would actually be "a profit you never had." However, if you remain in a trend that is about to fall, you are risking your existing capital. That is the real danger.
Always act based on your own observations; do not invest based on rumors. Proceed by taking minimum risk.
A potential M-Top (Double Top) formation is visible, nearing completion within the Bollinger and Keltner channels. The steps of the candle spikes on the band ("walking the bands") are clearly evident.
You can confirm whether the M-Top will complete—and whether it is truly an M-Top—with a monthly close below the current candle's low. If the closes extend down to the Bollinger Band (BB) midline, the possibility of the uptrend reaching figures like 160k–200k–300k would be eliminated, at least for this season.
For those willing to take risks:
It might be logical to determine a position at levels where the BB midline acts as support during the corrective moves that follow this close.
In a continued decline, the loss would be minimal.
In a newly emerging trend, maximum profit could be captured.
Indicators can be misleading when prices are at their peak. That's why I tried to interpret the indicators on the monthly period, as it is less prone to manipulation.
In terms of chart and candle patterns, my first impression on the monthly chart is these two candles, which I believe will form an Evening Star formation.
Before pointing to this formation, I want to draw attention to the harmonic pattern that the candle I suspect will form the Evening Star is drawing on the weekly timeframe.
If we assume that the yet-to-be-completed D-leg of the weekly harmonic pattern (which is forming within the monthly Evening Star) will find support at the Fibonacci 1.27 - 1.24 levels, in alignment with past accumulation zones, we can expect a chart like this to emerge in the coming weeks:
This means we could expect a resistance test between 132K and 127K on the retest of the harmonic pattern. If the simulation I've tried to draw materializes in line with technical measurements, the monthly Evening Star candle formation will also have been completed, thanks to the fractal harmonic pattern.
This would provide a confirmation that we can combine with many other patterns like the hanging man, double top, bull trap, etc.
Literally, this formation is expected to cause a decline. In that case, it could be a formational confirmation that substantiates the explanations we mentioned in the indicators section, such as climactic volume and fakeouts.
Of course, what I have said are inferences based on existing structures that have not yet occurred. This is a simulation graphic. I am trying to catch nascent formations to provide a perspective on potential future scenarios.
As we continue to simulate formations on the monthly period, another harmonic pattern, consistent with our previous measurements and analysis, can give us an idea about old supply zones.
The harmonic pattern above is the main pattern that encompasses the Evening Star and double top formations. In a way that supports the signals from indicators and oscillators, it can inform us about the support zones where prices might retreat.
Looking back, we can also see chart formations that literally told us the levels today's prices might reach.
When we depict the all-time price movements within a Fibonacci channel on the weekly timeframe, the all-time accumulation zones become apparent. Based on this channel data, we can predict that a potential retest could occur slightly below the 90K levels.
If, contrary to our expectations, prices form a new upward trend, I believe a new trend channel will form after the 140K levels by following this channel.
Note: This analysis is for informational purposes only and does not constitute investment advice.

Period of ETH outperformance vs BTC is almost overWe got a clean five wave up structure that topped with a bang in April 25
This is from when ETH has been outperforming BTC nicely.
We can see a very clean corrective three wave decline labelled as A down, B up, C down
The ratio BTC vs ETH is approaching my Target 2.
What that chart tells us is that most likely the period of ETF outperformance against BTC is almost over.
That does not necessarily means that BTC should start a big rally. It is possible that both, BTC and ETH would decline. But that chart suggests that BTC would hold better in that case.

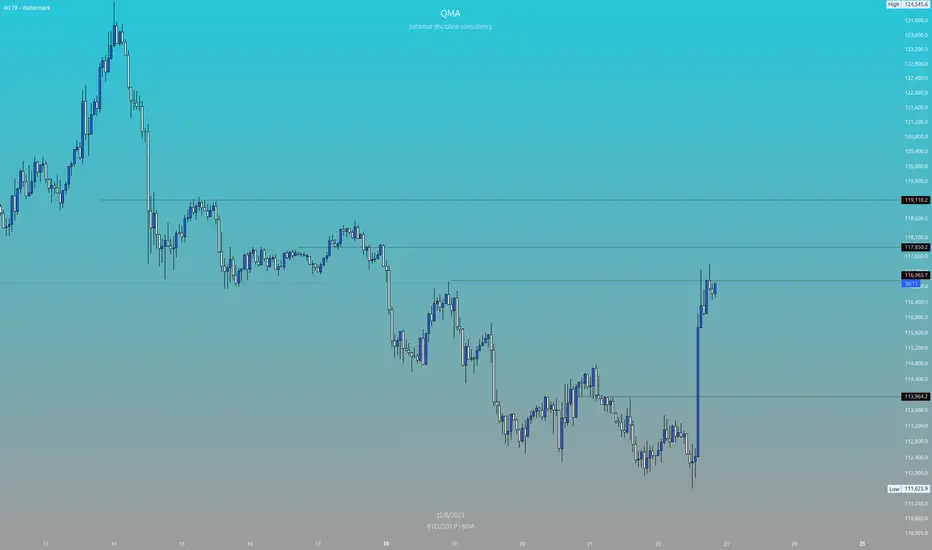
Bitcoin : Stay heavy on positionsThe market continues to hold support at the prior short-term overbought resistance zone, attempting to stage a rebound. I’ll maintain my position with the same outlook as before.
Bitcoin : Stay heavy on positions (2x)
** This analysis is based solely on the quantification of crowd psychology.
It does not incorporate price action, trading volume, or macroeconomic indicators.

BTCUSD LongBitcoin: Small Bull Flag After Structural Shift – Upside Targets Ahead
After last Friday’s bullish surge following Powell’s speech, Bitcoin has shifted structure and is currently consolidating in a small bullish flag. This pullback appears to be a healthy retracement of the previous impulsive move, setting the stage for another potential leg higher.
Key Levels to Watch:
Immediate Retracement Zone: $45,100 – a potential area to seek new long positions if price dips.
Upside Targets: Looking for a move first toward $117 (likely referring to $117K if BTC breaks ATHs), with an extended upside potential to $123K–$124K.
Macro Tailwinds:
The broader crypto market remains constructive. Expectations of interest rate cuts are fueling risk-on sentiment, which could further enhance upside momentum in crypto assets. Any confirmed dovish pivot or macro easing could accelerate flows into Bitcoin and the wider crypto space.
Trading Plan:
Watch for continuation patterns breaking to the upside, confirming the bull flag resolution.
Manage risk around invalidation zones below recent swing lows.

Bitcoin Explodes to $116,000 After Fed Speech SignalBitcoin Surges Past $116,000 as Federal Reserve Signals Historic Policy Shift
The cryptocurrency market experienced a dramatic reversal of fortune as Bitcoin rocketed past $116,000, recovering from a challenging period that had seen the digital asset touch six-week lows. The catalyst for this remarkable turnaround came from an unlikely source: Federal Reserve Chair Jerome Powell, whose dovish remarks at the prestigious Jackson Hole Economic Symposium sent ripple effects through global financial markets, fundamentally altering the trajectory for risk assets and digital currencies alike.
The Jackson Hole Moment That Changed Everything
In what many market observers are calling a pivotal moment for monetary policy, Jerome Powell delivered a speech that effectively cemented market expectations for an interest rate cut in September. The immediate reaction was nothing short of spectacular. Within minutes of Powell's comments hitting the wires, Bitcoin surged over 2%, climbing from approximately $114,200 to breach the psychologically significant $116,000 level. This rapid appreciation represented not just a technical bounce, but a fundamental reassessment of the cryptocurrency's near-term prospects in a changing monetary environment.
The significance of Powell's speech cannot be overstated. The Jackson Hole Economic Symposium has historically served as a platform for Federal Reserve chairs to signal major policy shifts, and this year proved no exception. Powell's carefully calibrated remarks suggested that the Federal Reserve's aggressive rate-hiking cycle, which had been implemented to combat persistent inflation, might finally be approaching its conclusion. For Bitcoin and the broader cryptocurrency ecosystem, which had struggled under the weight of tighter monetary conditions for much of the past two years, this represented a potential game-changer.
The market's interpretation was unambiguous. Federal funds futures immediately repriced to reflect a 90% probability of a rate cut at the September Federal Open Market Committee meeting, up from roughly 70% before Powell's speech. This dramatic shift in expectations triggered an immediate reallocation of capital across asset classes, with risk assets being the primary beneficiaries and the US dollar experiencing notable weakness.
A Broader Market Rally Takes Shape
While Bitcoin's surge captured headlines, the positive sentiment extended far beyond the cryptocurrency market. Ethereum, the second-largest cryptocurrency by market capitalization, staged an even more impressive recovery, rebounding 8% after having endured a painful 12% correction in the preceding sessions. This outperformance by Ethereum suggested that investors were not merely buying Bitcoin as a hedge against monetary policy uncertainty, but were expressing renewed confidence in the broader digital asset ecosystem.
Traditional financial markets also responded enthusiastically to Powell's dovish pivot. US equity indices gained approximately 1%, with technology stocks leading the advance. The yield on benchmark Treasury securities dropped to 4.27%, reflecting bond traders' expectations for a less restrictive monetary policy stance going forward. Gold, that traditional safe-haven asset and frequent competitor to Bitcoin for investor attention, rose 0.6%, demonstrating that the appetite for alternative stores of value remained robust even as risk sentiment improved.
This synchronized movement across asset classes highlighted an important dynamic that has become increasingly evident in recent years: the growing correlation between cryptocurrency markets and traditional financial assets during periods of significant monetary policy shifts. While Bitcoin was originally conceived as an uncorrelated asset that would provide portfolio diversification benefits, its behavior during major macro events has increasingly mirrored that of other risk assets, particularly growth-oriented technology stocks.
Understanding the Whale Dynamics
Beneath the surface of the price action, on-chain data revealed fascinating insights into how different market participants positioned themselves ahead of Powell's speech. Most notably, Bitcoin whales – entities holding large quantities of the cryptocurrency – had been quietly accumulating during the recent downtrend. According to blockchain analytics, these major holders added approximately 16,000 BTC to their positions during the period of price weakness, suggesting that sophisticated investors saw value at lower levels and were positioning for exactly the type of policy-driven rally that ultimately materialized.
This accumulation pattern by whales deserves closer examination, as it often serves as a leading indicator for future price movements. The fact that these large holders were adding to positions while retail investors were capitulating speaks to a divergence in market sentiment that often precedes significant trend changes. The 16,000 BTC accumulation represents over $1.8 billion at current prices, demonstrating serious conviction among institutional and high-net-worth investors about Bitcoin's medium-term prospects.
The whale accumulation also highlights the maturation of Bitcoin markets. Unlike the wild speculation that characterized earlier cycles, current market dynamics show signs of more sophisticated trading strategies and longer-term investment horizons. These large holders appear to be treating Bitcoin less as a speculative vehicle and more as a legitimate asset class worthy of strategic allocation within diversified portfolios.
The Federal Reserve's Delicate Balancing Act
The enthusiasm surrounding Powell's dovish turn must be tempered with an understanding of the complex challenges facing the Federal Reserve. Some cryptocurrency strategists have sounded alarm bells, warning that a significant Bitcoin surge could potentially clash with the Fed's broader economic goals. If cryptocurrency markets experience excessive speculation leading to wealth effects that stimulate consumer spending, this could complicate the Fed's efforts to bring inflation back to its 2% target.
This concern is not without merit. The cryptocurrency market's total capitalization now exceeds $2.5 trillion, making it large enough to have meaningful macroeconomic impacts. A sustained rally in digital assets could create wealth effects that filter through to the real economy, potentially reigniting inflationary pressures just as the Fed believes it has gained the upper hand in its fight against rising prices. This dynamic creates a fascinating feedback loop where the very monetary policy easing that benefits Bitcoin could ultimately be constrained by Bitcoin's success.
Furthermore, the Federal Reserve must consider the international implications of its policy decisions. A weaker dollar resulting from rate cuts could have significant consequences for global trade and financial stability. Many emerging market economies have dollar-denominated debt, and a rapidly weakening dollar could create challenges for these nations. Additionally, other major central banks might be forced to adjust their own policies in response to Fed actions, potentially triggering a global easing cycle with unpredictable consequences.
Technical Analysis and Market Structure
From a technical perspective, Bitcoin's surge past $116,000 represents a significant development in market structure. The cryptocurrency had been trading in a descending channel for several weeks, with each rally attempt meeting selling pressure at lower highs. The Powell-induced breakout decisively violated this bearish pattern, suggesting a potential trend reversal is underway.
However, technical indicators present a mixed picture that warrants careful consideration. The Bitcoin Bull Score Index, a composite metric that aggregates various momentum and sentiment indicators, has been signaling fading momentum despite the recent price surge. This divergence between price action and underlying momentum suggests that while the immediate reaction to Powell's speech was strongly positive, questions remain about the sustainability of the current rally.
Volume patterns also deserve attention. The surge past $116,000 occurred on elevated but not exceptional volume, suggesting that while there was genuine buying interest, we haven't yet seen the kind of capitulation from bears or FOMO from sidelined buyers that typically characterizes major trend changes. This could mean that the market is still in the early stages of processing the implications of the Fed's policy shift, with more significant moves potentially ahead as participants fully digest the changing macro landscape.
Support and resistance levels have also shifted following the breakout. The $114,000-$115,000 zone, which previously acted as resistance, should now serve as support on any pullbacks. Above current levels, the next major resistance lies around $120,000, which represents both a psychological level and the site of significant selling during previous rallies. How Bitcoin behaves around these key levels in coming sessions will provide important clues about the strength of the current uptrend.
The Broader Implications for Cryptocurrency Adoption
Beyond the immediate price implications, the Federal Reserve's policy shift could have profound effects on cryptocurrency adoption and development. Lower interest rates reduce the opportunity cost of holding non-yielding assets like Bitcoin, making them relatively more attractive compared to traditional fixed-income investments. This dynamic could accelerate institutional adoption of cryptocurrencies as portfolio diversifiers.
Moreover, a more accommodative monetary policy environment could reignite interest in decentralized finance (DeFi) protocols, which had seen diminished activity during the period of rising rates. Lower rates in traditional finance make the yields available in DeFi more competitive, potentially driving renewed capital flows into these innovative financial platforms. This could create a virtuous cycle where increased DeFi activity drives demand for cryptocurrencies like Ethereum, which serves as the backbone for most DeFi applications.
The changing monetary landscape also has implications for central bank digital currency (CBDC) initiatives. As traditional monetary policy tools become less effective in a low-rate environment, central banks might accelerate their exploration of CBDCs as alternative mechanisms for implementing monetary policy. While CBDCs could potentially compete with cryptocurrencies in some use cases, they might also serve to legitimize digital currencies more broadly, ultimately benefiting the entire ecosystem.
Risk Factors and Considerations
Despite the current optimism, several risk factors could derail Bitcoin's bullish momentum. First, the Federal Reserve's commitment to rate cuts is contingent on continued progress in reducing inflation. Any resurgence in price pressures could force the Fed to maintain or even increase rates, potentially triggering another leg down in cryptocurrency markets.
Regulatory risks also remain omnipresent. While the regulatory environment for cryptocurrencies has generally improved in recent years, with the approval of Bitcoin ETFs and growing institutional participation, the potential for adverse regulatory actions remains. Any major regulatory crackdown, particularly in the United States or European Union, could quickly reverse current gains.
Geopolitical tensions represent another wildcard. While Bitcoin has sometimes benefited from geopolitical uncertainty as investors seek alternatives to traditional financial systems, extreme events could trigger broad-based risk aversion that negatively impacts all speculative assets, including cryptocurrencies. The ongoing conflicts in various regions and tensions between major powers create an environment where sudden shocks remain possible.
Technical vulnerabilities within the cryptocurrency ecosystem itself also warrant consideration. While Bitcoin's network has proven remarkably resilient over its history, the broader cryptocurrency space has experienced numerous hacks, exploits, and technical failures. Any major security breach or technical failure could undermine confidence and trigger selling pressure across digital assets.
Market Psychology and Sentiment Dynamics
The psychological aspect of the current rally deserves special attention. After months of ranging price action and failed breakout attempts, many market participants had grown pessimistic about Bitcoin's near-term prospects. The sudden reversal triggered by Powell's speech has likely caught many traders off-guard, potentially setting up a powerful short squeeze as bearishly positioned traders scramble to cover their positions.
This shift in sentiment is already visible in various metrics. Funding rates in perpetual futures markets have turned positive, indicating that traders are willing to pay premiums to maintain long positions. Social media sentiment, as measured by various analytical tools, has shifted from predominantly bearish to cautiously optimistic. The fear and greed index, which had been mired in "fear" territory for weeks, has begun moving toward neutral readings.
However, this rapid shift in sentiment also creates vulnerabilities. Markets that move too far, too fast often experience sharp pullbacks as early buyers take profits and late entrants get shaken out. The key for sustained upward movement will be whether the current rally can attract new capital from investors who have been waiting on the sidelines, rather than simply representing a reshuffling of existing positions.
The International Perspective
The Federal Reserve's policy shift has global implications that extend far beyond US borders. Other major central banks, including the European Central Bank and the Bank of Japan, will need to carefully consider their own policy stances in light of the Fed's dovish turn. This could potentially trigger a synchronized global easing cycle, which would likely be highly supportive for risk assets including cryptocurrencies.
For Bitcoin specifically, international dynamics are particularly important given its global nature. Demand from regions experiencing currency devaluation or financial instability has historically been a significant driver of Bitcoin adoption. If the Fed's rate cuts lead to dollar weakness, this could accelerate Bitcoin adoption in emerging markets as a hedge against local currency depreciation.
The Asian markets, particularly China despite its official ban on cryptocurrency trading, remain influential in Bitcoin price dynamics. Any shifts in Chinese policy toward cryptocurrencies, or changes in how Chinese investors access Bitcoin through offshore channels, could have significant impacts on global prices. The recent rally has already seen increased activity from Asian trading hours, suggesting renewed interest from this important region.
Looking Ahead: The Path Forward
As markets digest the implications of Powell's Jackson Hole speech, the path forward for Bitcoin appears more constructive than it has in months. The combination of potential monetary easing, continued institutional adoption, and improving regulatory clarity creates a favorable backdrop for digital assets. However, the journey is unlikely to be smooth, with volatility remaining a defining characteristic of cryptocurrency markets.
The September Federal Open Market Committee meeting looms large on the horizon. While markets have largely priced in a rate cut, the magnitude of the cut and the Fed's forward guidance will be crucial in determining whether the current rally has legs. A more aggressive easing stance than currently expected could propel Bitcoin toward new all-time highs, while a more cautious approach might lead to some near-term disappointment.
Beyond monetary policy, several other catalysts could influence Bitcoin's trajectory in coming months. The continued development of the Lightning Network and other scaling solutions could enhance Bitcoin's utility as a payment method. Growing environmental consciousness and Bitcoin mining's increasing use of renewable energy could address one of the persistent criticisms of the cryptocurrency. Additionally, further institutional adoption, particularly from major corporations adding Bitcoin to their treasury reserves, could provide fundamental support for prices.
Conclusion: A Pivotal Moment in Bitcoin's Evolution
The surge past $116,000 following Jerome Powell's dovish signals represents more than just another rally in Bitcoin's volatile history. It potentially marks a pivotal moment in the cryptocurrency's evolution from speculative asset to recognized component of the global financial system. The fact that Federal Reserve policy now has such direct and immediate impacts on Bitcoin prices underscores how integrated cryptocurrencies have become with traditional financial markets.
For investors and observers, the current environment presents both opportunities and challenges. The potential for significant gains exists, particularly if the Federal Reserve follows through with monetary easing and the global economy achieves the sought-after "soft landing." However, the risks remain substantial, and the cryptocurrency market's inherent volatility means that dramatic reversals remain possible.
What seems clear is that Bitcoin has successfully weathered another period of adversity and emerged with renewed momentum. The quiet accumulation by whales during the recent downturn, followed by the explosive response to Powell's speech, demonstrates that demand for digital assets remains robust among sophisticated investors. As the financial world continues to evolve and adapt to technological innovation, Bitcoin's role appears increasingly assured, even if its exact price trajectory remains uncertain.
The coming weeks and months will be crucial in determining whether this latest surge represents the beginning of a new bull cycle or merely another rally within a broader consolidation phase. What is certain is that Bitcoin continues to capture the imagination of investors worldwide, and its correlation with macro policy decisions ensures it will remain at the center of financial market discussions for the foreseeable future. As traditional monetary policy reaches its limits and financial innovation accelerates, Bitcoin stands ready to play an increasingly important role in the global financial ecosystem, with the $116,000 level potentially representing just another milestone on a much longer journey.

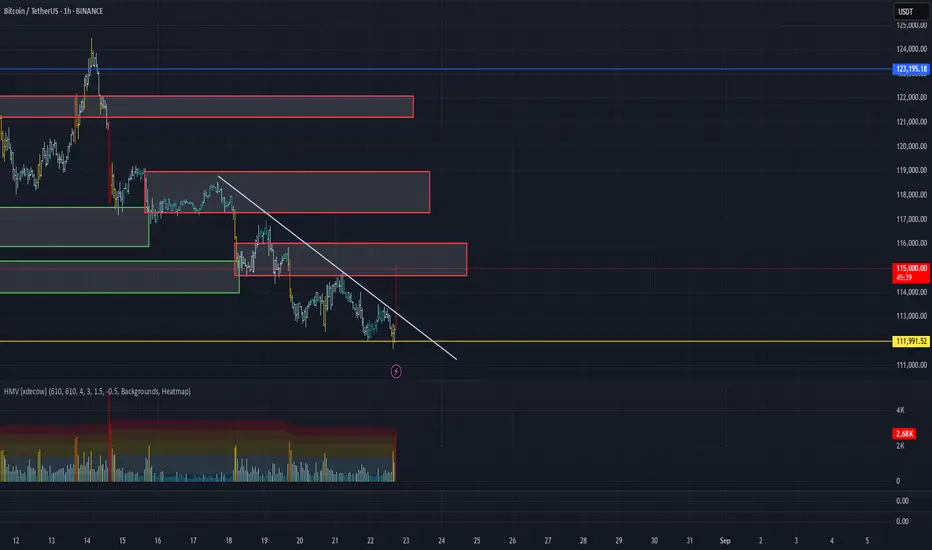
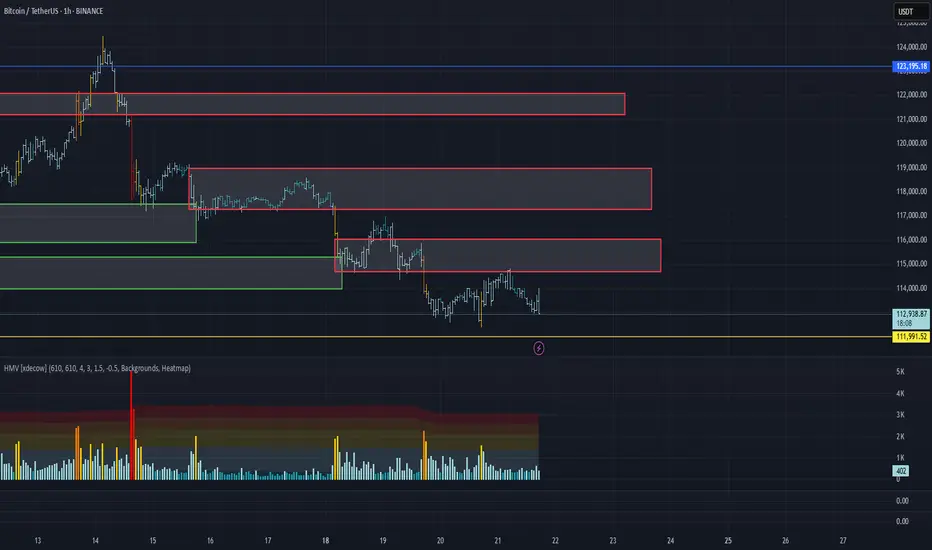
BTC/USD 1H Key Levels to WatchResistance Zones:
$119,082 - Major resistance, watch for rejection
$117,857 - Secondary resistance level
$116,940 - Intermediate resistance
Support:
$114,000 - Critical support zone
Current Setup:
Price action around these levels will determine next directional move. Clean break above $119k could signal continuation higher, while failure to hold $114k support may lead to further downside.
Trade Plan:
Watch for volume confirmation on any breakout attempts
Look for rejection/bounce signals at key levels
Manage risk accordingly
Not financial advice. DYOR.
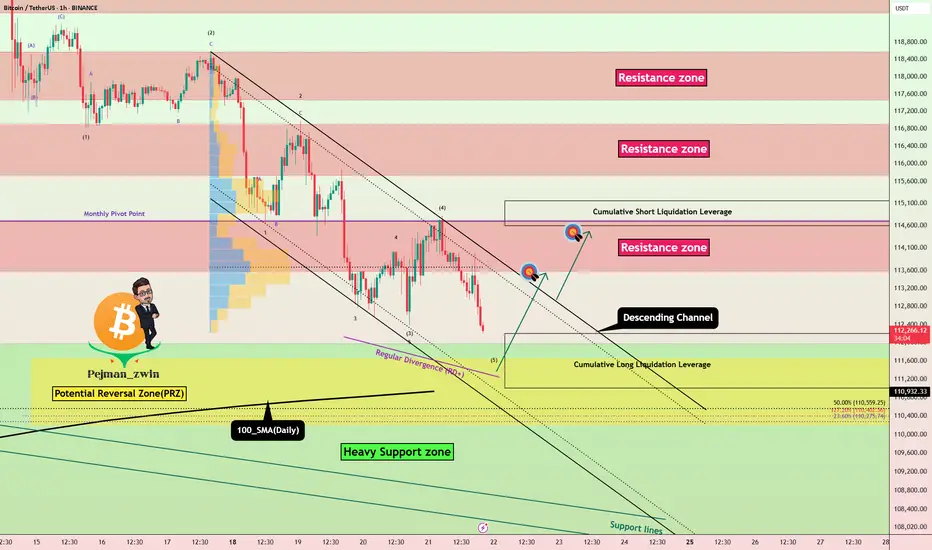
Bitcoin Long Setup: PRZ + Heavy Supports in Action!Bitcoin ( BINANCE:BTCUSDT ), as I expected in the previous idea , fell to at least $112,640 and is completing the second target (Full Target) .
Bitcoin is approaching the Heavy Support zone($111,980-$105,820) and 100_SMA(Daily) , Potential Reversal Zone(PRZ) , and Cumulative Long Liquidation Leverage($112,200-$111,000) , generally , heavy supports and resistances are NOT broken with the first attack , so I am publishing this analysis with the label ''LONG'' .
In terms of Elliott Wave theory , Bitcoin is completing a main wave 5 , as the main wave 3 was an extended wave .
Also, we can see the Regular Divergence(RD+) between Consecutive Valleys .
I expect Bitcoin to start rising from the Potential Reversal Zone(PRZ) and Cumulative Long Liquidation Leverage($112,200-$111,000) and increase to at least $113,617 .
Second Target: $114,391
Cumulative Short Liquidation Leverage: $115,157-$114,599
Note: Stop Loss(SL): $110,100
Please respect each other's ideas and express them politely if you agree or disagree.
Bitcoin Analyze (BTCUSDT), 1-hour time frame.
Be sure to follow the updated ideas.
Do not forget to put a Stop loss for your positions (For every position you want to open).
Please follow your strategy and updates; this is just my Idea, and I will gladly see your ideas in this post.
Please do not forget the ✅' like '✅ button 🙏😊 & Share it with your friends; thanks, and Trade safe.
BTC/USDT Analysis. Testing a Key Low
Hello everyone! This is the CryptoRobotics trader-analyst, and here is the daily analysis.
Today, Bitcoin reached the key low at $112,000. There was almost no false breakout, but a local absorption from the buyer appeared, which led to a new wave of buying and a breakout above the descending trendline.
Currently, the price is approaching the $114,700–$116,000 sell zone (seller’s market activity), where another wave of pressure from the seller is expected. This will reveal how strong buyers truly are in the current context. Despite recent buyer activity, the overall market structure still leaves room for a potential squeeze into the $110,000–$105,000 support zone (accumulated volumes) or a retest of the recent low.
For now, it is better to observe how the balance of power unfolds and avoid long-term positions in Bitcoin.
Buy Zones:
$110,000–$105,000 (accumulated volumes)
Sell Zones:
$114,700–$116,000 (seller’s market activity)
$117,200–$119,000 (accumulated volumes)
$121,200–$122,200 (absorption of buys)
This publication is not financial advice.
Will BTCUSD Confirm a Double-Top Pattern?Fundamental approach:
- Bitcoin prices declined amid a risk-off tone and sizeable spot ETF outflows following last week's post-record pullback and liquidation-driven volatility.
- Selling pressure was reinforced by Tue's sharp net redemptions from US spot Bitcoin ETFs (about $523M), alongside broader crypto weakness early in the week; traders also positioned around macro risk with attention on policy signals from Jackson Hole.
- Concurrently, recent rotations toward ETH products contrasted with BTC's softer demand profile in Aug, adding relative headwinds.
- Ahead, BTC could remain sensitive to ETF flow trends and Fed communication. The persistent outflows and cautious risk sentiment may cap rebounds, while a flow stabilization could restore bid momentum.
Technical approach:
- BTCUSD broke the ascending trendline and was between both EMAs. The price is testing EMA78, which is in confluence with support at 112000.
- If BTCUSD breaches the support below 112000 and the neckline of the double-top pattern, the price may plunge to the following support at 106200.
- On the contrary, a close above 115000 may prompt a further retest of the broken descending trendline.
Analysis by: Dat Tong, Senior Financial Markets Strategist at Exness

BITCOIN IN DANGER Bitcoin has reached to a major resistance area between 120k to 130k, which is the resistance zone since 2021 tops.
This is the second rejection in this cycle. A fake breakout to $130,000 may occur, but the monthly candle could close below this resistance again.

Bitcoin BTC Bounce Incoming?📊 CRYPTO:BTCUSD is approaching the extreme technical zone: $111,400–$108,300, where a weekend bottom could form.
If structure holds, this area may set the stage for a bounce into next week, aligning with key wave metrics.
⏱️ Timing and confirmation will be critical.


BTC/USDT Analysis. Attempts to Buy Back
Hello everyone! This is the CryptoRobotics trader-analyst, and here is the daily analysis.
Yesterday, Bitcoin formed a large number of anomalous clusters both in delta and horizontal volume. Buyers attempted to resume growth, but after reaching the resistance zone of $114,700–$116,000 (seller’s market activity zone), the price moved into a correction.
The situation now looks quite ambiguous. On the one hand, the large number of anomalies indicates the weakening efficiency of sellers. On the other hand, buyers are not yet showing strong activity. Locally, we may still see upward expansion. However, the price has approached the key minimum at $112,000, which is highly likely to be tested since a large number of stop orders and liquidity are concentrated below it.
From a broader perspective, there is a strong probability of balance expansion in the downward direction with a subsequent test of the $110,000–$105,000 (accumulated volumes) zone. The only question is whether this scenario develops in the coming days or next week.
Buy Zones:
$110,000–$105,000 (accumulated volumes)
Sell Zones:
$114,700–$116,000 (seller’s market activity)
$117,200–$119,000 (accumulated volumes)
$121,200–$122,200 (absorption of buys)
This publication is not financial advice.
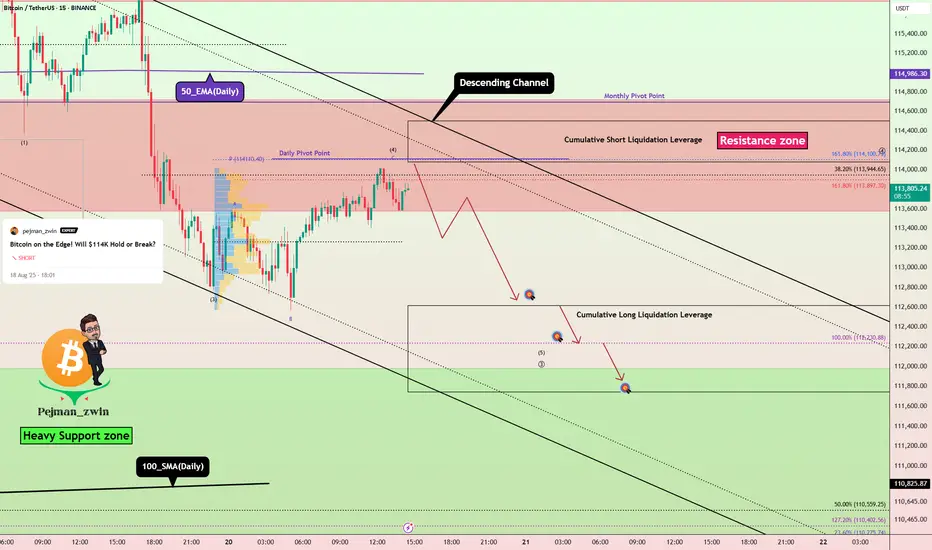
Bitcoin Short Setup _ Short-termBitcoin ( BINANCE:BTCUSDT ) has managed to break the Support zone($114,720-$113,570)/Now=Resistance zone and 50_EMA(Daily) , as I expected in the previous idea . And now it seems that Bitcoin is completing a pullback .
Also, on the 1-hour time frame , if you look closely, Bitcoin seems to be moving inside a descending channel .
In terms of Elliott wave theory , Bitcoin seems to be completing microwave 4 of the main wave 3 , so that microwave 4 could have an Expanding Flat structure(ABC/3-3-5) .
I expect Bitcoin to drop to at least $112,640 after completing the pullback ( microwave 4 of the main wave 3 ).
Second Target: $112,323
Cumulative Short Liquidation Leverage: $116,755-$115,778
Cumulative Short Liquidation Leverage: $114,500-$114,077
Cumulative Long Liquidation Leverage: $112,615-$111,743
Note: From today until Friday, important indexes will be released from the US, which can create excitement in financial markets, especially crypto, and even change the market trend when released.
Note: Most likely, after Bitcoin touches the Heavy Support zone($111,980-$105,820) and 100_SMA(Daily), we should wait for Bitcoin to bounce back (you might be able to look for a long position trigger in that zone).
Note: Stop Loss(SL): $114,823
Please respect each other's ideas and express them politely if you agree or disagree.
Bitcoin Analyze (BTCUSDT), 15-minute time frame.
Be sure to follow the updated ideas.
Do not forget to put a Stop loss for your positions (For every position you want to open).
Please follow your strategy and updates; this is just my Idea, and I will gladly see your ideas in this post.
Please do not forget the ✅' like '✅ button 🙏😊 & Share it with your friends; thanks, and Trade safe.
BITCOIN BTC PRICE ANALYSIS AND NEXT EXPECTED MOVES!!CRYPTOCAP:BTC Update & Next Possible Trade Ideas!!
• Right Now For Short term i am expecting sideway movement in CRYPTOCAP:BTC Price. (Overall No Trade Zone Area)
REASON:
Volume is Low, LTF's Structure look Bullish & HTF's Structure is Bearish... I think we will stuck in a trap🚨
• But after consolidation if price manage to hold 114600$ then we will look for long setup OR It's Price Drop B/w 111500$ to 110000$ zone then we will also look for quick long scalp🫡
• Trade ideas that i marked on a chart are also for quick scalp.
• Let's see how Price react in comming days🫠
Warning : That's just my analysis DYOR Before Taking any action🚨🚨

BTC/USDT Analysis. Continuation of Decline
Hello everyone! This is the trader-analyst from CryptoRobotics, and here is the daily analysis.
Yesterday, Bitcoin once again tested the ~$115,000 level, but buyers showed no significant reaction, and selling pressure continued to dominate. At the moment, the price has dropped below the $115,300–$114,000 support (accumulated volumes) and is approaching the $112,000 level, which is likely to be tested soon.
Below that lies a key zone — $110,000–$105,000 (accumulated volumes), where a buyer’s reaction is to be expected. It’s worth noting that the decline is accompanied by weak volumes and ongoing limit absorption of sell orders, which makes $118,000 the main “liquidity magnet.” In the case of a full rebound, this will be the primary upside target, while other resistance levels are viewed only as local corrective zones.
For now, buyer activity remains insufficient for a trend reversal, so in the coming days we expect a test of the recent lows.
Buy Zones:
$110,000–$105,000 (accumulated volumes)
Sell Zones:
$114,700–$116,000 (seller’s market activity)
$117,200–$119,000 (accumulated volumes)
$121,200–$122,200 (buyer absorption)
This publication is not financial advice.

BITCOIN PREDICTION: HERE IS WHERE THE CRASH WILL STOP!!! (deep) Yello Paradisers! In this video, I'm sharing with you an Ultra High Time Frame: the double-top shooting star candlestick pattern formation plus bearish divergence, plus that we are trying to break below our channel.
On a high timeframe chart, I'm sharing with you the ABC zigzag, explaining that right now we are in the C wave, which is a motive mode wave. That means five waves to the upside, and with the highest probability, right now we are in the secondary wave that on its primary waves is creating a zigzag formation.
The 0.786 Fibonacci retracement level needs to hold, and the channel can't be reclaimed. I'm sharing with you the kind of confirmations for both short and long positions we are waiting for with the ParadiseTeam.
On a medium timeframe, we are seeing the first bullish signs and a bullish divergence, where we need to wait for confirmations before taking action. We are also looking at the Fibonacci support that is supporting the finishing of Wave 2.
On the low timeframe chart, we are analyzing the higher degree secondary wave, which is a zigzag. A and C waves are motive mode waves, so we are waiting for the completion of the five-moonstone downside inside of the C wave. This might perfectly confluence with the 0.618 Fibonacci's extension of Wave A, which is usually where the C Wave ends.
Paradisers! Keep in mind to trade only with a proper professional trading strategy. Wait for confirmations. Play with tactics. This is the only way you can be long-term profitable.
Remember, don’t trade without confirmations. Wait for them before creating a trade. Be disciplined, patient, and emotionally controlled. Only trade the highest probability setups with the greatest risk to reward ratio. This will ensure that you become a long-term profitable professional trader.
Don't be a gambler. Don't try to get rich quick. Make sure that your trading is professionally based on proper strategies and trade tactics.

Interesting Fib retrace info could help understand the next bear
Nessy chart initily but I have broken it down here and it will be easy to understand
Also, to make it ckearer to see, I have used a line for the PA..the retracements and % pull backs are accurately placed using the candles....
So, an interesting thing appeared when I was laying with Fib Replacements.
Simply put,
From 2013 ATH to the next Low was a -78.27 % pull back to the 0.236 Fib retracement
From 2013 ATH to the next Low was a -82.20 % pull back to the 0.382 Fib retracement
From 2013 ATH to the next Low was a -76.40 % pull back to the 0,5 Fib retracement
So, after each ATH, PA pulled back to the next step down from previous fib retracement, while pulling back approx the same %
Shuold Bitcoin do the same again, whichh would Scare a Lot of people, we could expect to see a pull back to the 0.768 Fib retracement...and using a near -80 % pull back, we would end up around 24K Low in Nov 2026
Will this happen ?
Who know and I doubt it but until things and patterns change in the way Bitcoin runs its 4 year cycles, then it is a possibility.
But I found it fasinating how yet anoterh sequence occured in the last 3 cycles that Bitcoin has performed.
Nothing else has ever done this.....
So, Lets see if it repeats
