Deep Analysis for Bitcoin – The 4-Year Cycle Repeating Again🔹 1. Historic Bear Market Drops Are Identical
Each cycle produced almost the same percentage crash from top to bottom:
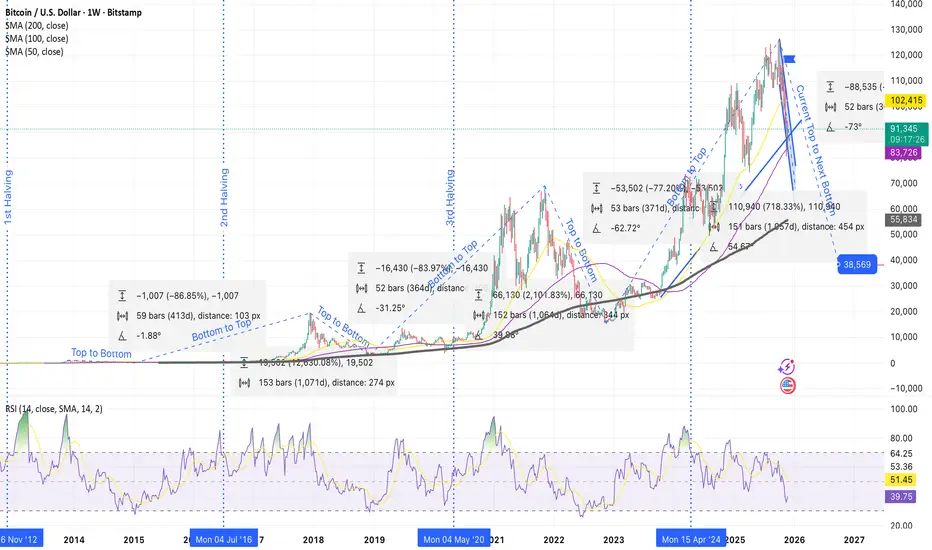
• Cycle 1: –86.85%
• Cycle 2: –83.97%
• Cycle 3: –77.20%
• Current Cycle (Projection): –70% to –75%
Every cycle becomes slightly less volatile, but the pattern is still the same:
The top is always followed by a huge correction.
⸻
🔹 2. The Cycle Durations Are Nearly Perfect Copies
Top → Bottom timing
• Cycle 1: 59 weeks
• Cycle 2: 52 weeks
• Cycle 3: 53 weeks
• Current projection: ~52 weeks
⏳ Every major Bitcoin top takes ~1 year to reach the bottom.
Bottom → Next Top timing
• Cycle 1: ~1070 days
• Cycle 2: ~1057 days
• Cycle 3: ~1057 days
• Current cycle follows the same length exactly.
⸻
🔹 3. Bitcoin Always Bottoms Near the 200-Week SMA
Every cycle bottom touches or slightly dips below the 200-week moving average (black line).
Your projection shows the same thing happening again:
📉 Projected BTC bottom: ~$38,000 – $40,000
Exactly where the 200-week SMA and long-term trendline converge.
⸻
🔹 4. Current Cycle Is Following the Previous One Perfectly
Your chart overlays show:
• The 2025 top mirrors the 2021 top
• The decline angle is almost identical
• RSI is falling the same way it did in every bear market start
• The projected drop of –70% from the 2025 top leads directly to the $38K bottom zone
This is the same structure as:
• 2013 → 2015
• 2017 → 2018
• 2021 → 2022
⸻
🔹 5. What’s Next?
If Bitcoin continues to follow its 4-year cycle:
📉 Bear Market Bottom: ~$38K in 2026
📈 Next Major Bull Run: 2026–2028
🏁 Major Cycle Top: around 2028–2029
⸻
🧠 “Bitcoin has never broken its 4-year cycle. Each top is followed by a –70% bear market, and each bottom leads into the next halving bull run.”
📜 Disclaimer: This is general information only and not financial advice.
Bitcoinprediction
Bitcoin prediction 2025-NovBitcoin price has a motive to buy and it's now retraced to a bullish order block as way of correcting price with same Bullish bias from earlier trade call.

Bitcoin: Next Move = Drop to $85K (Then Either Moon or Doom)Hey everyone! 👋
How was your trading week? Hope it was green and profitable! 💰
Sharing my current Bitcoin view with you.
In my opinion, the recent rally we’ve seen was either part of an ongoing correction or the final leg of a correction after the previous sharp drop.
Either way, I expect the next meaningful move to be to the downside.
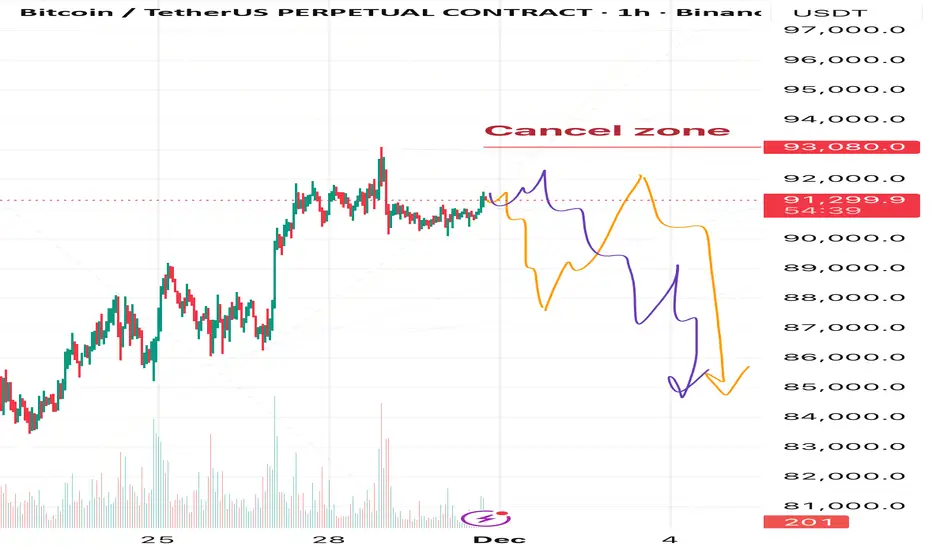
Right now I see two possible scenarios, but both lead to the same outcome in the near term:
→ A decline toward the $85,000 area
🟠either straight from the current price
🟣or after one more push higher toward ~$92,000–$92,500
This coming drop can be interpreted in two ways:
1. As wave B of the ABC correction from the recent crash → after $85K is reached we can expect a strong recovery and new highs above $93K (and likely much higher).
2. If the correction from the crash is already fully complete, then the drop to $85K will mark the start of a new bearish trend continuation.
We’ll watch the internal structure of the upcoming decline — it will give us the clues which of the two bigger pictures is playing out.
❌Invalidation level for the entire bearish scenario: $93,080
Any clear touch and break above this level cancels the idea completely.
Of course, I’ll keep posting fresh updates and chart markups as the price action unfolds, so make sure to hit that
Follow button and turn on notifications — you don’t want to miss the next posts! 🔔
Stay sharp and trade safe, friends! 🚀
See you in the charts! 📊
111k Bitcoin top before the 50%+ plunge - THE BIG SHORTIn my previous idea, I explored the technical readiness for Bitcoin to have a strong downturn towards 50k or lower.
I believe we are at the twilight right before the storm.
As with everything, we recognize that price doesn't just continually move down, but that there are retraces in any strong move up or down where big firms are able to offload (in a downturn) or add positions in an upturn.
In our scenario, I believe that large firms have sold into buyers as a test of strength, and buyers were unable to keep prices going higher. The proof is in the imbalances that were created at the quarterly low.
What we are looking for now is the initial impulsive correction up, typically this is points 1 and 2 in a bearish Elliot Wave bearish impulse. the 3rd point, which is also the strongest is expected to come next year.
What we are doing now is setting ourselves up to either exit Bitcoin positions, or start shorting Bitcoin.
We have a solid point of time reference for taking out liquidity, which is actually at the high of THIS closing month. I foresee December being bullish for Bitcoin, but again, this is just before the fall.
The liquidity shown inside of our OTA zone gives us four different types of liquidity:
-Trendline liquidity near the Nov Monthly highs
-The actual high in Nov
-A previous iFVG
-A Current FVG
Here is an example of what we are looking for once prices reaches into our zone:
-The price MUST manipulate the current monthly high (Nov)
-If the price creates a bullish FVG into the high, it must invert it and close below it.
-The price MUST create a bullish FVG on the way down.
We should be looking for these signs in the DAILY chart. Once we have them, short the position.
Be forewarned that it is NOT impossible for the price to manipulate ATH again, so if you do enter this short, set your SL at $132,000.
Again, price MUST show willingness to create imbalances to the downside within the OTA! If this does not happen, you cannot short!
Theoretical position:
Initiate short: apx $111,700 (or whenever there are clear imbalances within OTA)
SL: $132,000
Take Profit 1: $74,720
Take Profit 2: $57,800 (61.8% of the larger move in my previous idea)

Bitcoin: The Downtrend Begins Just as the title suggests, this is where Bitcoin is poised to fall once more.

BTC/USDT Analysis. Local Structure Favors Buyers
Hello everyone! CryptoRobotics trader-analyst here with the daily market breakdown.
Yesterday, Bitcoin continued rotating inside the resistance zone at $90,000–$92,300.
Locally, there is a strong probability of a breakout above this range, followed by a move toward the next resistance at $94,000–$97,500 (volume zone). This is supported by the absence of aggressive selling pressure and the way volume is distributed inside the consolidation.
The $90,000 level remains a key pivot point. We still allow for a retest of this level before buyers attempt another upward move.
On a larger scale, once price reaches the next sell zone, we expect a deeper correction to form.
Buy Zones
$90,000 (cluster anomalies)
$88,000–$86,000 (local volume zone)
$84,000–$82,000 (volume anomalies)
Sell Zones
$94,000–$97,500 (volume zone)
$101,000–$104,000 (accumulated volumes)
$105,800–$106,600 (local resistance)
This publication is not financial advice.

Bitcoin prediction Nov 2025Bitcoin prediction Nov 2025, Bitcoin is expected to push to the upside after it broke previous high and came to test previous low and bullish order block and start to move toward previous high (Bullish Extension). This move may break previous all-time high and break record of 2025 All-time high.

BTCUSD - Wave 5 Decline Still Likely AheadPrevious Analysis:
BTC is approaching a critical reaction zone where the current rise looks more like a corrective push than the start of a new trend. Price is moving toward the highlighted supply region, which aligns with a potential wave 4 completion inside the descending channel. The structure from the recent low shows an internal a–b–c formation, suggesting this bounce could run into exhaustion as it enters the red zone. Unless BTC breaks out of the channel with conviction, the broader momentum still leans bearish. A rejection from this region would likely trigger the final wave 5 leg, driving price toward deeper Fibonacci levels and completing the corrective cycle before any meaningful recovery attempt can begin.
Stay Tuned!
@Money_Dictators

BTCUSD Bearish Setup?Bitcoin on the weekly chart has shifted from strong trend to corrective territory. After topping twice near the 125,000 resistance, price has broken below the 20-week and 60-week MAs (around 110,662 and 99,350), and is now pressing into the 86,000 demand area and the prior swing low near 85,250. This aligns with a moderately confirmed Double Top, with the neckline around 105,000 now acting as key resistance within a broader, still-intact long-term uptrend supported by the 120-week MA near 75,292.
The primary path favors further downside as long as BTCUSD holds below the neckline and the 99,000–105,000 region. A weekly close below 85,250 would confirm a bearish Market Structure Shift, validating the Double Top and opening room toward 82,000 and then the 75,500 target just above the 120-week MA. In this scenario, rallies back toward 95,000–99,000 are likely to be treated as corrective bounces within a dominant downtrend.
If buyers can defend 86,000 and push for a 1W close above 98,000, the focus shifts to a mean-reversion move toward the 60-week MA and the 105,000 neckline, with potential extension toward 112,000. A sustained weekly close back above 95,000–98,000 would begin to weaken the bearish thesis. This is a study, not financial advice. Manage risk and invalidations.
Thought of the Day 💡:
Clear triggers and invalidations matter more than perfect forecasts.
--------------------------
Thanks for your support!
If you found this idea helpful or learned something new, drop a like 👍 and leave a comment, I’d love to hear your thoughts!

BTC 4H – Fib Rejection, But Is Another Leg Down Next?BTC is pressing into a heavy confluence area: the macro downtrend line, the 50/100 EMAs, and the 0.5–0.786 Fib retracement zone. Price reacted cleanly from local supply and failed to close above the cluster of moving averages, keeping the 4H structure bearish.
The Stoch RSI is fully overbought and curling down, signaling weakening bullish momentum on approach into resistance. Unless BTC can reclaim the trendline with a strong impulsive close, this area favors a lower-high formation and continuation toward downside targets.
A confirmed rejection here opens a move back toward prior demand zones, while a break above the 0.618 would shift momentum toward deeper Fib targets and potentially challenge the trendline from above.
Key levels:
• Resistance: 93,826 / 97,010 / 101,543
• Support: Prior local demand under 90K
• Structure shift only if trendline breaks with volume

BTC/USDT Analysis. Sell-Side Absorption in Play
Hello everyone! CryptoRobotics trader-analyst here, and this is your daily market update.
Yesterday Bitcoin followed our long scenario — the move started earlier than expected, without a liquidity grab, as market buyers stepped in aggressively. As of now, price has reached the first resistance at $90,000–$92,300 (volume zone).
In this area, delta has spiked sharply, indicating “high-level buying,” which has already triggered a local correction.
The key pivot level now is $90,000 — it may work as support, but if price settles below it, the level becomes resistance.
If price breaks the local high → expect a test of the upper selling zone and a deeper correction afterwards.
If price breaks and holds below $90,000 → the downside target becomes the anomaly zone at $84,000–$82,000.
Buy Zones
$88,000–$86,000 (local volume zone)
$84,000–$82,000 (volume anomalies)
Sell Zones
$90,000–$92,300 (volume zone)
$94,000–$97,500 (volume zone)
$101,000–$104,000 (accumulated volumes)
$105,800–$106,600 (local resistance)
This publication is not financial advice.

BTCUSDT (bitcoin) toward $91k?Hi!
BTC has finally broken its major descending trendline, signaling a shift in market sentiment after a long period of selling pressure. Following that break, price formed a clear inverse head and shoulders pattern, showing that buyers stepped in aggressively after the final liquidity sweep at the Head. Since then, BTC has been moving inside a well-defined ascending channel, consistently printing higher highs and higher lows, which confirms bullish momentum.
As long as price respects the lower boundary of this channel, the upside structure remains intact. The next significant resistance sits at 92,500–93,000, which also aligns with the previous breakdown zone you highlighted. This area is likely to attract sellers, making it a logical target for the current move.
Overall, the chart supports continued upside toward 93K, unless price breaks below channel support, which would weaken the bullish reversal setup.

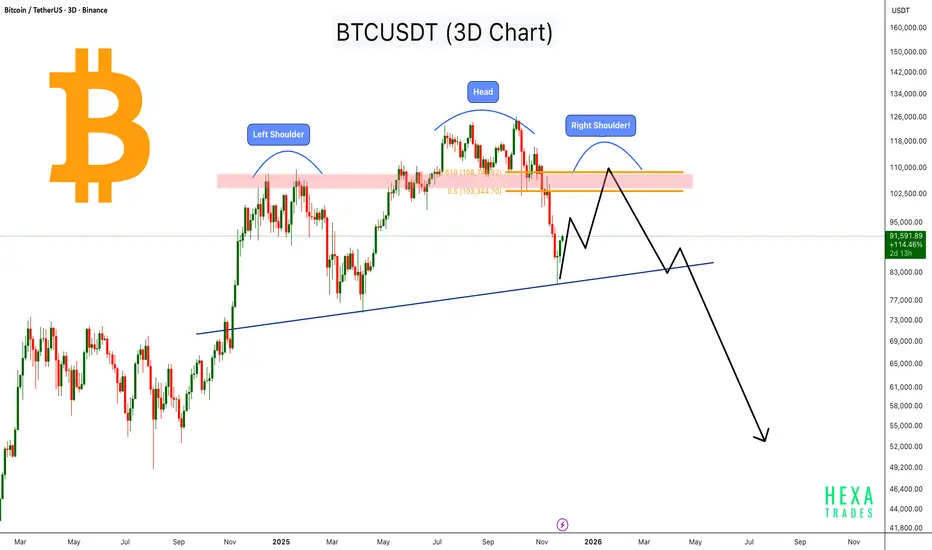
BTC Forming a Massive Head & Shoulders - Macro Reversal Ahead?Bitcoin is forming a large Head & Shoulders pattern on the 3-day chart, with the left shoulder and head already completed, and the right shoulder now developing within the major resistance zone around the 0.5–0.618 retracement (103,000–108,000).
Price recently bounced from the long-term ascending trendline, but the overall structure still suggests a potential macro reversal unless Bitcoin breaks above the resistance zone with strong momentum.
If the right shoulder completes and price rejects from the supply zone, BTC could retest the trendline again. A breakdown of this trendline may open the door for a deeper correction toward the lower demand zones.
This is a medium-term pattern and may take 1–3 months to validate fully.
Key Points:
- Left Shoulder, Head, and Right Shoulder zone highlighted
- Major resistance at $103,000–$108,000
- Price bouncing from long-term ascending trendline
- Breakdown below the trendline may trigger a strong downside move
- Right shoulder formation may take a few more weeks
Cheers
Hexa
Is This the Beginning of a New Bull Cycle?Ladies and gentlemen, Bitcoin’s conditions have completely flipped, and if you don’t adapt to the new reality fast, you’re about to leave a lot of profit on the table.
In this analysis, we’re going to look at Bitcoin with zero bias, pure objectivity, and open positions together.
I’m Skeptic, founder of Skeptic Lab . If you want to take your long-term performance to the next level using real psychology, data, and strategy, you’re in the right place.
Let’s start with the daily timeframe 📉
it looks like the pullback is completing. Yesterday’s candle closed extremely bullish, and the odds of the next two daily candles also closing bullish are honestly pretty much. btw Anything upward from here on the daily is just lower highs and a pullback toward 100k. YES, the HWC (weekly) is still in an uptrend, but the daily IS NOT. That doesn’t mean we sit on our hands—we still take longs, but only in lower timeframes and with a completely different risk-management approach (explained below).
🔍 Drop to the 1H for the real triggers.
Yesterday our long trigger fired exactly as planned and gave us a clean +4.35% move (if you missed it, go check yesterday’s analysis). We’ve now reached 91,497.25 and the upper boundary of the 4H ascending channel. From here, two main scenarios: 📍
1. Break of support at 90,892.60 → continuation down to the channel midline, then retest of 88,118.70 support.
2. Break of resistance at 91,497.25 → entry into fresh bullish momentum that can carry us all the way to the next major resistance at 96,066.89 .
Key observation: LWC momentum is strongly bullish. Volume has spiked on the rise and dropped sharply on pullbacks and during consolidation, so the probability of breaking the top is higher right now.
Risk-management difference (this is critical):
- Longs are counter-trend to the daily MWC → we take profit faster and use tighter stops so we can reach target quickly before a single daily candle potentially wipes the whole move.
- Shorts would be with the MWC → we can afford wider risk and scale out with partials.
Volume is our final confirmation here: if we had rising price but decreasing volume on the push to the top → cancel orders. Same rule applies to shorts.
Yesterday, when price rose toward 88,118.70, volume exploded—that was our confirmation, and we entered long.
If this analysis helped you, I’d really appreciate a boost. It keeps the energy coming. 🩵
Now get outta here.

BTC Bounce Looks Corrective – Bottom Not In Yet1. Recap of My Last BTC Outlook (5 November)
In the 5th November analysis, I noted that the 106k support zone was under pressure, and if that level failed, the next meaningful target would be 90k — because 100k, despite being psychological, should not offer much after technical break.
That played out perfectly:
- 106k failed
- 100k offered nothing but a small rebound
- BTC dropped straight into the 90k zone
And then continued even deeper, almost touching 80k before rebounding
We’re now trading around 87,500, after a textbook corrective bounce.
2. Is the Bottom In?
➡️ In my opinion, no. Definitely not.
And here’s where I apply my usual contrarian filter:
Whenever I start hearing the same voices saying the same thing —
“Bitcoin bottom is in! Bitcoin up only!”
— I immediately become cautious.
These are the same people who never consider the other side of the market.
A broken compass can show the right direction once in a while, but it’s still broken.
3. Technical Picture – Nothing Bullish Here
- Yes, the bounce from 80k is normal and expected.
- Yes, BTC can easily retrace 10–15k after a large drop.
- But nothing in the current structure suggests a meaningful bottom.
What we have right now is:
- A classic corrective rebound
- Weak impulse
- No break back above of important resistance
- No reversal pattern
- No shift in market bias
It looks exactly like what price should do after a violent leg down — not like a new bull trend.
This is the type of rebound where retail screams “moon,” but professionals simply prepare for another sell.
4. My Outlook – Bearish Until BTC Reclaims 100k With Conviction
My plan is simple and level-driven:
Preferred Sell Zone:
- 92k → This is where I want to sell, ideally on a weak rally
Downside Targets:
- 80k → Recent low and first logical stop
- 75k → Major structural support and second target
Bearish outlook is invalidated ONLY if:
➡️ BTC reclaims 100k with conviction (not a wick, not a temporary spike)
Until that happens, every rally is a potential shorting opportunity.
5. Conclusion – Still Bearish, Despite the Bounce
BTC has done exactly what it was supposed to do:
- Drop to 90k
- Overshoot to 80k
- And bounce in a corrective manner
Nothing about this price action signals a bottom.
If anything, it signals more downside ahead — once the corrective rally into 92k completes.
Bias: Bearish
Approach: Sell rallies
Invalidation: Break and hold above 100k with conviction
Until then, the narrative “bitcoin up only” remains a meme, not analysis. ⚠️

Bitcoin Ready to Casually Liquidate $300MLadies and gentlemen, today is November 26. If you’re still alive in the market, let me be the first to congratulate you—because that means you actually use proper capital management and set stop losses.
In this analysis, we’re going to pinpoint Bitcoin’s next triggers together, get a crystal-clear picture of the current structure, conditions, and scenarios, and trade them side by side.
Hey, I’m Skeptic , and this is Skeptic Lab . If you want to level up your trading knowledge through data, psychology, and real strategy and actually become consistently profitable, you’ve come to the right place.
Let’s jump straight to the charts. 📉
In the daily timeframe , after that massive sell-off candle on November 21, Bitcoin immediately went into ranging mode. Volume dropped hard, and RSI bounced back above 30. After breaking 100k—as I’ve been saying for weeks—the MWC has officially turned bearish, so every bounce back to that zone is nothing more than a pullback. If this 4H correction we’ve started continues, it can easily reach 91,213.99 (the 0.5 Fib), so if you’re opening longs, your target should be exactly 91,213.99.
🔍Now let’s drop to the 4H timeframe to hunt for actual triggers.
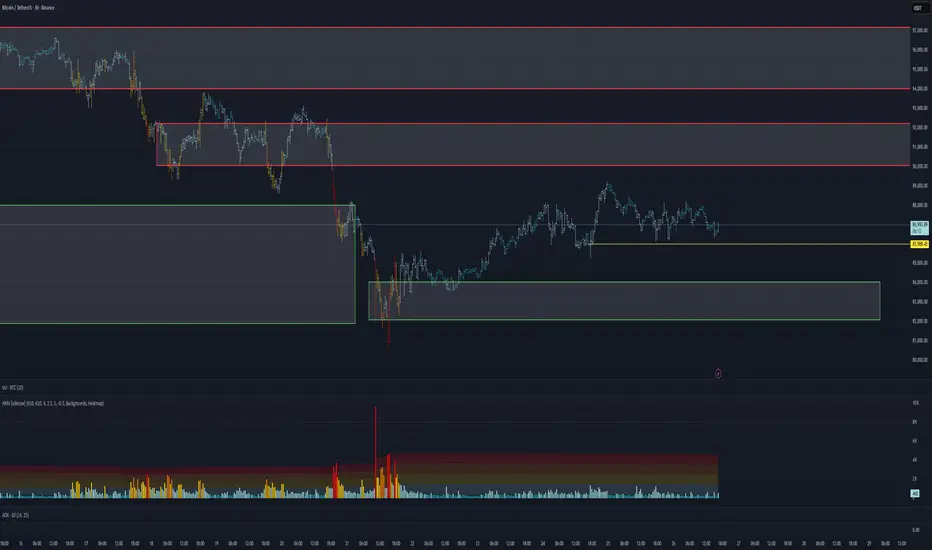
In the 4H, we have a weak upward channel that’s really just the daily bearish correction. We’re ranging between two key levels:
- Resistance: 88,118.70
- Support: 86,224.62
Breaking either one is our long or short trigger.
But here’s the risk-management difference: 📍
For longs (which are counter-trend to the MWC), we use a very tight stop loss and take profit quickly.
For shorts, we can accept slightly higher risk and scale out with partial profits.
Important note: Throughout this entire range box, volume has been consistently dropping—this means the next move is getting closer and closer. Stay very alert inside this box.
If this analysis helped you, I’d really appreciate a boost—it gives me energy to keep going.🩵
Now get outta here.

Bitcoin: Internal countermoveBitcoin currently appears to be forming an internal countermove within the ongoing orange wave a. Nevertheless, our primary outlook remains that this a-wave will ultimately extend into our green Target Zone, which ranges from $62,395 to $51,323. From this low, we expect another corrective move to the upside before the final downward leg of the wave (ii) correction—an overall pattern that has been developing since January—reaches completion.

BTC/USDT Analysis. Local Long Setup
Hello everyone! CryptoRobotics trader-analyst here, and this is your daily market update.
Since yesterday, Bitcoin has failed to break above the $88,000 level mentioned in the previous analysis, resulting in continued consolidation within a narrow range.
When analyzing this local range, we see dominant selling pressure on cumulative delta, but it has not produced any meaningful downside result — sellers are active, yet unable to push the price lower. Additionally, a notable delta anomaly has formed around $86,000, suggesting the presence of a limit buyer.
A local long setup becomes valid if liquidity is swept below the local lows followed by a test of $86,000, with a stop-loss below $85,200. The upside potential is attractive — the next resistance zone we highlighted earlier becomes the primary target.
If no reaction appears at $86,000 and buyers fail to step in, we expect further downside movement toward a stronger support zone below.
Buying Zones:
• $86,000 (local selling absorption)
• $84,000–$82,000 (volume anomalies)
Selling Zones:
• $90,000–$92,300 (high-volume zone)
• $94,000–$97,500 (high-volume zone)
• $101,000–$104,000 (accumulated volume)
• $105,800–$106,600 (local resistance)
This publication is not financial advice.
SPY - Potential Head & Shoulders And now we have this exhaustion pattern again. I went back and foruth on this yesterday. But in the final minutes a bought shorts again. The right shoulder can consolidate for a few days and the H&S can still be invalidated but I have this on my bucket list. I can´t sit on the sidelines on this one. If it happens, it will be legendary. With first strong support at 605

BTC – Inside Monday’s Range During a Holiday WeekWe are currently trading inside the Monday range, and given the holiday conditions, price action is likely to stay contained.
🎯 Base case:
Trading the range until it breaks makes the most sense.
With the bullish opening of the day and 0.5 retracement of the range holding, the most probable scenario is a sweep of Monday’s high.
However, once Monday high is taken, we also have resistance there. If we get a bearish daily open afterward, I would look for shorts.
These remain the highest-probability plays for me.
If we get a strong bullish close after taking Monday high AND hold above TWO, then something may be shifting. Until then, I’m keeping decisions strictly based on the scenarios above.

BITCOIN:LIVE TRADEHello friends
considering the decline we had, the sellers made a bottom and the buyers came in. The sellers again broke the previous bottom with strength and made a bottom, and the buyers came in and raised the price and succeeded in hitting a higher ceiling.
And in the pullback, the open price is supported and here we can enter a buy transaction considering the support of buyers and hitting a higher ceiling, of course with risk and capital management and be careful not to make emotional decisions.
*Trade safely with us*

BTCUSDT(BITCOIN): Bitcoin is bearish for now at least! Bitcoin is in distribution phase if we using the smart money concept, that is why we think price is at the final point before it drop faster. There will be mixed views regarding the bitcoin, but this is our personal view and which is more likely view compare to buying. Please use accurate risk management while trading bitcoin. This setup may take time to get it completed, and we will keep you guys updated.
Good luck and trade safe!
Team Setupsfx_

Why this Happens - and why BITCOIN will do the sameThis is not a rug pull.
What you see here is the natural market movement created in environments that are over leveraged.
Bitcoin is an asset fueled by leverage. The majority of its market cap is leveraging liquidity used by traders in derivatives, futures, and margin trades.
When price moves up slowly, this leaves underneath it a trail of sell orders that only fill, when price crosses the level.
Therefor you have a series, or chain reaction, of sell orders preset in the chart, ready to set off as a chain reaction.
This is what creates these massive candles, or wicks, in the opposite direction.
This is what the bitcoin chart will look like, and for the price of bitcoin to hit 8,000 - does not require months, weeks, or days.
It will only take hours.
It’s not a rug pull because the liquidity is there to bring price up again.
It won’t go to zero - it will only go to 8,000
