Bitcoin BTC price analysis - READ the text !There was some positive news: "The US and China have agreed to reduce tariffs for 90 days."
The price of CRYPTOCAP:BTC has entered the zone of total sales - $105-110 thousand.
🕯 Metrics show that large wallets are now opening short positions worth hundreds of millions of dollars, and on the other hand, no less large wallets that organized this rebound in the OKX:BTCUSDT price are very tempted to launch the final stage of cascading liquidations of shorts.
🍿 So, stock up on popcorn - it's going to be "fun" today/tomorrow, and then we'll go to the stronger side!)
Globally, before the growth wave begins, we want to see the final "shake-up" of the longs who have survived everything and still held their positions and didn't give up.
1️⃣ Weak correction in the range of $90-91k - to close the GAP that formed on this rebound and then continue to confidently update ATH with a clear conscience.
2️⃣ A strong correction to the range of $80-82k - during which it will be very interesting to watch the capital flow and dominance.
Which scenario is closer to your heart? Write in the comments!
_____________________
Did you like our analysis? Leave a comment, like, and follow to get more
Bitcoinprediction

Bullish Tide: Are Bears Drowning as $31M Shorts VanishBullish Tide: Are Bears Drowning as FWB:31M Shorts Vanish and "Price Discovery 2" Looms?
The cryptocurrency landscape is once again electric with anticipation, and at the heart of this renewed fervor stands Bitcoin. As of May 2025, the prevailing winds appear to be firmly in the sails of the bulls. A cascade of recent market events, headlined by a dramatic $31 million liquidation of Bitcoin short positions, is sending a stark warning to pessimistic speculators. This, coupled with compelling technical analysis suggesting that Bitcoin must close the week above a crucial level to initiate 'price discovery 2', paints a picture of a market on the brink of a potentially explosive upward trajectory.
This isn't merely about fleeting price surges. Underlying these market dynamics is a growing conviction that Bitcoin doesn’t need to change; the world does. While critics often call for Bitcoin to become "faster, cheaper, greener," a powerful counter-narrative champions its existing, robust design as a solution to the inherent weaknesses of traditional systems. Adding fuel to this bullish fire is the subtle but significant trend of Bitcoin’s Quiet Coup, as wealth funds methodically build up their holdings. Furthermore, market sentiment indicators like Bitcoin funding rates remaining positive on major exchanges like Binance seem to confirm a strong, underlying uptrend. Are Bitcoin bears truly losing out, and are we witnessing the dawn of a new era for the king of cryptocurrencies?
The Cost of Doubt: $31 Million in BTC Shorts Wiped Out
The unforgiving nature of leveraged trading in the cryptocurrency markets was recently laid bare with the news that a staggering $31 million in Bitcoin short positions were liquidated. This event serves as a potent illustration of the risks involved in betting against Bitcoin's momentum, especially in the current climate.
Short selling in the crypto sphere, much like in traditional markets, involves traders borrowing Bitcoin, selling it with the expectation that its price will fall, and then planning to buy it back at a lower price to profit from the difference. However, the crypto markets are known for their high volatility and the widespread use of leverage, particularly in perpetual futures contracts. Leverage allows traders to control a much larger position than their initial capital would normally allow, amplifying potential profits but also, crucially, potential losses.
When the market moves sharply against a leveraged short position – meaning Bitcoin's price surges upwards – traders can face a margin call. If they cannot add more funds to cover their mounting losses, the exchange automatically closes their position to prevent further debt. This forced closure is a liquidation. The $31 million wipeout signifies that a substantial volume of bets on Bitcoin's price decline was overwhelmed by a potent wave of buying pressure.
This mass liquidation event has several implications. Firstly, it inflicts significant financial pain on those who were positioned for a downturn, effectively Bitcoin bears losing out on their wagers. Secondly, these forced closures inherently involve buying Bitcoin to cover the short positions, which paradoxically adds more fuel to the upward price movement. This can trigger a "short squeeze," where rising prices force more shorts to cover, leading to further liquidations and an accelerated price rally. Such events bolster bullish sentiment, demonstrating underlying market strength and deterring further aggressive short selling. It’s a clear signal that the market's undercurrent was far more robust than the bears had anticipated.
On the Cusp of a New Frontier: The Critical Weekly Close and "Price Discovery 2"
The excitement among Bitcoin proponents is palpable, with many analysts asserting that Bitcoin bulls are on the cusp of launching the market back to all-time highs and beyond. Central to this optimistic outlook is the focus on an upcoming, crucial weekly close. According to prevailing technical analysis, Bitcoin must close the week above a specific, strategically important price level to start 'price discovery 2'.
"Price discovery" is the process by which market participants determine the fair value of an asset through their buying and selling activities. When an asset like Bitcoin surpasses its previous all-time high (ATH), it enters a phase where historical resistance levels cease to exist. This is true price discovery – the market is venturing into uncharted territory, with no past price ceilings to act as psychological or technical barriers. "Price Discovery 1" can be considered Bitcoin's journey to its previous peak (around $69,000 in November 2021). The term "Price Discovery 2" thus implies a new, sustained bull run that would take Bitcoin significantly beyond that former zenith.
The significance of a "weekly close" above a key resistance level cannot be overstated in technical analysis. Weekly charts smooth out short-term noise and are often seen as better indicators of major trend shifts. A decisive weekly close above, say, the previous ATH or a major interim peak, would be a powerful confirmation for many traders and investors that the bulls are firmly in control. It would invalidate bearish scenarios that predicted a rejection at these upper levels and would likely attract a fresh wave of capital into the market.
Several potent catalysts could fuel this ascent into "Price Discovery 2." The quadrennial Bitcoin halving event, the most recent of which occurred in April 2024, historically constricts the new supply of Bitcoin, often leading to significant price appreciation in the months and years that follow as demand outstrips this reduced supply. Continued institutional adoption, evidenced by wealth funds accumulating Bitcoin, provides a steady stream of large-scale buying pressure. Furthermore, a challenging macroeconomic environment, characterized by persistent inflation in major fiat currencies or geopolitical uncertainties, can enhance Bitcoin's appeal as a non-sovereign store of value and a hedge against systemic risks. Should Bitcoin achieve this critical weekly close and embark on "Price Discovery 2," the upside could be substantial, as the market seeks to establish a new equilibrium in uncharted price territory.
The Unwavering Standard: Bitcoin Doesn’t Need to Change, The World Does
Amidst the price charts and market analyses, a more profound narrative is solidifying: Bitcoin doesn’t need to change; the world does. For years, critics have argued that Bitcoin should be faster, cheaper, greener, often comparing its transaction throughput or energy consumption to centralized payment networks or newer, less proven blockchain protocols. However, an increasing number of proponents argue that maybe the point isn’t to fix Bitcoin. Maybe it’s to fix everything else with Bitcoin.
This perspective champions Bitcoin's core attributes – often perceived as limitations by detractors – as its most vital strengths:
• Unparalleled Decentralization: Bitcoin operates on a globally distributed network with no single point of control. This makes it resistant to censorship, shutdown, or manipulation by any government or corporation. In an age of increasing financial surveillance and control, this is a feature, not a bug.
• Robust Security and Immutability: The Proof-of-Work (PoW) consensus mechanism, while energy-intensive, is what underpins Bitcoin's formidable security. The immense computational power dedicated to mining creates an economic fortress around the network, making its transaction history virtually tamper-proof. While the "greener" argument often pushes for alternatives like Proof-of-Stake (PoS), many believe PoW offers a unique level of objective security crucial for a global store of value. Moreover, the narrative around Bitcoin's energy use is evolving, with increasing adoption of renewable and stranded energy sources for mining, and a growing recognition that its energy consumption is a worthwhile trade-off for securing a truly independent financial system.
• Absolute Scarcity: Bitcoin's supply is capped at 21 million coins, a hard-coded limit that cannot be altered. This programmatic scarcity makes it a powerful antidote to the inflationary pressures inherent in fiat currencies, which can be created limitlessly by central banks. This "digital gold" characteristic is fundamental to its value proposition.
• Layered Scaling: While the Bitcoin base layer prioritizes security and decentralization over raw transaction speed, innovation is flourishing on Layer 2 solutions like the Lightning Network. These protocols enable fast, low-cost transactions by batching them off-chain and settling them periodically on the main Bitcoin blockchain, thus allowing Bitcoin to scale for everyday payments without compromising its core principles.
The argument is that instead of trying to mold Bitcoin to fit the constraints of the old financial world, we should recognize how its unique properties can address the systemic flaws within that world – issues like inflation, financial exclusion, censorship, and counterparty risk. Bitcoin, in its current form, offers a radical, resilient alternative.
The Silent Infiltration: Wealth Funds Build Up Bitcoin Holdings
Further bolstering the bullish case is the ongoing, often understated, trend of Bitcoin’s Quiet Coup: Wealth Funds Build Up Holdings. This isn't about flashy headlines but rather a methodical, strategic accumulation of Bitcoin by sophisticated institutional investors, including pension funds, endowments, sovereign wealth funds, and large family offices.
These entities, traditionally conservative and managing trillions of dollars in assets, are increasingly allocating a portion of their portfolios to Bitcoin. Their motivations are manifold:
• Diversification: Bitcoin has historically exhibited low correlation with traditional assets like stocks and bonds, making it an attractive addition for enhancing portfolio risk-adjusted returns.
• Inflation Hedge: In an environment of persistent global inflation, Bitcoin's finite supply positions it as a potential store of value, a digital hedge against currency debasement.
• Asymmetric Upside: Even a small allocation to Bitcoin can offer significant upside potential, an appealing proposition for large funds seeking growth.
• Growing Regulatory Clarity and Infrastructure: The approval of Bitcoin ETFs in major jurisdictions like the U.S. has provided regulated and accessible avenues for institutional investment, alongside the development of institutional-grade custody and trading solutions.
This "Quiet Coup" signifies a maturing perception of Bitcoin, moving it from a speculative niche asset to a legitimate component of institutional investment strategy. The steady inflow of significant capital from these large players not only provides price support but also lends credibility and encourages further adoption, potentially reducing long-term volatility as more Bitcoin is held by entities with long-term horizons.
Reading the Bullish Tea Leaves: Bitcoin Funding Rates Remain Positive
Adding another layer of confirmation to the prevailing bullish sentiment is the observation that Bitcoin Funding Rates Remain Positive On Binance — Strong Uptrend Confirmed? Funding rates are a key mechanism in cryptocurrency perpetual futures markets, designed to keep the price of the perpetual contract aligned with the spot price of the underlying asset.
When funding rates are positive, it generally means that traders holding long positions (betting on a price increase) are paying a premium to those holding short positions. This indicates a higher demand for long leverage, reflecting overall bullish sentiment in the derivatives market. Consistently positive funding rates on a major exchange like Binance, which boasts significant trading volume, suggest that this optimism is sustained. It implies that traders are confident enough in Bitcoin's upward trajectory to pay a recurring fee to maintain their leveraged long positions.
While extremely high funding rates can sometimes signal an over-leveraged market ripe for a correction (a "long squeeze"), moderately and persistently positive rates, as currently observed, are often interpreted as a healthy sign of a strong and well-supported uptrend. It suggests that the rally is not just speculative froth but is backed by conviction among active traders.
Conclusion: A Perfect Storm for Bitcoin's Next Chapter?
As May 2025 progresses, the confluence of factors points towards a potentially transformative period for Bitcoin. The $31 million decimation of short positions serves as a stark reminder of the perils of underestimating Bitcoin's strength. The market's eager anticipation of a weekly close that could unlock "Price Discovery 2" highlights the potent bullish technical setup. This is further reinforced by the fundamental conviction that Bitcoin's core design is its ultimate strength, offering solutions the traditional financial world desperately needs.
The quiet, strategic accumulation by wealth funds injects not only capital but also a profound sense of legitimacy, while positive funding rates reflect a confident and sustained bullish sentiment among active traders. While the path ahead will undoubtedly feature volatility – a characteristic inherent to Bitcoin's journey – the current alignment of technical indicators, institutional adoption, strong market sentiment, and a compelling fundamental narrative suggests that Bitcoin bears may indeed be losing out, and significantly so. The stage appears set for Bitcoin to not only challenge its previous highs but to potentially embark on a new, exhilarating phase of growth and adoption, further solidifying its role in the evolving global financial order.

BTCUSD Technical Analysis – V-Shaped Recovery Points to BreakoutBitcoin (BTCUSD) is showing strong bullish momentum following a textbook V-shaped recovery from the recent support zone around $73,699. After consolidating and breaking the descending channel, BTC surged with conviction, reclaiming critical levels and now approaching the previous All-Time High (ATH).
Key Technical Highlights
Pattern: V-Shaped Recovery
Support Zone: $73,699 – $75,000
Resistance/ATH: $109,255
Trendline: Long-term bullish trend remains intact
Recent Breakout: Clean breakout above the falling wedge/descending channel
BTC has reversed sharply from the bottom, printing higher highs and higher lows. This aggressive rebound has brought price action back toward ATH levels, with strong chances of a breakout continuation.
The structure suggests bullish control, especially after retesting key areas with strength.
Bitcoin Dominance at 62.2%
Bitcoin's market dominance sits at 62.2%, showing clear investor confidence and capital preference for BTC over altcoins. This dominance level reinforces the bullish bias as smart money flows into Bitcoin in anticipation of a potential price discovery breakout.
This trend, along with large institutional inflows, highlights a growing belief in BTC’s strength as a leading asset, especially in the current macro environment.
BTCUSD Trade Setup (As Per Chart)
🎯 Entry $104,732.85
⛔ Stop Loss $99,507.06
✅ Take Profit $114,359.25
The trade idea is based on the continuation of the current uptrend and breakout above $109,255, which previously acted as resistance (ATH). A clean daily close above this level would likely open the path toward $114,359 and possibly $116,000+ as the next milestone.
BTC is primed for a new leg higher. The market structure favors bulls with BTC dominance rising, large investments entering, and strong technical recovery in place. If Bitcoin holds above the entry zone and pushes through ATH, we may see a new high forming in the coming weeks.

BITCOIN Has Unfinished Business Below $74K! Will It Return?Key Disclaimer: Inefficiencies Don’t Need to Be Filled
Let’s set the stage clearly: inefficiencies like the one at $73,624.98–$74,420.69 for BTCUSD do not HAVE to be filled.
They’re a TENDENCY, not a rule, an intriguing opportunity to explore high-probability zones. If Bitcoin doesn’t return to this level, no harm is done; but this is a very good opportunity to analyze the term, as such... let’s break it down.
What Is an Inefficiency?
An inefficiency, or sometimes a fair value gap (FVG), is a price range with "minimal" trading activity, often caused by a rapid move—here, a rally—creating a liquidity imbalance. On the weekly BTCUSD chart, this area between wicks spans $73,624.98 to $74,420.69, likely formed during a sharp rally around April 2025.
This untested range makes it a potential target for future price action, as markets often seek to resolve such imbalances. Notably, the price has already approached this zone, and there’s a chance it may never return. However, around $74,400, there are still some “unfinished things to do”, untested liquidity, or orders, which could draw the price back if conditions align.
Why Do Inefficiencies Attract Price?
Inefficiencies often act as magnets for price due to:
Liquidity Seeking: Markets revisit areas with unfilled liquidity (stop-loss or pending orders) to balance supply and demand.
Market Memory: Traders and algorithms, target these levels, reinforcing their significance.
Mean Reversion: After rapid rallies, the price may retrace to test imbalances before continuing. (atm we are probably too far from it but still keep this area in your minds)
Institutional Activity: Large players might re-enter at these levels, making them key zones for reversals or consolidation.
Historically, assets tends to revisit such areas, as the chart notes.
BTCUSD Context: $103,000 with Bullish Momentum
As of May 10, 2025, BTCUSD is at ~$103,200 on the weekly chart, on the way to confirm a weekly breakout above $100,000, supported by higher highs, an ascending channel, and macro factors ( for example ETF inflows), signaling quite a strong momentum.
The inefficiency at $73,624.98–$74,420.69 is 28–29% below the current price, a deep pullback that might require a catalyst like a macro correction, negative crypto news, or profit-taking. Given the price has already approached this zone, it may not return, but the “unfinished business” around $74,400 keeps it on the radar. Still, strong trends can bypass inefficiencies, and factors like time decay or adoption may drive prices higher.
Trading Approach, Short-, Mid-Term Investors Take Your Profits!
This formation of inefficiency is not a prediction to short, it’s an opportunity to monitor.
Still, if you’re a short- to mid-term investor, it might be a smart move to take some profits here and observe what unfolds next.
Right now, we’re potentially seeing a double top forming around major psychological levels. And to be honest, the inefficiency below (shown on the chart) still lingers in the back of my mind.
People often ask me: “When is a good time to take profits?”
My answer? Now. It is a perfect example and it fits to all assets.
And here's why. There are clear scenarios that help remove the guesswork:
1. You sell now, and the price continues to rally higher.
That’s not a problem. By selling, you’ve reduced your risk, and securing your profits - always a smart move.
If the price breaks above $100K, you can always buy it back after a confirmed breakout and retest.
That’s a strong sign that investors are willing to pay higher prices for BTC, and historically, after such breakouts (like with the $50K level in August 2024), the market tends to come back to retest that breakout zone.
Of course, if you’re a long-term investor with a 3-5+ year horizon, you may choose to ride it out. In that case, trying to time this might just be over-managing your position. There’s always a chance BTC won’t retest $100K again.
2. The best-case scenario if you take profits now:
You get the chance to buy back lower.
If the market pulls back, keep that inefficiency level in mind—there’s also a mid-term trendline, previous yearly highs, and other technical elements that haven’t been tested yet.
Traders’ psychology hasn’t really been pushed to the limits at this stage, and in my view, the crypto market loves to test limits.
So if you’re a short- or mid-term investor who bought in at lower levels, this is a good time to seriously consider locking in some profits.
Step back, and let the price action guide the next move.
Listen—just listen.
Conclusion
Inefficiencies like the one between $73,624 and $74,420 don’t demand to be filled—but they’re worth understanding, tracking, and learning from. Whether price revisits that zone or not, the real value lies in recognizing where the market has moved too fast and what that might mean if momentum shifts.
Right now, BTCUSD is strong. But strength can fade, sentiment can shift, and “unfinished business” below still holds weight for traders who think in probabilities, not certainties.
If you’re in profit—especially from lower levels—this might be one of those moments to pause, and make sure greed isn’t driving your next decision.
Whether this zone becomes just a memory or a brilliant case study, it’s already a valuable example of how understanding market structure helps you stay a step ahead—not a step behind.
Stay alert. Stay humble. And as said… listen.
Cheers,
Vaido

ETH : What the Options Are Saying (Hint: Big Move Ahead)Right now, Ethereum’s key players are positioning themselves to make some money on the rise.
And guess what? The market's already whispering where it’s headed next — but only if you know how to listen. And the loudest voice right now? Options flow on Deribit.
Let me break it down for you…
---
We caught some serious heat in the options pit lately. On Deribit, someone — or maybe a few someones — started stacking **Call options on ETH at 1,800 and 2,200 strike prices**, all under one portfolio. That’s not random. That’s a classic **Call Spread** setup, expiring June 27, 2025.
Translation? Someone’s betting hard on ETH heading north — straight toward **$2,200**.
But here's where it gets spicy. The **Max pain** for this contract sits right at **$2,000** — currently above spot price. Yeah, we’ve seen mixed stats on whether "price gravitates" to max pain like magic. But from experience? Right before expiry, price tends to *flirt* with that level.
So here's our read:
- There's **bullish sentiment** building.
- Eyes are locked on the **$2,200 zone** — likely within the next **30–50 days**.
- BTC’s playing the same game — big interest around **$100K–$110K strikes**, same expiry.
This isn’t noise. This is signal.
---
If you're tired of FOMO and want to catch the real setups before they blow up — follow. We turn complex flows into simple edge. Just actionable insights.
---
📈 *Trade smart. Stay sharp.
Join the crew that reads the market — not the hype.

Bitcoin Weekend MAPIm expecting a pullback this weekend and a new Buy
Levels in the chart
Manage Risk and Levels can be sligly different i track them as they approach
GG

Bitcoin Smashes $103K: Is $150K Just Around the Corner?Bitcoin's Resurgence: Navigating the $100K Breakthrough and What Comes Next
In a remarkable display of market resilience, Bitcoin has reclaimed the coveted $100,000 level, just three months after dropping below this significant psychological threshold. The flagship cryptocurrency's powerful comeback has sent shockwaves through financial markets, triggering a massive short squeeze and reigniting debates about Bitcoin's long-term potential. As the asset pushes beyond $103,000 and approaches its previous all-time high, traders and investors are scrambling to position themselves for what many believe could be the next phase of an extraordinary bull cycle.
The Historic Reclamation of $100K
Bitcoin's journey back to $100,000 represents more than just a numerical milestone—it's a testament to the asset's remarkable resilience in the face of significant headwinds. After briefly touching six-figure territory in early 2025, Bitcoin experienced a substantial correction that saw prices retreat below $90,000, triggering concern among market participants and no shortage of bearish predictions from skeptics.
What makes this recovery particularly impressive is the speed with which it occurred. Historically, Bitcoin has often experienced extended consolidation periods after major corrections, sometimes lasting months or even years. The rapid three-month turnaround suggests underlying strength in Bitcoin's market structure that distinguishes this cycle from previous ones.
On-chain data reveals fascinating dynamics behind the recovery. Throughout the correction, long-term holders continued accumulating Bitcoin, with wallet addresses holding more than 1 BTC increasing by 5.2% even as prices declined. This pattern of "smart money" accumulation during periods of retail fear often precedes significant upward price movements.
The reclamation of $100,000 also coincided with several favorable macro developments, including renewed expectations for central bank easing and diminishing concerns about regulatory crackdowns. These factors, combined with Bitcoin's post-halving supply dynamics, created ideal conditions for a powerful recovery.
The Massive Short Squeeze
A key accelerant in Bitcoin's surge beyond $100,000 was an extraordinary short squeeze that forced bearish traders to cover their positions at increasingly higher prices. Data from cryptocurrency derivatives platforms reveals that over $850 million in short positions were liquidated during a 72-hour period as Bitcoin broke above key resistance levels.
The mechanics of a short squeeze are particularly powerful in cryptocurrency markets due to the prevalence of leverage. Many platforms offer leverage ratios of 10x, 20x, or even higher, meaning relatively small price movements can trigger automatic liquidations. As these liquidations occur, trading algorithms automatically purchase Bitcoin to close the short positions, creating additional upward pressure on prices and potentially triggering more liquidations in a self-reinforcing cycle.
What made this particular short squeeze especially impactful was its timing relative to market sentiment. The Crypto Fear & Greed Index had been hovering in "Neutral" to "Fear" territory for weeks, indicating widespread caution among market participants. This cautious positioning resulted in a market structure where relatively few traders were positioned for upside, creating the perfect conditions for a powerful squeeze when momentum shifted.
Is $150,000 Now Conservative?
In light of Bitcoin's powerful resurgence, price predictions that once seemed ambitious are being reevaluated. Earlier this year, several major financial institutions and research firms issued year-end targets of $150,000 for Bitcoin—forecasts that were met with skepticism by many market observers. Now, with Bitcoin already above $103,000 and demonstrating strong momentum, these once-ambitious targets appear increasingly conservative.
Technical analysts point to several factors supporting the case for higher prices. The weekly Relative Strength Index (RSI), despite the recent surge, remains below extreme overbought levels that typically signal exhaustion. Additionally, volume profiles show relatively little resistance above the previous all-time high, suggesting potential for rapid advancement if that level is breached.
The most bullish analysts have begun floating targets of $170,000 to $200,000 for this cycle, basing their projections on Fibonacci extensions, comparative analysis with previous bull markets, and on-chain metrics indicating strong holder conviction. These projections represent a dramatic shift in market sentiment compared to just a few months ago when many were questioning whether Bitcoin would reclaim $100,000 within the year.
Is It Too Late to Buy Bitcoin?
As Bitcoin pushes beyond $103,000, the perennial question resurfaces: is it too late to buy Bitcoin? This query, which has appeared at virtually every significant price level in Bitcoin's history, reflects the challenge of evaluating assets in price discovery mode without extensive historical reference points.
Historical perspective offers valuable context for addressing this question. Investors who asked whether it was "too late" to buy Bitcoin at $10,000, $20,000, or $50,000 and chose to remain on the sidelines missed substantial returns. However, those who purchased at local tops often endured extended drawdowns before seeing their investments return to profitability.
On-chain data provides additional perspective for evaluating current price levels. The MVRV (Market Value to Realized Value) ratio, which compares Bitcoin's market capitalization to its realized capitalization, currently sits around 2.8—elevated compared to bear market conditions but significantly below the extreme readings above 4.0 that characterized previous market tops.
Similarly, the percentage of Bitcoin supply in profit currently stands at approximately 93%, approaching but not yet reaching the 98-99% levels typically seen at cycle peaks. These metrics suggest that while Bitcoin isn't in "bargain" territory, present valuations haven't reached the extreme overvaluation levels that preceded major corrections in previous cycles.
Bull Run Warning: Navigating the Path Forward
While enthusiasm surrounds Bitcoin's reclamation of $100,000, experienced market participants recognize the importance of maintaining perspective during periods of strong momentum. Several potential warning signs merit attention as traders navigate the current environment.
The rapid nature of Bitcoin's ascent to $103,000 has created technically overbought conditions on shorter timeframes, suggesting the potential for near-term consolidation or pullbacks. The daily RSI has reached levels above 80, a zone that has historically preceded at least temporary pauses in uptrends, even during the strongest bull markets.
Additionally, funding rates on perpetual futures contracts have reached extremely positive levels, indicating traders are paying significant premiums to maintain long positions. This condition often occurs near local tops as market participants become overly enthusiastic about near-term prospects.
Risk management becomes particularly important during such periods of strong momentum. Many professional traders reduce position sizes when volatility increases, recognizing that while potential returns expand during such phases, so do potential drawdowns.
Next Price Targets: From $106K to $1M
As Bitcoin pushes into record territory, analysts have begun identifying potential targets for the next phase of the bull cycle. The immediate focus remains on the previous all-time high around $106,000, which represents both a psychological and technical resistance level. Beyond this point, limited historical price action creates a potential vacuum that could allow for rapid advancement if bullish momentum continues.
Technical analysts have identified several key levels through Fibonacci projections and extension analysis. The 1.618 Fibonacci extension from the previous major correction projects a target around $122,000, while the 2.618 extension suggests potential toward $170,000. These levels represent natural points where the market might experience resistance or consolidation during continued uptrends.
More ambitious predictions extend considerably higher. The stock-to-flow model, which relates Bitcoin's scarcity to its market value, suggests potential long-term valuations approaching $1 million per Bitcoin. While such forecasts remain highly speculative, they illustrate the wide range of potential outcomes for this emerging asset class.
Support levels are equally important to monitor, particularly for traders managing risk in leveraged positions. The psychological $100,000 level now represents initial support, followed by the $94,000-$96,000 zone where significant buying emerged during the recent advance. The 50-day moving average, currently around $92,000 and rising, provides an additional technical reference point for potential support during pullbacks.
Market Sentiment: Fear and Greed Dynamics
Market sentiment indicators provide valuable context for understanding Bitcoin's current positioning. The Crypto Fear & Greed Index has shifted into the "Greed" zone after spending much of the previous month in "Neutral" territory, reflecting improved market sentiment following Bitcoin's reclamation of $100,000.
This transition marks an important psychological shift but also signals increasing risk of overexuberance. Historically, when the index reaches extreme readings in either direction, it has often served as a contrarian indicator. Extreme greed readings have typically occurred near local tops, while extreme fear has often presented buying opportunities.
Social media activity metrics reveal a significant increase in Bitcoin-related discussions, with sentiment analysis showing predominantly positive expressions. Google Trends data indicates search interest for "Bitcoin" has reached its highest level since January, suggesting renewed attention from retail participants who typically enter during periods of strong price performance.
Institutional sentiment provides a contrasting perspective to retail excitement. Surveys of professional investors indicate a more measured outlook, with many maintaining Bitcoin allocations but expressing concern about near-term volatility and the potential for consolidation after the recent surge. This divergence between institutional caution and retail enthusiasm creates an interesting dynamic that may influence price action in the weeks ahead.
Trading Strategies for the Current Environment
For traders navigating Bitcoin's volatile price action, adapting strategies to current market conditions is essential. Different approaches suit varying risk tolerances and time horizons, particularly during periods of expanded volatility and strong directional momentum.
Trend-following strategies have performed exceptionally well during Bitcoin's recent advance, with systematic approaches based on moving average crossovers or momentum indicators capturing much of the upside movement. These strategies typically involve entering positions when short-term momentum aligns with longer-term trends and using trailing stops to protect profits.
Countertrend strategies face greater challenges in the current environment but can still prove effective when applied with appropriate risk parameters. These approaches involve identifying potential exhaustion points where trends might temporarily reverse, typically using oscillators like RSI or Stochastic indicators to identify overbought or oversold conditions.
For longer-term investors, dollar-cost averaging continues to demonstrate effectiveness in navigating volatile markets without requiring precise timing decisions. This approach involves regularly purchasing Bitcoin in fixed dollar amounts regardless of price, mathematically ensuring better average entry prices during periods of volatility.
Conclusion: Navigating Bitcoin's New Era
Bitcoin's resurgence beyond $100,000 represents a significant milestone in cryptocurrency market development, potentially signaling the beginning of the next phase in this remarkable asset's evolution. The speed and magnitude of the recovery from below $90,000 to above $103,000 demonstrates both the volatility inherent in this emerging asset class and the powerful market forces that can drive prices when technical breakouts coincide with favorable fundamental catalysts.
For traders and investors, the path forward requires balancing enthusiasm about Bitcoin's demonstrated resilience with pragmatic risk management appropriate for an asset capable of significant price swings in both directions. While the backdrop appears favorable for continued strength, history suggests the journey will include both exhilarating advances and challenging retracements.
As market participants position themselves for what may come next, maintaining perspective on both historical precedents and the unique aspects of the current market cycle provides the most sustainable approach to navigating this dynamic landscape. Bitcoin's breakthrough beyond $100,000 creates both opportunity and risk—the traders who successfully balance these competing forces while maintaining disciplined execution will likely find the greatest success in capturing the potential of this extraordinary market.
The question is no longer whether Bitcoin can reach $100,000, but rather how far beyond this once-unimaginable milestone the current cycle might extend. For an asset that began trading at fractions of a penny, the reclamation of six-figure territory serves as a powerful reminder of cryptocurrency's capacity to challenge conventional financial assumptions and create paradigm-shifting returns for those willing to embrace both its potential and its risks.

#BTCUSDT: Will Bitcoin Make Any Correction To $90,000?Hey Everyone,
Happy Sunday
Currently, Bitcoin’s price is consolidating within a shorter timeframe, which has heightened the likelihood of it reaching the $90,000 ‘FVG’ region. However, this could be attributed to the hectic week we experienced, with numerous significant market announcements that have heightened uncertainty in the cryptocurrency market. At present, there are two opportunities for Bitcoin: one is riskier, while the other is considerably safer. You can utilise this analysis as a secondary bias.
We extend our best wishes and good luck in your trading endeavours. Your unwavering support is greatly appreciated.
If you wish to contribute, here are several ways you can assist us:
- Like our ideas
- Comment on our ideas
- Share our ideas
Team Setupsfx_🚀❤️

Stromm | BITCOIN Are You BULLISH Enough? When you zoom out to the 12-hour chart , Bitcoin actually looks really clean right now. Since my entry at $75,800, we’ve seen a solid 25% rally that’s clearly shifted the momentum back to bullish. -
But even with that move, I’m not fully convinced yet that we’re on our way straight to a new all-time high.
There’s still a lot of work to be done before that happens.
Right now, I’m watching the zone between $96,400 and $102,300 as a potential reaction area — basically a spot where we could see Wave B complete.
We’re hovering around the Yearly Open, which historically acts as both strong support and resistance, and we’re also right at the Previous Monthly High.
If BTC can hold this zone, we absolutely could push higher toward $102K.
However, I don’t think it’s realistic yet to expect a clean shot to $110K without a deeper pullback first.
Most likely, we’ll need another flush lower to reset before any major breakout.
That said, I’m still long and staying patient.
If we do somehow rip toward $120K, I’m already well-positioned.
And if we get another sell-off?
I’ll be adding even more — no hesitation there.
Of course, a lot of this depends on how the political and macro situation evolves.
There’s definitely a world where the perfect narrative gets laid down, and we rocket to $120K.
But there’s also a world where that doesn't happen — and it’s important to stay mentally flexible between "must happen," "could happen," and "might not happen at all."

BTC Overextended: Awaiting the Perfect Pullback for a BuYBTC/USDT Analysis – 1D Timeframe
Bitcoin is currently looking overextended on the daily chart 📈, with price action pushing directly into a well-defined key resistance level 🚧. This area has historically acted as a strong supply zone, and with momentum appearing stretched, I’m anticipating a potential retracement in the near term.
My plan is to wait for BTC to pull back towards previous support zones Around the 61.8 Fibo level🛡️. I have a clear Point of Interest (POI) marked out, where I’ll be watching for price to react. If we see a bullish Break of Structure (BOS) on the pullback—I’ll be looking for a long entry from this area 🎯.
Key Levels to Watch:
Resistance: Current daily highs (where price is overextended) 🚩
Support/POI: Previous consolidation and demand zones below, which have shown strong buying interest in the past 🏦
Trade Plan:
- No FOMO entries at resistance! ❌
- Wait for a clean retrace into my POI
- Look for bullish confirmation (BOS) on lower timeframes before entering long ✅
- Manage risk accordingly and trail stops if the move plays out
Summary:
Patience is key here. I’m not interested in chasing price into resistance. Instead, I’ll let the market come to me and only act if my criteria are met. If BTC gives us the pullback and a bullish BoS, I’ll be ready to take the trade. Until then, I’m on the sidelines and monitoring price action closely 👀.
Disclaimer:
This analysis is for educational purposes only and does not constitute financial advice. Always do your own research and manage your risk appropriately. Trading cryptocurrencies involves significant risk and may not be suitable for all investors. 🚨

Ether-Bitcoin Ratio Signals ETH Is 'Extremely Undervalued,' The cryptocurrency market is a realm of intricate signals, complex metrics, and often-conflicting narratives. Among the myriad indicators traders and investors scrutinize, the Ether-Bitcoin (ETH/BTC) ratio holds a prominent place. This metric, a simple division of Ethereum’s price by Bitcoin’s price, serves as a barometer for the relative strength and market sentiment between the two leading crypto assets. Recently, this ratio has dipped to levels that historically signaled significant undervaluation for Ether, sparking debate about a potential upcoming rally. However, a confluence of factors – notably surging ETH supply, stagnant network demand, and a weakened token burn mechanism – casts a considerable shadow over this optimistic outlook, suggesting that past performance may not be a reliable guide in the current, uniquely challenging environment.
Understanding the ETH/BTC Ratio: A Barometer of Relative Strength
At its core, the ETH/BTC ratio reflects the market's perception of Ethereum's value proposition relative to Bitcoin. When the ratio trends upwards, it indicates that ETH is outperforming BTC, suggesting growing investor confidence in Ethereum's ecosystem, technological advancements, or utility. Conversely, a declining ratio signifies BTC's relative strength, potentially due to factors like "digital gold" narratives, safe-haven appeal, or specific Bitcoin-centric catalysts.
A low ETH/BTC ratio, such as those observed in recent times, is often interpreted by analysts as a sign that ETH is "cheap" or "undervalued" compared to Bitcoin. The logic is that, over time, capital flows within the crypto market tend to seek out assets with stronger growth potential or those perceived as lagging behind their fundamental value. If ETH is indeed undervalued, the expectation is that it will eventually catch up, leading to a rally in both its USD price and its value relative to BTC. This potential for "mean reversion" or a "catch-up trade" is what excites many market participants when the ratio hits historical lows.
Historical Precedents: When Undervaluation Sparked Rallies
The argument for an impending ETH rally based on the current low ETH/BTC ratio is not without historical merit. There have been several instances where a depressed ratio preceded substantial upward movements for Ether.
1. Post-2018 Crypto Winter: After the ICO boom and subsequent crash, the ETH/BTC ratio languished for an extended period. However, as the DeFi (Decentralized Finance) ecosystem began to gain traction in 2020 ("DeFi Summer"), ETH, as the foundational layer for most DeFi protocols, experienced a resurgence. The ratio climbed significantly as capital flowed into Ethereum to participate in yield farming, lending, and decentralized exchange activities.
2. The NFT Boom (2021): The explosion of Non-Fungible Tokens (NFTs) in early 2021, predominantly on the Ethereum blockchain, provided another major catalyst. The increased demand for ETH to mint, buy, and sell NFTs pushed its price and the ETH/BTC ratio upwards, as Ethereum's utility as a platform for digital collectibles and art became undeniable.
3. Anticipation of The Merge (2021-2022): As Ethereum moved closer to its pivotal transition from Proof-of-Work (PoW) to Proof-of-Stake (PoS) – "The Merge" – market sentiment turned increasingly bullish. The promise of significantly reduced energy consumption, coupled with the "ultrasound money" narrative (where ETH issuance would drastically decrease and potentially become deflationary due to EIP-1559's burn mechanism), fueled strong buying pressure. The ETH/BTC ratio saw notable gains during periods of heightened Merge anticipation.
In these instances, the low ETH/BTC ratio acted as a tinderbox, and specific fundamental catalysts served as the spark that ignited significant rallies. Investors who recognized the undervaluation signal and anticipated these catalysts were handsomely rewarded. This historical pattern underpins the current optimism among some analysts who see the present low ratio as a similar buying opportunity.
The Complicating Factors: Why This Time Might Be Different
Despite the compelling historical precedents, the current market environment for Ethereum presents a unique set of challenges that complicate the simple "undervalued, therefore rally" thesis. These headwinds stem from fundamental shifts in Ethereum's tokenomics and network dynamics.
1. Surging Supply: The Post-Merge Issuance Reality
While The Merge successfully transitioned Ethereum to a more environmentally friendly PoS consensus mechanism, its impact on ETH supply has been more nuanced than initially portrayed by some bullish narratives.
• Staking Rewards: Under PoS, new ETH is issued as rewards to validators who stake their ETH to secure the network. While the rate of new ETH issuance is significantly lower than it was under PoW, it is still a consistent inflationary pressure. The annual inflation rate from staking rewards is currently in the low single digits.
• Net Issuance vs. Deflation: The "ultrasound money" thesis largely depended on the EIP-1559 burn mechanism (discussed later) consistently burning more ETH than is issued through staking rewards, leading to a net deflationary supply. However, this has not always been the case post-Merge. There have been extended periods where ETH has been net inflationary.
• Unstaking and Liquid Staking Derivatives: The ability for validators to unstake their ETH (enabled by the Shanghai/Capella upgrade) means that previously locked supply can re-enter the market. Furthermore, the proliferation of Liquid Staking Derivatives (LSDs) like Lido's stETH or Rocket Pool's rETH, while enhancing capital efficiency, also means that staked ETH is not entirely removed from liquid circulation, as these derivative tokens can be traded or used in DeFi.
This consistent, albeit reduced, issuance contributes to sell pressure, especially if demand does not keep pace. The narrative of ETH becoming a deflationary asset has been weakened, impacting one of the key bullish arguments that previously supported a higher ETH/BTC ratio.
2. Flat Demand: A Stagnant Network Picture
For ETH's price to appreciate significantly, there needs to be robust demand for the token, driven by network usage and adoption. Currently, several indicators suggest that demand is, at best, flat, and in some areas, declining.
• Network Activity Metrics: Key on-chain metrics such as daily active addresses, transaction counts, and total gas consumed have shown periods of stagnation or even decline. While Layer 2 scaling solutions are processing more transactions, this activity doesn't always translate directly into proportional demand for ETH on the mainnet, especially if Layer 2s manage their own fee markets efficiently.
• Total Value Locked (TVL) in DeFi: While DeFi remains a cornerstone of Ethereum's value proposition, the growth in TVL has slowed considerably compared to the explosive growth seen in 2020-2021. Capital inflows into DeFi protocols on Ethereum have been less aggressive, partly due to macroeconomic conditions, regulatory concerns, and the emergence of competitive DeFi ecosystems on other blockchains.
• Competition from Alternative Layer 1s and Layer 2s: Ethereum faces increasing competition from other Layer 1 blockchains (e.g., Solana, Avalanche, Aptos, Sui) that offer higher throughput and lower transaction fees, attracting users and developers. Moreover, Ethereum's own Layer 2 ecosystem (e.g., Arbitrum, Optimism, Polygon zkEVM, Starknet, zkSync Era), while crucial for its long-term scalability, also fragments user activity and can, in some ways, reduce direct demand pressure on ETH for L1 transactions if users primarily operate within these L2 environments.
• Macroeconomic Headwinds & Regulatory Uncertainty: Broader economic conditions, including inflation, interest rate hikes, and recession fears, have generally dampened risk appetite across financial markets, including crypto. Additionally, the ongoing regulatory uncertainty in key jurisdictions like the United States creates an environment of caution, potentially hindering institutional adoption and large-scale investment in assets like ETH.
• NFT Market Cool-Down: The NFT market, which was a significant driver of ETH demand, has experienced a substantial cool-down from its peak in 2021-2022. While innovation continues, transaction volumes and average sale prices have fallen, reducing the ETH velocity associated with this sector.
Without a significant uptick in genuine network demand – more users transacting, more capital flowing into DeFi, a resurgence in NFT activity, or new killer dApps emerging – it becomes harder for ETH to absorb the ongoing supply issuance and stage a sustainable rally.
3. Weakened Burn Mechanics: The Diminished Impact of EIP-1559
EIP-1559, implemented in August 2021, was a landmark upgrade for Ethereum. It introduced a mechanism where a portion of every transaction fee (the "base fee") is burned, permanently removing that ETH from circulation. This was a key pillar of the "ultrasound money" narrative, as it created a deflationary pressure that could, under conditions of high network demand, outpace new ETH issuance.
However, the effectiveness of this burn mechanism is directly tied to network congestion and the level of the base fee.
• Lower Network Congestion: In periods of lower network activity and congestion (as has been observed more frequently recently), the base fee required to get transactions included in a block decreases. A lower base fee means less ETH is burned per transaction.
• Impact of Layer 2s: As more transaction activity shifts to Layer 2 scaling solutions, which have their own, typically much lower, fee structures, the demand for block space on Ethereum Layer 1 can decrease. While L2s do periodically batch transactions and settle them on L1 (consuming L1 gas and contributing to the burn), the overall L1 gas consumption directly attributable to individual user transactions might be lower than if all those transactions occurred on L1.
• Periods of Low Burn: Consequently, there have been extended periods post-Merge where the amount of ETH burned via EIP-1559 has been insufficient to offset the ETH issued as staking rewards. During these times, ETH's supply becomes net inflationary, undermining the deflationary narrative that was a strong catalyst in previous cycles.
While EIP-1559 remains a crucial and beneficial upgrade for Ethereum's fee market predictability, its power as a consistent deflationary force has been tempered by the current realities of network demand and the evolving Layer 2 landscape.
Synthesizing the Outlook: A Tug-of-War
The current situation for Ethereum is a complex tug-of-war. On one side, the historically low ETH/BTC ratio flashes a compelling "undervaluation" signal, suggesting a potential for significant upside based on past market behavior. This attracts traders looking for relative value plays and those who believe in Ethereum's long-term fundamental strengths.
On the other side, the fundamental picture is clouded by persistent, albeit reduced, supply issuance, a lack of explosive growth in network demand, and a burn mechanism whose deflationary impact is currently muted. These factors create genuine headwinds that could prevent ETH from easily replicating its past ratio-driven rallies.
For ETH to truly capitalize on its apparent undervaluation relative to Bitcoin, several things likely need to occur:
1. A Resurgence in Demand: This could come from a new "killer app" or narrative on Ethereum, a significant rebound in DeFi or NFT activity, increased institutional adoption (perhaps spurred by clearer regulation or new investment products like spot ETH ETFs in more jurisdictions), or a general improvement in macroeconomic conditions that boosts risk appetite.
2. Successful Maturation and Value Accrual from Layer 2s: As Layer 2 solutions mature and gain wider adoption, their success needs to translate into tangible value accrual for ETH itself. This could happen through increased L1 settlement demand, the use of ETH as a primary gas token on L2s, or innovative mechanisms that tie L2 economic activity back to the L1 token. EIP-4844 ("Proto-Danksharding") is a step in this direction by aiming to reduce L2 transaction costs, potentially fostering more L2 activity and, consequently, more L1 settlement.
3. A Shift in Broader Market Sentiment: Often, major altcoin rallies, including for ETH, occur after Bitcoin has established a strong uptrend and market sentiment becomes broadly bullish. A sustained Bitcoin rally could create a "wealth effect" and encourage capital to rotate into ETH and other altcoins.
Conclusion: Caution Warranted Despite Undervaluation Signals
While the ETH/BTC ratio strongly suggests that Ether is trading at a significant discount compared to Bitcoin, historical precedent alone may not be enough to guarantee a rally in the current market. The fundamental challenges posed by ongoing supply, relatively flat demand, and a less potent burn mechanism are significant and cannot be ignored.
Investors and traders eyeing ETH must weigh the allure of its apparent undervaluation against these tangible headwinds. A potential ETH rally is likely contingent not just on the ratio mean-reverting, but on a demonstrable improvement in Ethereum's core demand drivers and a favorable shift in the broader market environment. The "extremely undervalued" signal is a call for attention, but thorough due diligence and a clear understanding of the current complexities are more crucial than ever. Ethereum's long-term vision remains ambitious, but its path to reclaiming relative market dominance against Bitcoin in the near term appears more challenging than in previous cycles.

Bitcoin Hits $100K: Bull Run IgnitesWhat Tariff Shock? Bitcoin Surges Past $100K as Market Recovery Continues
The cryptocurrency market has been making headlines again as Bitcoin (BTC) surges past the $100,000 mark, signaling a robust recovery and potentially the start of a new bull cycle. In an environment marked by economic uncertainty, geopolitical tensions, and fluctuating central bank policies, Bitcoin’s remarkable resurgence has captured the attention of retail investors, institutional participants, and financial analysts alike.
This article delves into multiple facets of Bitcoin’s ongoing rally, including its recent rebound after a sharp drop, the role of whales in fueling the push toward $100K, the realized cap hitting a record high, and whether aggressive profit-taking by investors signifies a local top. Additionally, we’ll explore the implications of Bitcoin's return to $100K and why it hints at a "significant price move" that could shape the broader financial landscape.
________________________________________
Bitcoin Rebounds After Sharp Decline: The $100K Push
Bitcoin’s journey to $100,000 has been anything but smooth. After experiencing a sharp correction earlier in the year, many market participants feared that the cryptocurrency's bull run was over. However, Bitcoin's ability to rebound from its lows with renewed vigor has defied expectations.
Whales Drive the Rally
One key factor behind Bitcoin’s resurgence is the activity of "whales," large-scale investors who hold significant amounts of BTC. On-chain data reveals that whales have been accumulating Bitcoin during periods of lower prices, effectively acting as a stabilizing force during market downturns. By reducing liquidity in the market and concentrating their holdings, whales have created conditions conducive to a price surge.
In addition, whale wallets have been observed transferring large sums of Bitcoin out of exchanges and into cold storage, signaling a long-term bullish outlook. This withdrawal pattern reduces the supply of Bitcoin available for trading, increasing upward pressure on the price.
________________________________________
Realized Cap Hits Record High: A Bullish Signal
Another notable development supporting Bitcoin's rally is its realized capitalization (realized cap) hitting an all-time high. Unlike market capitalization, which multiplies the total supply of Bitcoin by the current price, the realized cap calculates the value of each Bitcoin at the price it was last moved. This metric provides a clearer picture of the aggregate cost basis of Bitcoin holders.
The realized cap reaching a record high indicates that a significant portion of Bitcoin has changed hands at higher price levels, reflecting increased investor confidence. This metric aligns with the narrative of accumulation, as both retail and institutional investors appear to be buying Bitcoin at higher prices in anticipation of future gains.
Accumulation Continues
On-chain analytics reveal that accumulation trends have persisted throughout Bitcoin's recovery. Wallet addresses holding between 1 and 10 BTC have grown substantially, showing that smaller investors are also entering the market. This broad-based accumulation not only adds to Bitcoin's bullish momentum but also reduces volatility by distributing supply across a wider range of participants.
________________________________________
Profit-Taking and Local Top Concerns
While Bitcoin's surge past $100,000 has been met with enthusiasm, some analysts caution that aggressive profit-taking by investors could signal a local top. Short-term holders, in particular, have been selling their Bitcoin to lock in gains, as evidenced by the increasing Spent Output Profit Ratio (SOPR).
Signs of a Local Top?
A high SOPR indicates that investors are realizing profits at a significant rate, which often coincides with price corrections. However, it’s important to note that profit-taking is a natural part of any market cycle and does not necessarily signal the end of a bull run. In fact, periods of consolidation and minor corrections can strengthen the foundation for a more sustainable rally.
Market sentiment, as measured by the Fear & Greed Index, has also entered the "Greed" zone, suggesting that bullish enthusiasm may be running high. Historically, extreme greed has preceded short-term pullbacks, making it crucial for investors to remain cautious.
________________________________________
New Bull Cycle? Bitcoin’s Return to $100K Hints at Significant Price Move
Bitcoin’s return to the $100,000 milestone has rekindled hopes of a new bull cycle, with analysts pointing to several factors that support this narrative. The cryptocurrency market has historically moved in cycles, driven by supply-demand dynamics, macroeconomic conditions, and technological advancements. The current environment appears to align with the early stages of a new bull phase.
Institutional Adoption and Macro Tailwinds
Institutional interest in Bitcoin has grown exponentially over the past few years. Major financial institutions, including hedge funds, pension funds, and publicly traded companies, have embraced Bitcoin as a hedge against inflation and a store of value. This influx of institutional capital has not only validated Bitcoin’s role as a legitimate asset class but also provided a steady source of demand.
Moreover, macroeconomic tailwinds such as high inflation, declining confidence in fiat currencies, and geopolitical instability have enhanced Bitcoin's appeal as a decentralized, non-sovereign asset. Central banks’ monetary policies, including quantitative easing and low interest rates, have further eroded the purchasing power of traditional currencies, driving investors toward Bitcoin.
Supply Shock and Halving Cycles
Bitcoin’s fixed supply of 21 million coins and its halving cycles play a crucial role in its price dynamics. The most recent halving in 2024 reduced the block reward for miners, effectively decreasing the rate at which new Bitcoin enters circulation. This supply shock, coupled with growing demand, has historically preceded significant price rallies.
On-chain data shows that long-term holders, who typically accumulate Bitcoin during bear markets, are now distributing their holdings during this bull phase. This redistribution of supply suggests that a new wave of investors is entering the market, further fueling the rally.
________________________________________
What’s Next for Bitcoin?
As Bitcoin continues to defy expectations, the question on everyone’s mind is: What’s next? While predicting Bitcoin’s price movements with precision is challenging, several scenarios could play out in the near term.
Scenario 1: Sustained Bull Run
If accumulation trends persist and institutional interest continues to grow, Bitcoin could maintain its upward trajectory, potentially reaching new all-time highs. Key resistance levels to watch include $120,000 and $150,000, which could serve as psychological barriers for further price appreciation.
Scenario 2: Short-Term Correction
A short-term correction is always a possibility, especially given the aggressive profit-taking observed in recent weeks. However, such corrections are often healthy for the market, allowing for consolidation and setting the stage for more sustainable growth.
Scenario 3: Macro-Driven Volatility
External factors, such as changes in monetary policy, regulatory developments, or geopolitical events, could introduce volatility to the market. While Bitcoin has shown resilience in the face of macroeconomic challenges, it remains sensitive to major news events.
________________________________________
Conclusion
Bitcoin’s surge past $100,000 marks a pivotal moment for the cryptocurrency market, signaling a robust recovery and the potential start of a new bull cycle. Driven by whale activity, record-high realized capitalization, and persistent accumulation, Bitcoin has defied skeptics and reasserted its dominance as the leading digital asset.
While concerns about a local top and profit-taking are valid, the broader trends suggest that Bitcoin is preparing for a significant price move. Whether this rally leads to sustained growth or faces temporary setbacks, one thing is clear: Bitcoin remains a transformative force in the financial world, offering a decentralized, inflation-resistant alternative to traditional assets.
As we look ahead, the combination of institutional adoption, macroeconomic tailwinds, and Bitcoin’s unique monetary policy positions it for continued success. For investors and enthusiasts, the journey to $100,000 and beyond is more than just a milestone—it’s a testament to the enduring promise of blockchain technology and the future of decentralized finance.

Bitcoin - Bulls vs Bears: 88k or 100k?Bitcoin has broken through the 4H imbalance zone that also acted as an old resistance area. The break came through a clear displacement candle, which showed strong intent from the market. That same move left behind a new gap just under the previous resistance. Although price already retested that area once, it didn’t fully fill the gap, so we could see one more retest to complete the 50% line before the market chooses direction.
Consolidation Structure
The range before the breakout was clean, with multiple rejections from the resistance zone. That zone was front-run several times, then finally broken with conviction. Now, price is hovering just under that broken level, and the new gap created by the displacement candle is still fresh and technically unfilled.
Below current price, there’s a large inefficiency sitting between 88.2k and 90k. This zone stands out because it’s not only a clean 4H imbalance, but it also aligns with the golden pocket retracement from the last major leg up. That type of confluence usually attracts liquidity, especially if price gets rejected from the gap above and starts moving lower.
Bullish/Bearish Scenarios
The bullish scenario would play out if price manages to reclaim the gap zone, pushes back above the resistance cleanly, and treats the gap as support. That would be a classic structure flip, where the previous resistance becomes a new base, and the gap gets inverted into a continuation zone. If we see that, the next upside targets would sit around the 96k to 97k area, where more liquidity is likely resting.
On the other hand, if price moves into the gap and gets rejected again, that confirms sellers are still active at that level. In that case, I’d expect the market to push down and start filling the inefficiencies below. The 88.2k to 90k area becomes the primary draw. It’s packed with confluence from the 4H imbalance and the golden pocket, and it also lines up with previous demand zones. If price reaches into that area, it could trigger a strong reaction and potentially form the next higher low.
Price Target and Expectations
If we see rejection from the current gap, the target shifts to the 88.2k to 90k zone. That’s where I’ll be watching for bullish signs, since it’s the type of level where buyers often step in. A clean reaction there could be the start of a new leg higher. But if the market doesn’t get that low, and instead pushes up through the resistance, then the bullish breakout scenario is active, and we’d be aiming higher toward the 96k range or even the 100k.
Current Stance
Right now, I’m in reactive mode. The trade will depend on what happens at the gap zone. If we get another rejection from it, I’ll look for a move into the golden pocket below. If we reclaim the gap and break resistance, I’ll be looking to enter on confirmation of the flip. No trade from the middle, only once price gives clear direction from either key level.
Conclusion
This is a clean two-scenario setup. Either price fills the remaining gap and flips resistance, triggering the bullish continuation, or we reject from that area again and drop into the 88.2k to 90k range for a deeper liquidity grab. Both are valid, and both offer high-probability trades once price confirms the path.
___________________________________
Thanks for your support!
If you found this idea helpful or learned something new, drop a like 👍 and leave a comment, I’d love to hear your thoughts! 🚀
Make sure to follow me for more price action insights, free indicators, and trading strategies. Let’s grow and trade smarter together! 📈

BTC/USDT Analysis: Resumption of a Full Bullish Trend
Hello everyone! This is CryptoRobotics' trader-analyst with the daily analysis.
Yesterday, Bitcoin finally broke the previous high. There was no false breakout or seller defense on higher timeframes, so the uptrend continues.
The next target is $105,000.
A local support zone has formed at $98,000–$97,200 after the breakout. So far, there are no signs of seller presence, but low volume remains a concern. Any strong surge in seller activity could trigger a significant correction.
Resistance zones:
$107,000–$109,000 (volume anomalies)
Support zones:
$98,000–$97,200 (local support)
$91,500–$90,000 (strong buy-side imbalance)
$88,100–$87,000 (absorption of market selling)
$85,500–$84,000 (accumulated volumes)
$82,700–$81,400 (volume zone)
Level $74,800
$69,000–$60,600 (accumulated volumes)
This publication is not financial advice.

Bitcoin Daily Update - It is now the STRONGEST ASSET
The FED tells us that borrowing will remain as expensive as it was before, No change and so now, we see traders relax and BTC PA rises.
Bitcoin is now showing Huge strength, bang on time
The Blue Dashed line above is the current ATH and we may end up near there in the next few weeks, providing we keep momentum.
Before this, we may see PA slide down the top side of this red 236 Fib circle, using it as support while the Daily MACD cools off. The Daily MACD is not oversikd tghough, so can push higher yet.
PA also broke over the 2.628 Fib extension. It may not want to loose that.
We wait again but in confidence.
But that is not All - Look at this Chart
This is a 4 hour chart of
Bitcoin - Gold
DXY $ - S&P500
What is highly unusual here is how Bitcoin and the $ BOTH ROSE at the same time !
I will write more about this in another post but THIS Alone shows a Vast market swing and possibly a lack of faith in the $.
BUY BITCOIN AND HOLD

Bitcoin Total Market Cap Update – Strategic Scenarios AheadAs of May 8, 2025, the total cryptocurrency market capitalization stands at approximately \$3.012 trillion, reflecting a 2.17% increase from the previous day . Bitcoin's market cap is around \$1.962 trillion, with a current price of \$98,798.11 .
Given these figures, we are considering the following potential scenarios for the crypto market:
---
1. Break Above \$3T and Hold ✅ (30% Probability)
* The market breaks through the \$3 trillion level.
* Retests it as support.
* Continues the bullish momentum from there.
---
2. Rejection and Consolidation 🔁 (50% Probability)
* Price gets rejected at \$3T.
* Moves sideways between \$2.8T and \$3T.
* Eventually breaks out and retests \$3T as support before resuming upward.
---
3. Bearish Turn Below \$2.8T 🔻 (20% Probability)
* Rejection at \$3T.
* Market loses \$2.8T support.
* Retests \$2.8T as resistance, followed by further downside pressure.
---
Key Levels to Watch
* \$2.8T and \$3T are critical zones. Movements between these levels indicate uncertainty and should be approached with caution.
---
Our Perspective
A retest of \$3T as support could present the strongest buying opportunity of this cycle. We urge everyone to stay alert, analyze carefully, and prepare accordingly.
Golden Cross is looming — remain focused and disciplined.
---
Stay updated and connected:
With best regards,
Team ProCryptoEdge
Educate. Empower. Elevate.

Trade Idea: BTCUSD Long (BUY LIMIT)Technical Analysis:
Daily Chart
• Trend: Strong uptrend with a recent bullish recovery from a pullback.
• MACD: Bullish crossover, MACD line above Signal line, histogram positive.
• RSI (14): 66.21 — momentum is strong but not overbought.
15-Minute Chart
• MACD: Positive histogram and crossover confirming short-term bullish momentum.
• RSI (14): 53.89 — mid-range, confirming no immediate exhaustion.
• Price Action: Higher lows and higher highs indicate short-term trend alignment with the Daily.
3-Minute Chart
• MACD: Bearish divergence, indicating a possible short-term pullback.
• RSI (14): 43.43 — recent dip offering a better long entry on minor weakness.
• Price: Currently consolidating near $97,000 after rejecting a local high.
⸻
Fundamental Context:
• Macro: Institutional inflows into BTC ETFs and upcoming monetary easing expectations are long-term bullish drivers.
• Market Sentiment: Risk-on behavior across equities is spilling into crypto.
⸻
Trade Setup (Long Position)
• Entry: $96,800
• Minor pullback support zone on M15/M3, aligns with moving average and volume node.
• Stop Loss (SL): $95,400
• Below recent swing low and structural support.
• Take Profit (TP): $100,200
• Near Daily resistance and psychological round number FUSIONMARKETS:BTCUSD

BTC/USDT Analysis: Watching the Reaction at the HighHello everyone! This is a daily analysis from the trader-analyst at CryptoRobotics.
Yesterday, Bitcoin finally broke out of the range to the upside. The local selling zone at $96,100–$96,600 didn’t show any reaction. On the retest, it acted as a mirror level and supported continued growth.
At the moment, the local bias has shifted. All major volume clusters are now located below the price, so we can expect a new high. If we break through the current high, it’s important to watch the sellers' reaction. A false breakout could lead to a significant drop, but if it doesn't happen, the next potential target is $105,000.
Sell zones:
$98,000 (key level)
$107,000–$109,000 (volume anomalies)
Buy zones:
$91,500–$90,000 (strong buy-side imbalance)
$88,100–$87,000 (absorption of market selling)
$85,500–$84,000 (accumulated volumes)
$82,700–$81,400 (volume zone)
$74,800 (key level)
$69,000–$60,600 (accumulated volumes)
What do you think — which scenario will play out?
Drop your thoughts in the comments — it's always interesting to compare views!
This publication is not financial advice.

Bitcoin Still Stuck in Resistance – Eyes on CME Gaps & USDT.D%Bitcoin ( BINANCE:BTCUSDT ) touched $92,830(first target) and started to rise as I expected in the previous idea . Overall, Bitcoin has been moving in a range for about 12 days .
Note : In general, trading in a range market is more difficult than in a trending market . If your performance in a range market is not good, it is better not to trade until the trend is clear (this is just a suggestion).
Bitcoin is currently trading at a Heavy Resistance zone($95,950-$88,500) and has failed to break through it, and it seems like Bitcoin needs more momentum to break through this zone. Do you think Bitcoin will finally break through the Heavy Resistance zone($95,950-$88,500)?
In terms of Elliott Wave theory , it appears that Bitcoin has completed a five-wave impulsive and we should expect Corrective waves .
The analytical conditions of the Bitcoin chart have been a bit ambiguous in the past few days, so it's better to take a look at the USDT.D% ( CRYPTOCAP:USDT.D ) chart to increase the accuracy of Bitcoin analysis .
USDT.D% failed to break the Support zone(5.13%-4.95%) after several attacks. It currently appears to be forming an Ascending Broadening Wedge Pattern . It appears that USDT.D% needs to complete this pattern to break the support zone, and if this pattern fails , we should expect further increases =Bitcoin crash .
I expect Bitcoin to decline to the Support zone($92,910-$91,414) , 21_SMA(Weekly) and Cumulative Long Liquidation Leverage($93,359-$92,296) and probably fill the CME Gap($92,525-$91,415) this time and then start to rise and prepare to break the Heavy Resistance zone($95,950-$88,500) and fill the CME Gap($97,680-$96,455) .
Cumulative Short Liquidation Leverage: $98,989-$97,924
Note: If Bitcoin breaks below the Support zone($92,910-$91,414), we should expect further declines.
Please respect each other's ideas and express them politely if you agree or disagree.
Bitcoin Analyze (BTCUSDT), 1-hour time frame.
Be sure to follow the updated ideas.
Do not forget to put a Stop loss for your positions (For every position you want to open).
Please follow your strategy and updates; this is just my Idea, and I will gladly see your ideas in this post.
Please do not forget the ✅' like '✅ button 🙏😊 & Share it with your friends; thanks, and Trade safe.

Bitcoin - Is It Possible to Test the ATH Once More?The weekly structure on Bitcoin remains firmly bullish. After consolidating below major resistance through much of 2024, price finally broke out decisively in November 2024, triggering a clean impulsive move that led to a new all-time high in January 2025. That breakout was significant, not just a short-term spike but a structural shift that confirmed long-term bullish momentum.
Since then, Bitcoin pulled back in a controlled and clean fashion, retesting the same zone that initiated the breakout. This type of price action, revisiting the origin of displacement and holding above it, is classic trending behavior and shows that the market still respects the bullish order flow.
Consolidation Structure
The zone that once acted as resistance has now flipped into support. Price dipped into the weekly candles that caused the breakout and closed above them, showing that buyers are still in control. That area also aligned with a fair value gap, giving additional confluence. The reaction out of this zone was strong, confirming it as a valid demand level.
Since that retest, we’ve seen another leg up, and now a new weekly fair value gap has formed just beneath the current price. I’m watching that imbalance as a potential short-term pullback area, and ideally, I want to see price fill it to around the 50 percent level before continuing higher.
Bullish/Bearish Scenarios
The bullish scenario remains valid as long as Bitcoin continues to hold above the previous breakout zone. I’m expecting a pullback into the newly formed fair value gap, ideally down toward $89,000, which marks the 50 percent line of the imbalance. If price taps that level and begins to bounce, that would be a potential signal for continuation toward the highs.
The bearish scenario only comes into play if price breaks back below the original breakout zone, invalidating the structure and showing weakness across the weekly levels. As long as we stay above that structure, there’s no reason to fade the trend.
Price Target and Expectations
Main expectation is a healthy pullback into the $89,000 zone to partially fill the new weekly imbalance. From there, I’ll be watching for signs of strength such as bullish engulfing candles or strong closes above the midrange of the gap. If buyers show up there, the logical next step is another attempt at the all-time high.
The ATH remains the key target for this leg, and that’s where I’ll be looking to take partial profits or reduce risk depending on how price behaves near that zone.
Current Stance
Still leaning bullish. Structure is clean, key levels are being respected, and the market has shown a clear tendency to react from weekly imbalances. I’m not chasing price into highs, but I am interested in the 89K region as a potential re-entry zone. If price gives a clean reaction there, I’ll be looking to scale in or add to existing positions.
NEWS TOMORROW
Keep in mind that FOMC is scheduled for tomorrow, which could bring a wave of volatility across all risk assets. That might trigger wicks or erratic price action even if the higher timeframe trend remains intact. Manage risk accordingly, don’t overreact to the first move, and stay focused on the weekly structure. As long as the market respects it, this still looks like a setup that wants to reach for the ATH once more.
Conclusion
Bitcoin broke out in November 2024, reached a new ATH in January 2025, and has since pulled back to retest the zone that caused the breakout. That retest held perfectly and has now led to another move higher. With a new weekly gap in play, I’m watching for a 50 percent fill around 89K before the market potentially gears up for another attempt at the highs.
___________________________________
Thanks for your support!
If you found this idea helpful or learned something new, drop a like 👍 and leave a comment, I’d love to hear your thoughts! 🚀
Make sure to follow me for more price action insights, free indicators, and trading strategies. Let’s grow and trade smarter together! 📈

BTC/USDT Analysis: Is the Long Trend in Question?
Hello everyone! This is a daily update from a CryptoRobotics trader-analyst.
Last week, posts were not published every weekday due to holidays — but we’re back now.
Yesterday, Bitcoin reached a support zone. Signs of defense were observed, but so far, there has been no meaningful recovery.
In the current buy zone, the power balance remains even: on one hand, market buyers failed to resume the uptrend, but on the other, we noticed absorption of sell orders according to delta analysis.
At the moment, the buyer appears weak, so entering long positions is not advisable.
The main scenario remains bearish. In addition to the two scenarios described yesterday, a third one has emerged — a short entry from the current price.
Sell Zones:
$96,100–$96,600 (local volume area)
Level $98,000
$107,000–$109,000 (volume anomalies)
Buy Zones:
$95,000–$93,400 (accumulated volumes)
$91,500–$90,000 (strong buying imbalance)
$88,100–$87,000 (absorption of market selling)
$85,500–$84,000 (accumulated volumes)
$82,700–$81,400 (volume area)
Level $74,800
$69,000–$60,600 (accumulated volumes)
What scenario do you think is most likely?
Share your thoughts in the comments — it’s always interesting to compare perspectives!
This publication is not financial advice.

Bitcoin ETF IBIT Next TargetThe Bitcoin INDEX:BTCUSD ETF NASDAQ:IBIT is shaping a 5-wave move toward a new ATH, set to complete its cycle within a regular impulse.
Key technical area for the next move higher:
🔵 Inverted wave (4) target : $66 - $73
🟡 Wave (1)(2) extension : $68
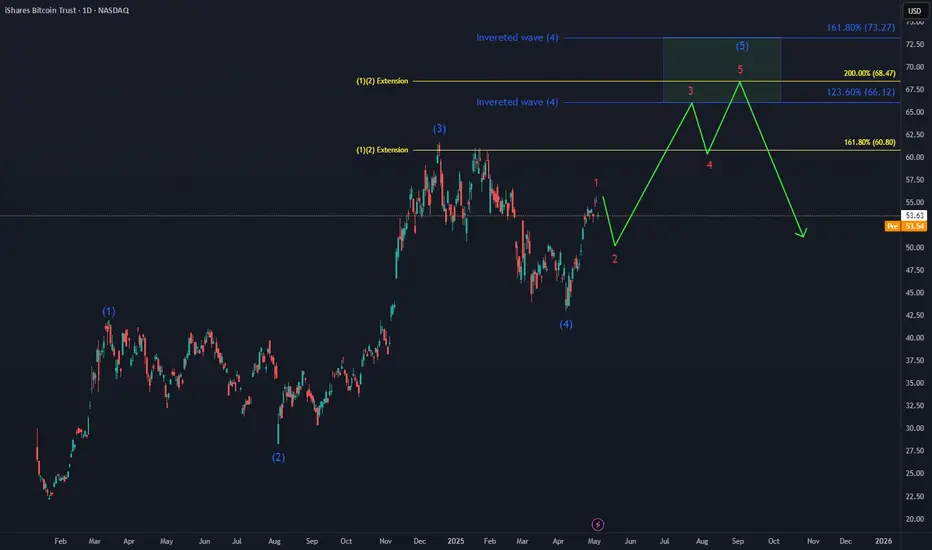
Market overview
WHAT HAPPENED?
Last week, for bitcoin, we got an exit from the sideways trend in the upward direction, but the growth wasn’t significantly confirmed by volumes. The price reached the key resistance zone of $97,500–$98,400 (pushing volumes), from which we received a reaction.
Currently, BTC has adjusted to the buy zone of $95,000–$93,400 (accumulated volumes), the buyer's reaction is present.
WHAT WILL HAPPEN: OR NOT?
There is a high probability of a test of lower levels this week. This scenario is confirmed by the following factors:
• a steady delta advantage in the direction of sales, which prevents the development of a full-fledged upward movement;
• rather weak trading volumes;
• the wave structure, which has already called into question the current exit from the sideways trend, the price has returned to its framework.
We consider the development of the correction through one of the marked scenarios on the chart.
Sell Zones:
$96,100–$96,600 (local volume area)
Level $98,000
$107,000–$109,000 (volume anomalies)
Buy Zones:
$95,000–$93,400 (accumulated volumes)
$91,500–$90,000 (strong buying imbalance)
$88,100–$87,000 (absorption of market selling)
$85,500–$84,000 (accumulated volumes)
$82,700–$81,400 (volume area)
Level $74,800
$69,000–$60,600 (accumulated volumes)
IMPORTANT DATES
On macroeconomic developments this week:
• Monday, May 5, 13:45 (UTC) — publication of the index of business activity in the US services sector for April;
• Monday, May 5, 14:00 (UTC) — ISM Purchasing Managers' Index for the non-manufacturing sector of the United States for April;
• Wednesday, May 7, 18:00 (UTC) — publication of the FOMC statement and the US Federal Reserve interest rate decision;
• Wednesday, May 7, 18:30 (UTC) — FOMC press conference;
• Thursday, May 8, 11:00 (UTC) - announcement of the interest rate decision The Bank of England in May;
• Thursday, May 8, 12:00 (UTC) — publication of the inflation letter from the Bank of England;
• Thursday, May 8, 12:30 (UTC) — publication of the number of initial applications for unemployment benefits in the United States.
*This post is not a financial recommendation. Make decisions based on your own experience.
#analytics
